Báo cáo hóa học: " Research Article Evolutionary Splines for Cepstral Filterbank Optimization in Phoneme Classification" potx
Bạn đang xem bản rút gọn của tài liệu. Xem và tải ngay bản đầy đủ của tài liệu tại đây (1.47 MB, 14 trang )
Hindawi Publishing Corporation
EURASIP Journal on Advances in Signal Processing
Volume 2011, Article ID 284791, 14 pages
doi:10.1155/2011/284791
Research Article
Evolutionary Splines for Cepstral Filterbank Optimization in
Phoneme Classification
Leandro D. Vignolo,
1
Hugo L. Rufiner,
1
Diego H. Milone,
1
and John C. Goddard
2
1
Research Center for Signals, Systems and Computational Intelligence, De partment of Informatics, National University of Litoral,
CONICET, Santa Fe, 3000, Argentina
2
Departamento de Ingenier
´
ıa El
´
ectrica, Universidad Aut
´
onoma Metropolitana, Unidad Iztapalapa, Mexico D.F., 09340, Mexico
Correspondence should be addressed to Leandro D. Vignolo,
Received 14 July 2010; Revised 29 October 2010; Accepted 24 December 2010
Academic Editor: Raviraj S. Adve
Copyright © 2011 Leandro D. Vignolo et al. This is an open access article distributed under the Creative Commons Attribution
License, which permits unrestricted use, distribution, and reproduction in any medium, provided the original work is properly
cited.
Mel-frequency cepstral coefficients have long been the most widely used type of speech representation. They were introduced to
incorporate biologically inspired characteristics into artificial speech recognizers. Recently, the introduction of new alternatives
to the classic mel-scaled filterbank has led to improvements in the performance of phoneme recognition in adverse conditions.
In this work we propose a new bioinspired approach for the optimization of the filterbanks, in order to find a robust speech
representation. Our approach—which relies on evolutionary algorithms—reduces the number of parameters to optimize by using
spline functions to shape the filterbanks. The success rates of a phoneme classifier based on hidden Markov models are used as
the fitness measure, evaluated over the well-known TIMIT database. The results show that the proposed method is able to find
optimized filterbanks for phoneme recognition, which significantly increases the robustness in adverse conditions.
1. Introduction
Most current speech recognizers rely on the traditional
mel-frequency cepstral coefficients (MFCC) [1] for the
feature extraction phase. This representation is biologically
motivated and introduces the use of a psychoacoustic scale
to mimic the frequency response in the human ear.
However, as the entire auditory system is complex and
not yet fully understood, the shape of the true optimal
filterbank for automatic recognition is not known. More-
over, the recognition performance of automatic systems
degrades when speech signals are contaminated with noise.
This has motivated the development of alternative speech
representations, and many of them consist in modifications
to the mel-scaled filterbank, for which the number of
filters has been empirically set to different values [2].
For example, Skowronski and Harris [3, 4]proposeda
novel scheme for determining filter bandwidth and reported
significant recognition improvements compared to those
using the MFCC traditional features. Other a pproaches
follow a common strategy which consists in optimizing a
speech representation so that phoneme discrimination is
maximized for a given corpus. In this sense, the weighting
of MFCC according to the signal-to-noise ratio (SNR) in
each mel band was proposed in [5]. Similarly, [6]proposeda
compression of filterbank energies according to the presence
of noise in each mel subband. Other modifications to the
classical representation were introduced in recent years [7–
9]. Further, in [10], linear discriminant analysis was studied
in order to optimize a filterbank. In a different approach,
the use of evolutionary algorithms has been proposed in
[11] to evolve speech features. An evolution strategy was
also proposed in [12], but in this case for the optimiza-
tion of a wavelet packet-based representation. In another
evolutionary approach, for the task of speaker verification,
polynomial functions were used to encode the parameters
of the filterbanks, reducing the number of optimization
parameters [ 13]. However, a complex relation between
the polynomial coefficients and the filterbank parameters
was proposed, and the combination of multiple optimized
filterbanks and classifiers requires important changes in a
standard ASR system.
2 EURASIP Journal on Advances in Signal Processing
Although these alternative features improve recognition
results in controlled experimental conditions, the quest
for an optimal speech representation is still incomplete.
We continue this search in the present paper using a
biologically motivated technique based on evolutionary
algorithms (EAs), which have proven to be effective in
complex optimization problems [14]. Our approach, called
evolutionary splines cepstral coefficients (ESCCs), makes use
of an EA to optimize a filterbank, which is used to calculate
scaled cepstral coefficients.
This novel approach improves the traditional signal
processing technique by the use of an evolutionary optimiza-
tion method; therefore, the ESCC can also be considered
as a bioinspired signal representation. Moreover, one can
think about this strategy as related to the evolution of
the animal’s auditory systems. The center frequencies and
bandwidths, of the bands by which a signal is decomposed
in the ear, are thought to result from the adaptation of
cochlear mechanisms to the animal’s auditory environment
[15]. From this point of view, the filterbank optimization
that we address in this work is inspired by natural evolution.
Finally, this novel approach should be seen as a biologically
motivated technique that is useful for filterbank design and
can be applied in different applications.
In order to reduce the number of parameters, the
filterbanks are tuned by smooth functions which are encoded
by individuals in the EA population. Nature seems to use
“tricks” like this to reduce the number of parameters to
be encoded in our genes. It is interesting to note some
recent findings that suggest a significant reduction in the
estimated number of human genes that encode proteins [16].
Therefore, the idea of using splines in order to codify several
optimization parameters with a few genes is also inspired by
nature.
A classifier employing a hidden Markov model (HMM)
is used to evaluate the individuals, and the fitness is given
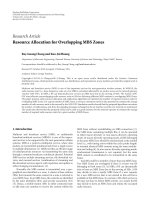
by the phoneme classification result. The ESCC approach
is schematically outlined in Figure 1. The proposed method
attempts to find an optimal filterbank, which in turn
provides a suitable signal representation that improves on the
standard MFCC for phoneme classification.
In a previous work, we proposed a strategy in which
different parameters of each filter in the filterbank were
optimized, and these parameters were directly coded by the
chromosomes [17]. In this way, the size of the chromosomes
was proportional to the number of filters and the number
of parameters, resulting in a large and complex search
space. Although the optimized filterbanks produced some
phoneme recognition improvements, the fact that very
different filterbanks also gave similar results suggested that
the search space should be reduced. That is why our new
approach differs f rom the previous one in that the filter
parameters are no longer directly coded by the chromo-
somes. More precisely, the filterbanks are defined by spline
functions whose parameters are optimized by the EA. In this
way, with only a few parameters coded by the chromosomes,
we can optimize several filterbank characteristics. This means
that the search space is significantly reduced whilst still
keeping a wide range of potential solutions.
Feature extraction
Evolutionary cepstral
coefficients
Phoneme
classifier
Phoneme
corpus
Evolutionary
filterbank
optimization
Figure 1: General scheme of the proposed method.
This paper is organized as follows. In the following
section, some basic concepts about EAs are given and the
steps for computing traditional MFCC are explained. Also, a
description of the phoneme corpus used for the experiments
is provided. Subsequently, the details of the proposed
method and its implementation are described. In the last
sections, the results of phoneme recognition experiments are
provided and discussed. Finally, some general conclusions
and proposals for f uture work are given.
2. Preliminaries
2.1. Evolutionary Algorithms. Evolutionary algorithms are
metaheuristic optimization methods motivated by the pro-
cess of natural evolution [18]. A classic EA consists of three
kinds of operators: selection, variation, and replacement
[19]. Selection mimics the natural advantage of the fittest
individuals, giving them more chance to reproduce. The
purpose of the variation operators is to combine information
from different individuals and also to maintain population
diversity, by randomly modifying chromosomes. Whether
all the members of the current population are replaced by
the offspring is determined by the replacement strategy.
The information of a possible solution is coded by the
chromosome of an individual in the population, and its
fitness is measured by an objective function which is specific
to a given problem. Parents, selected from the population,
are mated to generate the offspring by means of the variation
operators. The population is then replaced and the cycle
is repeated until a desired termination criterion is reached.
Once the evolution is finished, the best individual in the
population is taken as the solution for the problem [20].
Evolutionary algorithms are inherently parallel, and one
can benefit from this in a number of ways to increase the
computational speed [12].
2.2. Mel-Frequency Cepstral Coefficients. The most popular
features for speech recognition are the mel-frequency cep-
stral coefficients, which provide greater noise robustness in
comparison to the linear-prediction-based feature extraction
techniques, but even so they are highly affected by environ-
mental noise [21].
Cepstral analysis assumes that the speech signal is
produced by a linear system. This means that the magnitude
spectrum of a speech sig nal Y( f ) can be formulated as
EURASIP Journal on Advances in Signal Processing 3
0 1000 2000 3000 4000 5000 6000 7000 8000
0
1
Frequency (Hz)
Gain
0.5
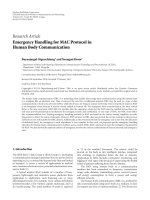
Figure 2: A mel filterbank in which the gain of each filter is scaled
by its bandwidth to equalize filter output energies.
the product Y( f ) = X( f )H( f ) of the excitation spectrum
X( f ) and the frequency response of the vocal tract H( f ).
The speech signal spectrum Y( f ) can be transformed by
computing the logarithm to get an additive combination
C( f )
= log
e
|X( f )|+log
e
|H( f )|, and the cepstral coefficients
c(n) are obtained by taking the inverse Fourier transform
(IFT) of C( f ).
Due to the fact that H( f ) varies more slowly than
X( f ), in the cepstral domain the information corresponding
to the response of the vocal tract is not mixed with the
information from the excitation signal and is represented
by a few coefficients. This is why the cepstral coefficients
are useful for speech recognition, as the information that
is useful to distinguish different phonemes is given by the
impulse response of the vocal tract.
In order to incorporate findings about the critical bands
in the human auditory system into the cepstral features,
Davis and Mermelstein [1] proposed decomposing the log
magnitude spectrum of the speech signal into bands accord-
ing to the mel-scaled filterbank. Mel is a perceptual scale
of fundamental frequencies judged by listeners to be equal
in distance from one another [22], and the mel filterbank
(MFB) consists of triangular overlapping windows. If the M
filters of a filterbank are given by H
m
( f ), then the log-energy
output of each filter m is computed by
S
[
m
]
= ln
X( f )
2
H
m
f
df
. (1)
Then, the mel-frequency cepstrum is obtained by applying
the discrete cosine transform to the discrete sequence of filter
outputs:
c
[
n
]
=
M−1
m=0
S
[
m
]
cos
πn
(
m − 1/2
)
M
,0≤ n<M. (2)
These coefficients are the so-called mel-frequency cepstral
coefficients (MFCCs) [23].
Figure 2 shows an MFB made u p of 23 equal-area filters
in the frequency range from 0 to 8 kHz. The bandwidth of
each filter is determined by the spacing of central frequencies,
which is in turn determined by the sampling rate and
the number of filters [24]. This means that, given the
sampling rate, if the number of filters increases, bandwidths
decrease and the number of MFCC increases. For both
MFCC and ESCC, every energy coefficient resulting from
band integration is scaled, by the inverse of the filter area for
MFCC, and by optimized weight parameters in the case of
ESCC.
3. Evolutionary Splines Cepstral Coefficients
The search for an optimal filterbank could involve the
adjustment of several parameters, such as the number of
filters, and the shape, amplitude, position, and width of
each filter. The optimization of all these parameters together
is extremely complex; so in previous work we decided to
maintain some of the parameters fixed [17]. However, when
considering triangular filters, each of which was defined by
three parameters, the results showed that we were dealing
with an ill-conditioned problem.
In order to reduce the chromosome size and the search
space, here we propose the codification of the filterbanks
by means of spline functions. We chose splines b ecause
they allow us to easily restrict the starting and end points
of the functions’ domain, and this was necessary because
we wanted all possible filterbanks to cover the frequency
range of interest. This restriction benefits the regularity of
the candidate filterbanks. We denote the curve defined by a
spline by y
= c(x), where the variable x takes n
f
equidistant
values in the range (0,1) and these points are mapped to
the range [0, 1]. Here, n
f
stands for the number of filters
in a filterbank; so every value x[i] is assigned to a filter
i,fori
= 1, , n
f
. The frequency positions, determined
in this way, set the frequency values where the triangular
filters reach their maximum, which will be in the range
from 0 Hz to half the sampling frequency. As can be seen
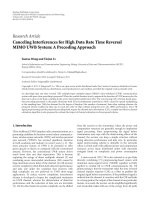
on Figure 3(b), the starting and ending frequencies of each
filter are set to the points where its a djacent filters reach their
maximum. Therefore, the filter overlapping is restricted.
Here we propose the optimization of two splines: the first
one to arrange the frequency positions of a fixed number of
filters and the second one to set the filters amplitude.
Splines for Optimizing the Frequency Position of the Filters.
In this case the splines are monotonically increasing and
constrained such that c(0)
= 1andc(1) = 1, while the
free parameters are composed of the y values for two fixed
values of x, and the derivatives at the points x
= 0and
x
= 1. These four optimization parameters are schematized
in Figure 3(a) and cal led y
1
= c(x
1
), y
2
= c(x
2
), σ and ρ,
respectively. As the splines are intended to be monotonically
increasing, parameter y
2
is restricted to be equal to or greater
than y
1
. Then, parameter y
2
is obtained as y
2
= y
1
+ δ
y
2
,
and the parameters which are coded in the chromosomes are
y
1
, δ
y
2
, σ,andρ. Given a particular chromosome, which sets
the values of these parameters, the y[i] corresponding to the
x[ i]foralli
= 1, , n
f
are obtained by spline interpolation,
using [25]
y
[
i
]
= P
[
i
]
y
1
+ Q
[
i
]
y
2
+ R
[
i
]
y
1
+ S
[
i
]
y
2
,(3)
where y
1
and y
2
are the second derivatives at points y
1
and
y
2
,respectively.P[i], Q[i], R[i], and S[i]aredefinedby
P
[
i
]
x
2
− x
[
i
]
x
2
− x
1
, R
[
i
]
1
6
(
P
[
i
]
)
3
− P
[
i
]
(
x
2
− x
1
)
2
,
Q
[
i
]
1
− P
[
i
]
, S
[
i
]
1
6
(
Q
[
i
]
)
3
− Q
[
i
]
(
x
2
− x
1
)
2
.
(4)
4 EURASIP Journal on Advances in Signal Processing
x
1
x
2
x
1
0
0
1
a
ρ
y
y
1
y
2
f
1
− a
σ
(a)
x
1
x
2
x
1
0
1
y
y
y
1
yy
2
yyy
4
y
3
(b)
Figure 3: Schemes illustrating the use of splines to optimize the filterbanks. (a) A spline being optimized to determine the frequency position
of filters, and (b) a spline being optimized to determine the amplitude of the filters.
However, the second derivatives y
1
and y
2
, which are
generally unknown, are required in order to obtain the
interpolated values y[i] using (3). In the case of cubic splines
the first derivative is required to be continuous across the
boundary of two intervals, and this requirement allows to
obtain the equations for the second derivatives [25]. The
required equations are obtained by setting the first derivative
of (3)evaluatedforx
j
in the interval (x
j−1
, x
j
) equal to the
same derivative evaluated for x
j
but in the interval (x
j
, x
j+1
).
This way a set of linear equations is obtained, for which
it is necesary to set boundary conditions for x
= 0and
x
= 1 in order to obtain a unique solution. These boundary
conditions may be set by fixing the y values for x
= 0and
x
= 1, or the values for the derivative σ and ρ.
All the y[i] are then linearly mapped to the frequency
range of interest, namely, from 0 Hz to half sampling
frequency ( f
s
), in order to adjust the frequency values where
the n
f
filters reach their maximum, f
c
i
:
f
c
i
=
y
[
i
]
− y
min
f
s
y
max
− y
min
,(5)
where y
min
and y
max
are the spline minimum and maximum
values, respectively. As can be seen in Figure 3(a),for
segments where y increases fast the filters are far from each
other, and for segments where y increases slowly the filters
are closer together. Parameter a in Figure 3(a) controls the
range of y
1
and y
2
(and δ
y
2
), and it is set in order to reduce
the number of splines with y values outside of [0, 1]. The
chromosomes which produce splines that go beyond the
boundaries are penalized, and the corresponding curves are
0 0.1 0.2 0.3 0.4 0.5 0.6 0.7 0.8 0.9 1
0
0.2
0.4
0.6
0.8
1
x
y
Mel
Splines
Figure 4: Mel-scale and spline-scale examples comparison.
modified so that y values lower than 0 are set to 0 while values
greater than 1 are set to 1. Figure 4 shows some examples
of splines that meet the restrictions and they are compared
with the classical mel mapping. Note that on the x-axis, n
f
equidistant points are considered, and the y-axis is mapped
to frequency in hertz, from zero to the Nyquist frequency.
Splines for Optimizing the Amplitude of the Filter s. The only
restriction for these splines is that y varies in the range [0, 1],
and the values at x
= 0andx = 1 are not fixed. So, in this
case the optimization parameters are the four corresponding
values y
1
, y
2
, y
3
,andy
4
for the fixed values x
1
, x
2
, x
3
,and
x
4
. These four y
j
parameters vary in the range [0, 1]. Here,
the interpolated y[i] values directly determine the gain of
each of the n
f
filters. This is outlined in Figure 3(b),where
the gain of each filter is weighted according to the spline.
EURASIP Journal on Advances in Signal Processing 5
Thus, it is expected to enhance the frequency bands which
are relevant for classification, wh ile disregarding those that
are noise-corrupted.
Note that, as will be explained in Section 3.2, using this
codification the chromosome size is reduced from n
f
to 4.
For instance, for a typical number of filters the chromosome
size is reduced from 30 to 4. Moreover, for the complete
scheme in which both filter positions and amplitudes are
optimized, the chromosome size is reduced from 60 to 8
genes. Indeed, with the splines codification the chromosome
size is independent of the number of filters.
3.1. Adaptive Training and Test Subse t Selection. In order
to avoid the problem of overfitting during the optimiza-
tion, we incorporate an adaptation of the training subset
selection method similar to the one proposed in [26]. The
filterbank parameters are evolved on selected subsets of
training and test patterns, which are modified throughout
the optimization. In every EA generation, training and test
subsets are randomly selected for the fitness calculation,
giving more chance to the test cases that were previously
misclassified and to those that have not been selected
for several generations. This strategy enables us to evolve
filterbanks with more variety, giving generalization without
increasing computational cost.
This is implemented by assigning a probability to each
training/test case. In the first generation, the probabilities are
initialized to the same value for all cases. For the training set,
the probabilities are fixed during the optimization, while the
probabilities for the test cases are updated every generation.
In this case, for generation g the probability of selection for
test case k is given by
P
k
g
=
W
k
g
S
j
W
j
g
,
(6)
where W
k
(g) is the weight assigned to test case k in
generation g,andS is the size of the subset selected. The
weight for a test case k is obtained by
W
k
g
=
D
k
g
+ A
k
g
,
(7)
where D
k
(g)(difficulty of test case k) counts the number of
times that test case k misclassified, and A
k
(g)(ageoftest
case k) counts the number generations since test case k was
selected for the last time. For every generation, the age of
every unselected case is incremented by 1, and the age of
every selected case is set to 1.
3.2. Des cription of the Optimization Process. In the EA
population, every individual encodes the parameters of the
splines that represent the different filterbanks, giving a
particular formula for the ESCC. A chromosome is coded
as a string of real numbers, its size is given by the number
of optimized splines multiplied by the number of spline
parameters, and they are initialized by means of a random
uniform distribution. In the following section we show
optimized filterbanks obtained by means of one and two
splines. In the case of one spline we optimized only the
Initialize random EA population
Initialize P
k
(g) = 1forallk
Select subsets and update A
k
(g)
Evaluate population
Update D
k
(g) based on classification results
repeat
Parent selection (roulette wheel)
Create new population from selected parents
Replace population
Given A
k
(g)andD
k
(g)obtainP
k
(g) using (6) and(7)
Select subsets and update A
k
(g)
Evaluate population
Update D
k
(g) based on classification results
until stopping criteria is met
Algorithm 1: Optimization for ESCC.
frequency position of the filters and in the case of two splines
we optimized both the frequency position and the filter
amplitudes. For these cases, the chromosomes were of size
4 and 8, respectively.
The EA uses the roulette wheel selection method [27],
and elitism is incorpor ated into the search due to its
proven capabilities to enforce the algorithm convergence
under certain conditions [18]. The elitist strategy consists
in maintaining the best individual from one generation
to the next. T he variation operators used in this EA are
mutation and crossover, and they were implemented as
follows. Mutation consists in the random modification of a
random spline parameter, using a uniform distribution. The
classical one-point crossover operator interchanges spline
parameters between different chromosomes. The selection
process should assign greater probability to the chromo-
somes providing the best filterbanks, and these will be the
ones that facilitate the classification task. The fitness function
consists of a phoneme classifier, and the fitness value of an
individual is its success rate.
The steps for the filterbank optimization are summarized
in Algorithm 1, and the details for the population evaluation
are shown in Algorithm 2.
4. Results and Discussion
Many different experiments were carried out in order to find
an optimal filterbank for the task of phoneme recognition.
In this section we discuss the EA runs which produced the
most interesting results and compare the obtained ESCC to
the classic MFCC on the same classification tasks.
4.1. Speech Data. Phonetic data was extrac ted from the
TIMIT speech database [28] and selected randomly from
all dialect regions, including both male and female speakers.
Utterances were phonetically segmented to obtain individual
files with the temporal signal of every phoneme occurrence.
White noise was also added at different SNR levels. The sam-
pling frequency was 16 kHz and the frames were extracted
using a Hamming window of 25 milliseconds (400 samples)
6 EURASIP Journal on Advances in Signal Processing
For each individual in the population do
Obtain 1 spline y[i](3)giveny
1
, y
2
, σ and ρ (genes 1 to 4)
Given y[i], obtain filter frequency positions f
c
i
using (5)
Obtain 2 spline y[i](3)giveny
1
, y
2
, y
3
and y
4
(genes 5 to 8)
Set filter i amplitude to y[i]
Build M filterbank filters H
m
( f )
Given H
m
( f ), compute filter outputs S[m]foreachX( f ) using (1)
Given the sequence S[m], compute ESCC using (2)
Train the HMM based classifier on the selected training subset
Test the HMM based classifier on the selected test subset
Assign classification rate as the current individual’s fitness
end
Algorithm 2: Evaluate population.
and a step-size of 200 samples. All possible frames within
a phoneme occurrence were extracted and padded with
zeros where necessary. The set of English phonemes /b/,
/d/, /eh/, /ih/, and /jh/ was considered. Occlusive consonants
/b/ and /d/ were included because they are very difficult
to distinguish in different contexts. Phoneme /jh/ presents
special features of the fricative sounds. Vowels /eh/ and /ih/
are commonly chosen because they are close in the formant
space. As a consequence, this phoneme set consists of a
group of classes which is difficult for automatic recognition
[29].
4.2. Experimental Setup. Our phoneme classifier is based on
continuous HMM, using Gaussian mixtures with diagonal
covariance matrices for the observation densities [30]. For
the experiments, we used a three-state HMM and mixtures
of four gaussians. This fitness function uses tools from the
HMM Toolkit (HTK) [31] for building and manipulating
hidden Markov models. These tools implement the Baum-
Welch algorithm [32] which is used to train the HMM
parameters, and the Viterbi algorithm [33]whichisusedto
search for the most likely state sequence, given the observed
events, in the recognition process.
In all the EA runs the population size was set to 30
individuals, crossover rate was set to 0.9, and the mutation
rate was set to 0.07. Parameter a, discussed in the previous
section, was set to 0.1. For the optimization, a changing set
of 1000 signals (phoneme examples) was used for training
and a changing set of 400 signals was used for testing. Both
sets were class-balanced and resampled every generation. The
resampling of the training set was made randomly from a
set of 5000 signals, and the resampling of the testing set was
made taking into account previous misclassifications and the
age of e ach of 1500 signals. The age of a signal was defined
as the number of generations since it was included in the
test set. The termination criterion for an EA ru n was to stop
the optimization after 2500 generations. At termination, the
filterbanks with the best fitness values were chosen.
Further cross-validation tests with ten different data
partitions, consisting of 2500 training signals and 500 test
signals each, were conducted with selected filterbanks. Two
different validation tests were employed: match training
(MT), where the SNR was the same in both training and test
sets, and mismatch training (MMT), which means testing
with noisy signals (at different SNR levels) using a classifier
that was trained with clean signals. From these validation
tests we selected the best filterbanks, discarding those that
were overoptimized (i.e., those with higher fitness but with
lower validation result). Averaged validation results for the
best optimized filterbanks were compared with the results
achieved with the standard MFB on the same ten data
partitions and training conditions. Note that, in all these
experiments, the classifier was e valuated in MT conditions
during the evolution.
4.3. Optimization of Central Frequencies. In the first exper-
iment only the frequency positions of the filters were opti-
mized, with chromosomes of length 4 (as explained in the
previous section). The gain of each filter was not optimized;
so, as in the case of the MFCC, every filter amplitude was
scaled according to its bandwidth. Note that the number
of filters in the filterbanks is not related to the size of the
chromosomes. We considered filterbanks composed of 30
filters, while the feature vectors consisted of the first 16
cepstral coefficients. In this case, clean signals were used to
train and test the classifier during the optimization.
Tabl e 1 summarizes the validation results for evolved
filterbanks (EFB) EFB-A1, EFB-A2, EFB-A3, and EFB-
A4, which are the best from the first experiment. Their
performance is compared with that of the classic filterbank
on different noise and training conditions. As can be seen,
in most test cases the optimized filterbanks per form better
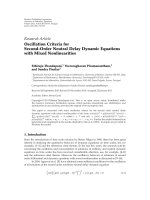
than MFB, sp ecially for match training tests. Figure 5 shows
these four EFBs, which exhibit little difference between them.
Moreover, their frequency distributions are similar to that
of the classical MFB. However, the resolution that these
filterbanks provide below 2 kHz is higher, probably because
this is the place for the two first formant frequencies. In
contrast, when polynomial functions were used to encode
the parameters [13], the obtained filterbanks were not
regular and did not always cover most of the frequency
band of interest. This may be attributed to the complex
relation between filterbank parameters and the optimized
polynomials.
EURASIP Journal on Advances in Signal Processing 7
Table 1: Averaged validation results for phoneme recognition (shown in percent). Filterbanks are obtained from the optimization of filter
center frequency values, while filter gains-scaled according to bandwidths and using clean signals.
FB n
f
n
c
Match training validation Mismatch training validation
0dB 10dB 20dB 30dB clean 0dB 10dB 20dB 30dB
EFB-A1 30 16 73.14 78.06 73.54 70.74 70.94 23.86 44.06 69.66 70.54
EFB-A2 30 16 73.36 77.94 73.52 71.60 71.16 22.98 43.14 70.52 71.40
EFB-A3 30 16 73.60 78.08 73.36 71.14 71.00 23.62 44.14 69.94 71.28
EFB-A4 30 16 72.88 78.04 73.56 71.46 71.92 23.68 43.80 70.06 71.28
MFB 30 16 73.44 77.88 71.22 70.20 69.94 23.72 44.74 66.60 70.38
0 1000 2000 3000 4000 5000 6000 7000 8000
Frequency (Hz)
0
0.2
0.4
0.6
0.8
1
Gain
(a)
0 1000 2000 3000 4000 5000 6000 7000 8000
Frequency (Hz)
0
0.2
0.4
0.6
0.8
1
Gain
(b)
0 1000 2000 3000 4000 5000 6000 7000 8000
Frequency (Hz)
0
0.2
0.4
0.6
0.8
1
Gain
(c)
0 1000 2000 3000 4000 5000 6000 7000 8000
Frequency (Hz)
0
0.2
0.4
0.6
0.8
1
Gain
(d)
Figure 5: Evolved filterbanks obtained in the optimization of filter center positions only (filter gains normalized according to bandwidths)
using clean signals. (a) EFB-A1, (b) EFB-A2, (c) EFB-A3 and (d) EFB-A4.
4.4. Optimization of Filter Gain and Center Frequency. The
second experiment differs only in that the filters’ amplitude
was also optimized, coding the parameters of two splines in
each chromosome of length 8. Validation results for EFB-
B1, EFB-B2, EFB-B3, and EFB-B4 are shown in Table 2,from
which important improvements over the classical filterbank
can be appreciated. Each of the optimized filterbanks
performs better than MFB in most of the test conditions. For
the MT cases of 20 dB, 30 dB, and clean, and for the MMT
case of 10 dB the improvements are most significant. These
four EFBs, which can be observed in Figure 6,differ from
MFB (shown in Figure 2) in the scaling of the filters at higher
frequencies. Moreover, these filterbanks emphasize the high-
frequency components. As in the case of those in Figure 5,
these EFBs show more filter density before 2 kHz, compared
to MFB.
In the third experiment both the frequency positions and
amplitude of the filters were optimized ( as in the previous
case). However, in this case noisy signals at 0 dB SNR were
used to t rain and test the classifier during the evolution.
Validation results from Table 3 reveal that for the case of 0 dB
SNR, in both MT and MMT conditions, these EFBs improve
the ones in Tables 1 and 2. The filterbanks optimized on clean
signals perform better for most of the noise contaminated
conditions.
These EFBs are more regular compared to those obtained
in previous works, where the optimization considered three
parameters for each filter [17]. These parameters were
the frequency positions at the initial, top, and end points
of the triangular filters, while size and overlap were left
unrestricted. Results showed some phoneme classification
improvements, although the shapes of optimized filterbanks
were not easy to explain. Moreover, dissimilar filterbanks
gave comparable results, showing that we were dealing
with an ill-conditioned problem. This was particularly true
when the optimization was made using noisy signals, as
the solution does not continuously depend on data. In
this work, dissimilar ities between EFBs are only noticeable
for those filterbanks that were optimized using noisy sig-
nals.
8 EURASIP Journal on Advances in Signal Processing
Table 2: Averaged validation results for phoneme recognition (shown in percent). Filterbanks are obtained from the optimization of filter
center frequency and filter gain values and using clean signals.
FB n
f
n
c
Match training validation Mismatch training validation
0dB 10dB 20dB 30dB clean 0dB 10dB 20dB 30dB
EFB-B1 30 16 73.06 78.40 78.56 75.52 74.16 22.94 45.70 55.44 71.80
EFB-B2 30 16 73.76 78.38 79.08 76.26 74.84 24.26 50.16 64.84 73.10
EFB-B3 30 16 73.54 77.60 78.04 76.02 74.28 22.56 47.32 63.82 70.60
EFB-B4 30 16 73.74 78.74 79.18 75.66 75.40 23.22 51.46 66.58 72.96
MFB 30 16 73.44 77.88 71.22 70.20 69.94 23.72 44.74 66.60 70.38
Table 3: Averaged validation results for phoneme recognition (shown in percent). Filterbanks obtained from t he optimization of filter center
frequency and filter gain values, and using noisy signals.
FB n
f
n
c
Match training validation Mismatch training validation
0dB 10dB 20dB 30dB clean 0dB 10dB 20dB 30dB
EFB-C1 30 16 73.88 76.50 76.24 70.78 69.14 31.76 44.46 49.16 67.20
EFB-C2 30 16 74.66 78.60 78.96 73.78 70.76 25.74 46.68 49.76 66.88
EFB-C3 30 16 74.90 77.18 76.10 70.56 69.48 29.70 44.50 49.40 68.06
EFB-C4 30 16 74.76 78.16 78.54 75.36 71.04 24.80 46.08 52.12 66.36
MFB 30 16 73.44 77.88 71.22 70.20 69.94 23.72 44.74 66.60 70.38
0 1000 2000 3000 4000 5000 6000 7000 8000
Frequency (Hz)
0
0.2
0.4
0.6
0.8
1
Gain
(a)
0 1000 2000 3000 4000 5000 6000 7000 8000
Frequency (Hz)
0
0.2
0.4
0.6
0.8
1
Gain
(b)
0 1000 2000 3000 4000 5000 6000 7000 8000
Frequency (Hz)
0
0.2
0.4
0.6
0.8
1
Gain
(c)
0 1000 2000 3000 4000 5000 6000 7000 8000
Frequency (Hz)
0
0.2
0.4
0.6
0.8
1
Gain
(d)
Figure 6: Evolved filterbanks obtained in the optimization of filter center positions and amplitudes simultaneously and using clean signals:
(a) EFB-B1, (b) EFB-B2, (c) EFB-B3, and (d) EFB-B4.
EURASIP Journal on Advances in Signal Processing 9
0 1000 2000 3000 4000 5000 6000 7000 8000
Frequency (Hz)
0
0.2
0.4
0.6
0.8
1
Gain
(a)
0 1000 2000 3000 4000 5000 6000 7000 8000
Frequency (Hz)
0
0.2
0.4
0.6
0.8
1
Gain
(b)
0 1000 2000 3000 4000 5000 6000 7000 8000
Frequency (Hz)
0
0.2
0.4
0.6
0.8
1
Gain
(c)
0 1000 2000 3000 4000 5000 6000 7000 8000
Frequency (Hz)
0
0.2
0.4
0.6
0.8
1
Gain
(d)
Figure 7: Evolved filterbanks obtained in the optimization of filter center positions and amplitudes simultaneously and using signals with
noise at 0 dB SNR: (a) EFB-C1, (b) EFB-C2, (c) EFB-C3, and (d) EFB-C4.
Clean 30 20 10 0
SNR (dB)
Classification rate (%)
EFB-A4
EFB-B2
EFB-C4
MFB
64
66
68
70
72
74
76
78
80
(a)
Clean 30 20 10 0
SNR (dB)
Classification rate (%)
EFB-B2
MFB
0
10
20
30
40
50
60
70
80
EFB-A4
EFB-C4
(b)
Figure 8: Averaged validation results for phoneme classification comparing MFB with EFB-A4, EFB-B2, and EFB-C4 at different training
conditions. (a) Validation in match t raining conditions, and (b) validation in mismatch training conditions.
From Figure 7 we can observe that the filterbanks evolved
on noisy signals differ widely from MFB and the ones
evolved on clean signals. For example, the filter density is
greater in different frequency ranges, and these ranges are
centered in higher frequencies. Moreover, this amplitude
scaling, in contrast to the preceding filterbanks, depreciates
the lower-frequency bands. This feature is present in all these
filterbanks, g iving attention to high frequencies, as opposed
to MFB, and taking higher formants into account. However,
the noticeable dissimilarities in these four filterbanks suggest
that the optimization with noisy signals is much more
complex, preventing the EA to converge to similar solutions.
4.5. Analysis and Dis cussion. Figure 8 summarizes some
results shown in Tables 1, 2,and3 for E FB-A4, EFB-B2, and
EFB-C4, a nd compares them with MFB on different noise
and training conditions. From Figure 8(a) we can observe
that, in MT conditions, the EFBs outperform MFB in almost
all the noise conditions considered. Figure 8(b) shows some
improvements of EFB-A4 and EFB-B2, over MFB, in MMT
conditions.
Tabl e 4 shows confusion matrices for phoneme classifica-
tion with MFB and EFB-B2, from validation at various SNR
levels in the MT case. From these matrices, one can notice
that phonemes /b/, /eh/, and /ih/ are frequently misclassified
10 EURASIP Journal on Advances in Signal Processing
Table 4: Confusion matrices showing percents of average classification rates from ten data partitions in MT conditions, for both MFB and
EFB-B2.
MFB (30/16) EFB-B2
/b/ /d/ /eh/ /ih/ /jh/ /b/ /d/ /eh/ /ih/ /jh/
10 dB
/b/ 80.0 15.1 01.1 02.9 00.9 81.3 15.2 00.5 02.2 00.8
/d/ 20.1 72.2 00.2 02.0 05.5 20.4 71.0 00.6 01.9 06.1
/eh/ 03.0 01.0 78.4 17.6 00.0 02.2 01.2 81.6 15.0 00.0
/ih/ 02.0 03.2 21.3 73.2 00.3 01.5 01.1 23.9 73.1 00.4
/jh/ 00.0 14.3 00.0 00.1 85.6 00.5 14.5 00.0 00.1 84.9
Avg: 77.88 Avg: 78.38
20 dB
/b/ 74.1 21.5 02.2 10.7 00.5 79.8 16.7 00.7 02.1 00.7
/d/ 15.0 78.8 00.9 10.4 03.9 17.9 74.8 00.6 02.8 03.9
/eh/ 12.7 04.9 55.6 26.5 00.3 00.7 01.0 76.6 21.7 00.0
/ih/ 06.3 03.9 27.1 62.4 00.3 00.4 00.5 24.0 75.1 00.0
/jh/ 00.7 13.6 00.0 00.5 85.2 00.5 09.9 00.1 00.4 89.1
Avg: 71.22 Avg: 79.08
30 dB
/b/ 53.2 32.2 06.9 07.0 00.7 78.9 18.6 01.0 01.0 00.5
/d/ 11.0 77.0 02.7 04.4 04.9 17.1 76.5 00.8 01.3 04.3
/eh/ 01.3 02.3 68.9 27.4 00.1 02.3 01.0 72.1 24.6 00.0
/ih/ 00.9 01.9 30.2 66.9 00.1 01.8 01.3 26.3 70.6 00.0
/jh/ 01.5 12.1 00.5 00.9 85.0 00.7 14.8 00.2 01.1 83.2
Avg: 70.2 Avg: 76.26
clean
/b/ 54.4 28.9 07.9 07.8 01.0 74.9 18.9 02.4 03.3 00.5
/d/ 12.2 76.3 01.9 04.8 04.8 15.5 78.1 00.9 01.0 04.5
/eh/ 02.2 02.1 69.4 26.0 00.3 01.4 01.3 67.9 29.3 00.1
/ih/ 02.4 01.5 31.8 64.2 00.1 03.1 01.3 26.7 68.9 00.0
/jh/ 02.1 11.7 00.2 00.6 85.4 01.1 13.2 00.9 00.4 84.4
Avg: 69.94 Avg: 74.84
0 0.1 0.2 0.3 0.4 0.5 0.6 0.7 0.8 0.9 1
0
2
4
6
8
Time (s)
×10
3
Frequency (Hz)
(a)
0 0.1 0.2 0.3 0.4 0.5 0.6 0.7 0.8 0.9 1
0
2
4
6
8
Time (s)
×10
3
Frequency (Hz)
(b)
0 0.1 0.2 0.3 0.4 0.5 0.6 0.7 0.8 0.9 1
0
2
4
6
8
Time (s)
×10
3
Frequency (Hz)
(c)
Figure 9: Spectrograms for a fragment of sentence SI648 from
TIMIT corpus with additive white noise at 20 dB SNR. Computed
from the original signal (a), reconstructed from MFCC (b) and
reconstructed from EFB-B4 (c).
using MFB and they are significantly better classified with
EFB-B2. Moreover, with EFB-B2 the variance between the
classification rates of individual phonemes is smaller. It can
also be noticed that phoneme /b/ is mostly confused with
phoneme /d/ and vice versa, and the same happens with
vowels /eh/ and /ih/. This occurs with both filterbanks MFB
and EFB-B4, though the optimized filterbank reduces these
confusions considerably.
As these filterbanks were optimized for a reduced set of
phonemes, one cannot aprioriexpect continuous sp eech
recognition results to be improved. Thus, some preliminary
tests were made and promising results were obtained. A
recognition system was built using tools from HTK and
the performance of the ESCC was compared to that of
the classical MFCC representation, using sentences from
dialect region one in TIMIT database with additive white
noise at different SNRs (in MMT conditions). Preemphasis
was applied to signal frames and the feature vectors were
composed of the MFCC, or ESCC, plus delta and acceleration
coefficients. The sentence and word recognition rates were
close for MFCC and ESCC in almost all cases. At 15 dB
the word recognition rates were 15.83% and 31.98% for
MFB and EFB-B4, respectively. This suggests that even if
the optimization is made over a small set of phonemes, the
resulting feature set still allows us to better discriminate
between other phoneme classes. Moreover, it is important
EURASIP Journal on Advances in Signal Processing 11
MFB
5
10
15
51015
EFB-B1
(a)
MFB
5
10
15
51015
EFB-B2
0.2
0.4
0.6
0.8
(b)
MFB
5
10
15
51015
EFB-B3
(c)
B3
EFB
B2B1
0.0
0
2
0.04
0.06
(d)
Figure 10: Squared Pearson’s correlation between MFCC and ESCC obtained with EFB-B1, EFB-B2, and EFB-B3 ((a), (b) and (c), resp.).
Normalized sum of the correlation coefficients outside the diagonal (d).
to note that the five phonemes selected for the filterbank
optimization represent only 9.38% (b: 1.49%, d: 2.28%,
eh: 2.35%, ih: 2.76%, jh: 0.51%) of the total number of
phonemes in the test utterances. That is, from a total of 3956
phonemes in the test utterances, only 371 correspond to the
phoneme set considered in the optimization.
In order to understand the information that these
filterbanks retain, an estimate of the short-time magnitude
spectrum was recovered using the method proposed in [34].
This method scales the spectrogram of a white noise signal
by the short-time magnitude spectrum recovered from the
cepstral coefficients. The spectrograms for a fragment of
sentence SI648 from TIMIT corpus with additive white
noise at 20 dB SNR are shown in Figure 9. The spec trogram
on top is the one corresponding to the original signal,
in the middle the reconstructed spectrogram from MFCC
is shown, and the one at the bottom was reconstructed
from the ESCC obtained by means of EFB-B4. It can be
observed that the spectrogram reconstructed from ESCC
is less affected by noise than the other two. Moreover,
the information from formant frequencies is enhanced and
made easier to detect in the spectrogram corresponding
to ESCC, which makes phoneme classification easier. This
means that, in comparison to the MFB, the filter distribution
and bandwidths of EFB-B4 allow more relevant information
to be preserved.
In order to evaluate the relation of the MFCC and
the ESCC we compared them using Pearson’s correlation
coefficient r. Figure 10 shows squared correlation matrices
comparing the MFCC with the ESCC (obtained using EFB-
B1, EFB-B1, and EFB-B3) over 17846 phoneme frames with
additive noise at 0 dB SNR. We observe that approximately
the first half of the coefficients are quite highly correlated
between the filterbanks under comparison. Moreover, in the
case of EFB-B2 there are more correlation coefficients outside
the diagonal which are different from zero. This means that
the ESCC are obtained with EFB-B2 are the least related to
the MFCC, in the sense that the information is distributed
differently between all the cepstral coefficients. This can be
better appreciated in the bar plot, giving the normalized
sum of all the correlation coefficients outside the diagonal.
Note that EFB-B2 is the one which gives the best validation
results.
A similar comparison was made between the cepstral
coefficients from a single filterbank, in order to evaluate
how they are correlated. In Figure 11 the squared correlation
matrices of the MFCC and the ESCC from EFB-B1, EFB-B2,
and EFB-B3 are shown. It can be noticed that the matrix
for EFB-B2 is the one with the least number of coefficients
different from zero outside the diagonal. Moreover, the
normalized sum of the correlation coefficients outside the
diagonal is smaller for EFB-B2, meaning that the ESCCs
12 EURASIP Journal on Advances in Signal Processing
5
10
15
51015
MFB
MFB
(a)
5
10
15
51015
EFB-B1
EFB-B1
(b)
5
10
15
51
1
015
EFB-B2
EFB-B2
0.5
(c)
5
10
15
51015
EFB-B3
EFB-B3
(d)
EFB-B2 EFB-B3
EFB-B1
0.0
0
2
0.04
MFB
(e)
Figure 11: Squared Pearson’s correlation of MFCC and ESCC obtained with EFB-B1, EFB-B2, and EFB-B3 ((a), (b), (c) and (d), resp.).
Normalized sum of the correlation coefficients outside the diagonal (e).
from EFB-B2 are less correlated than MFCC. For this reason
the ESCCs from EFB-B2 better satisfy the assumptions
for HMM-based speech recognizers using GM observation
densities with diagonal covariance matrices (a common
practice in speech recognition) [30].
Another subject to consider is the computational load of
the optimizations detailed in the previous sect ion. An EA
run of 2500 generations (which is the number of generations
used in this work for the experiments) takes approximately
84 hours (about 2 minutes for each generation) on a
computer cluster consisting of eleven processors of 3 GHz
clock speed. It is interesting to note that the most expensive
computation in the optimization is the fitness evaluation,
that is, the training and test of the HMM-based classifier. In
comparison to the approach [17] (in which the filterbank
parameters were directly coded in the chromosomes), the
reduced chromosome size allowed the EA to converge to
better solutions taking almost the same processing time. It is
important to note that this approach does not imply addi-
tional load to the standard speech recognition procedure.
The optimization step is previous to the recognition, and the
filterbank is fixed during the entire recognition. Moreover,
the MFCC and the ESCC feature extract ion techniques are
similar, and the optimization can b e considered as part of
the training.
5. Conclusions
In this work a n evolutionary method has been proposed
for the optimization of a filterbank, in order to obtain a
new cepstral representation for phoneme classification. We
introduced the use of a spline interpolation which reduces
the number of parameters in the optimization, providing
an adequate search space. The advantages of evolutionary
computation are successfully exploited in the search for an
optimal filterbank. The encoding of parameters by means
of spline functions significantly reduced the chromosome
size and search space, while preserving a broad variety
of candidate solutions. Moreover, the suitable variation
operators allowed the algorithm to explore a large pool of
potential filterbanks.
Experimental results show that the proposed method is
able to find a robust signal representation, which allows us
to improve the classification rate for a given set of phonemes
at different noise conditions. Furthermore, this strategy can
provide alternative speech representations that improve the
results of the classical approaches for specific conditions.
These results also suggest that there is further room for
improvement over the classical filterbank. On the other hand,
with the use of these optimized filterbanks the robustness
of an ASR system c an be improved with no additional
EURASIP Journal on Advances in Signal Processing 13
computational cost, and without modifications in the HMM
structure or training algorithm.
Further work will include the utilization of other search
methods, such as particle swarm optimization and scatter
search [35]. In addition, different variation operators can
be evaluated and other filter parameters such as bandwidth
could also be optimized. The possibility of replacing the
HMM-based classifier by another objective function of lower
computational cost, such as a measure of class separability,
will also be studied. Finally, future experiments will include
the optimization using a bigger set of phonemes and
further comparisons of the ESCC to classical features in the
continuous speech recognition task.
Acknowledgments
The authors wish to thank their lab colleagues Mar
´
ıa Eugenia
Torres and Leandro Di Persia for sharing their experience
through their technical support and excellent advice, from
which this work has benefited.
References
[1] S. B. Davis and P. Mermelstein, “Comparison of parametric
representations for monosyllabic word recognition in con-
tinuously spoken sentences,” IEEE Transactions on Acoustics,
Speech, and Sig nal Processing, vol. 28, no. 4, pp. 357–366, 1980.
[2] F. Zheng, G. Zhang, and Z. Song, “Comparison of different
implementations of MFCC,” JournalofComputerScienceand
Technology, vol. 16, no. 6, pp. 582–589, 2001.
[3] M. D. Skowronski and J. G. Harris, “Exploiting independent
filter bandwidth of human factor cepstral coefficients in
automatic speech recognition,” Journal of the Acoustical Society
of America, vol. 116, no. 3, pp. 1774–1780, 2004.
[4] M. D. Skowronski and J. G. Harris, “Improving the filter bank
of a classic speech feature extraction algorithm,” in Proceedings
of the IEEE International Symposium on Circuits and Systems
(ISCAS ’03), vol. 4, pp. 281–284, May 2003.
[5] H. Yeganeh, S. M. Ahadi, S. M. Mirrezaie, and A. Ziaei,
“Weighting of mel sub-bands based on SNR/entropy for
robust ASR,” in Proceedings of the 8th IEEE International
Symposium on Signal Processing and Information Technology
(ISSPIT ’08), pp. 292–296, December 2008.
[6] B. Nasersharif and A. Akbari, “SNR-dependent compression
of enhanced Mel sub-band energies for compensation of noise
effects on MFCC features,” Pattern Recognition Letters, vol. 28,
no. 11, pp. 1320–1326, 2007.
[7] XI. Zhou, Y. Fu, M. Liu, M. Hasegawa-Johnson, and T. S.
Huang, “Robust analysis and weighting on MFCC compo-
nents for speech recognition and speaker identification,” in
Proceedings of the IEEE International Conference onMultimedia
and Expo (ICME ’07), pp. 188–191, July 2007.
[8] H. Bo
ˇ
ril, P. Fousek, and P. Poll
´
ak, “Data-driven design of
front-end filter bank for Lombard speech recognition,” in
Proceedings of the 9th International Conference on Spoken
Language Processing (ICSLP ’06), pp. 381–384, Pittsburgh, Pa,
USA, September 2006.
[9] Z. Wu and Z. Cao, “Improved MFCC-based feature for robust
speaker identification,” Tsinghua Science & Technology, vol. 10,
no. 2, pp. 158–161, 2005.
[10] L. Burget and H. He
ˇ
rmansk
´
y, “Data driven design of fi lter
bank for speech recognition,” in Text,SpeechandDialogue,
vol. 2166 of Lecture Notes in Computer Science, pp. 299–304,
Springer, Berlin, Germany, 2001.
[11] C. Charbuillet, B. Gas, M. Chetouani, and J. L. Zarader,
“Optimizing feature complementarity by evolution strategy:
application to automatic speaker verification,” Speech Commu-
nication, vol. 51, no. 9, pp. 724–731, 2009.
[12] L. Vignolo, D. Milone, H. Rufiner, and E. Albornoz, “Parallel
implementation for wavelet dictionary optimization applied
to pattern recognition,” in Proceedings of the 7th Argentine
Symposium on Computing Technology, Mendoza, Argentina,
2006.
[13] C. Charbuillet, B. Gas, M. Chetouani, and J. L. Zarader, “Multi
filter bank approach for speaker verification based on genetic
algorithm,” in Advances in Nonlinear Speech Processing, vol.
4885 of Lecture Notes in Computer Science, pp. 105–113, 2007.
[14] D. B. Fogel, Evolutionary Computation,JohnWiley&Sons,
New York, NY, USA, 3rd edition, 2006.
[15] M. S. Lewicki, “Efficient coding of natural sounds,” Nature
Neuroscience, vol. 5, no. 4, pp. 356–363, 2002.
[16] L. D. Stein, “End of the beginning,” Nature
, vol. 431, no. 7011,
pp. 915–916, 2004.
[17] L. D. Vig nolo, H. L. Rufiner, D. H. Milone, and J. C.
Goddard, “Genetic optimization of cepstrum filterbank for
phoneme classification,” in Proceedings of the 2nd International
Conference on Bio-Inspired Systems and Signal Processing
(BIOSIGNALS ’09), pp. 179–185, Porto, Portugal, January
2009.
[18] T. B
¨
ack, Evolutionary Algorithms in Theory and Practice: Evolu-
tion Strategies, Evolutionary Programming, Genetic Algorithms,
Oxford University Press, Oxford, UK, 1996.
[19] T. B
¨
ack, U. Hammel, and H. P. Schwefel, “Evolutionary
computation: comments on the history and current state,”
IEEE Transactions on Evolutionary Computation, vol. 1, no. 1,
pp. 3–17, 1997.
[20] Z. Michalewicz, Genetic Algorithms + D ata Structures = Evolu-
tion Programs, Springer, Berlin, Germany, 1992.
[21]C.R.JankowskiJr.,H.D.H.Vo,andR.P.Lippmann,“A
comparison of signal processing front ends for automatic
word recognition,” IEEE Transactions on Speech and Audio
Processing, vol. 3, no. 4, pp. 286–293, 1995.
[22] L. Rabiner and B H. Juang, Fundamentals of Speech Recogni-
tion, Prentice Hall PTR, Englewood Cliffs, NJ, USA, 1993.
[23] J. R. Deller, J. G. Proakis, and J. H. Hansen, Discrete-Time
Processing of Speech Signals ,Macmillan,NewYork,NY,USA,
1993.
[24] M. Slaney, “Auditor y Toolbox, version 2,” Tech. Rep. 1998-010,
Interval Research Corporation, Apple Computer Inc., 1998.
[25] W. H. Press, B. P. Flannery, S. A. Teukolsky, and W. T.
Vetterling, Numerical Recipes in C: The Art of Scient ific
Computing, Cambridge University Press, Cambridge, UK, 2nd
edition, 1992.
[26] C. Gathercole and P. Ross, “Dynamic training subset selection
for supervised learning in genetic programming,” in Parallel
Problem Solving from Nature—PPSN III, vol. 866 of Lecture
Notes in Computer Science, pp. 312–321, Springer, Berlin,
Germany, 1994.
[27] A. E. Eiben and J. E. Smith, Introduction to Evolutionary
Computing, Springer, Berlin, Germany, 2003.
[28] J. S. Garofalo, L. F. Lamel, W. M. Fisher, J. G. Fiscus, D. S.
Pallett, and N. L. Dahlgren, “DARPA TIMIT acoustic phonetic
continuous speech corpus CD-ROM,” Tech. Rep., U.S. Dept.
of Commerce, NIST, Gaithersburg, Md, USA, 1993.
14 EURASIP Journal on Advances in Signal Processing
[29] K. N. Stevens, Acoustic Phonetics, Mit Press, Cambrige, Mass,
USA, 2000.
[30] K. Demuynck, J. Duchateau, D. van Compernolle, and P.
Wambacq, “Improved feature decorrelation for HMM-based
speech recognition,” in Proceedings of the 5th International
Conference on Spoken Language Processing (ICSLP ’98), Sydney,
Australia, 1998.
[31] S.Young,D.Kershaw,J.Odell,D.Ollason,V.Valtchev,andP.
Woodland, HMM Toolkit, Cambridge University, 2000, http://
htk.eng.cam.ac.uk/.
[32] F. Jelinek, Statistical Methods for Speech Recognition,MIT
Press, Cambrige, Mass, USA, 1999.
[33] X. D. Huang, Y. Ariki, and M. A. Jack, Hidden Markov Models
for Speech Recognition, Edinburgh University Press, 1990.
[34] D. P. W. Ellis, “PLP and RASTA (and MFCC, and inversion) in
Matlab,” />∼dpwe/resources/mat-
lab/rastamat/.
[35] S. G. de los Cobos Silva, J. Goddard Close, M. A. Guti
´
errez
Andrade, and A. E. Martinez Licona, B
´
usqueda y Exploraci
´
on
Estoc
´
astica, Universidad Aut
´
onoma Metropolitana, Iztapalapa,
Mexico, 1st edition, 2010.