ERPMaking It Happen The Implementers Guide to Success with Enterprise Resource Planning_6 pptx
Bạn đang xem bản rút gọn của tài liệu. Xem và tải ngay bản đầy đủ của tài liệu tại đây (314.71 KB, 26 trang )
INITIAL EDUCATION AND TRAINING
SALES & OPERATIONS PLANNING
DEMAND MANAGEMENT, PLANNING, AND SCHEDULING PR
OCESSES
PROCESS DEFINITION
FINANCE & ACCOUNTING PROCESSES
PROCESS DEFINITION AND IMPLEMENTATION
SOFTWARE CONFIGURATION & INSTALLATION
PILOT AND CUTOVER
SOFTWARE SELECTION
PERFORM-
ANCE
GOALS
PROJECT
ORGANIZ-
ATION
AUDIT/
ASSESSMENT III
ONGOING EDUCATION
AND TRAINING
ADDITIONAL
INITIATIVES
BASED ON
CORPORATE
STRATEGY
ONGOING
SOFTWARE
SUPPORT
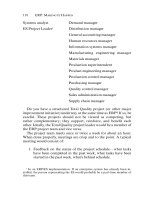
ERP PROVEN PATH
PHASE I
BASIC ERP
PHASE II
SUPPLY CHAIN
INTEGRATION
PHASE III
CORPORATE
INTEGRATION
0 1 2 3 4 5 6 7 8 9 10 11 12 13 14 15 16 17 18 19
+
MONTH:
GO/NO-GO
DECISION
COST/
BENEFIT
VISION
STATE-
MENT
FIRST-CUT
EDUCATION
AUDIT/
ASSESSMENT I
DATA INTEGRITY
AUDIT/
ASSESSMENT II
Figure 10-1
but kept in its proper perspective. It needs to be reasonable. The un-
forgiving data needs to be precise.
U
NFORGIVING
D
ATA
Inventory Balances
First, a disclaimer: The best way to have highly accurate inventory
records is not to have any inventory. Short of that, have as little as
you absolutely need. However, the role of the warehouse manager is
not to specify the level of inventory; rather, he or she receives what
arrives and issues what’s requested. Therefore, given some amount
of inventory, it’s the responsibility of the people in the warehouses
and stockrooms to get and keep the records at a high level of accu-
racy.
The on-hand inventory balances in the computer must be 95 per-
cent accurate, at a minimum. Do not attempt to implement the plan-
ning and scheduling tools of ERP (master scheduling, Material
Requirements Planning, Distribution Requirements Planning, plant
scheduling, supplier scheduling) without this minimum level of ac-
curacy.
The inventory balance numbers are vitally important because they
represent the starting number for these planning processes. If the
balance for an item is not accurate, the planning for it will probably
be incorrect. If the planning is incorrect for a given item, such as a
finished product or a subassembly, then the erroneous planned or-
ders will be exploded into incorrect gross requirements for all of that
item’s components. Hence, the planning will probably be incorrect
for those components also. The result: large amounts of incorrect
recommendations coming out of the formal system, a loss of confi-
dence by the users, a return to using the hot list, and an unsuccessful
implementation of ERP.
What specifically does 95 percent accuracy mean? Of all the on-
hand balance numbers inside the computer, 95 percent should
match—on item number, quantity, and location—what is physically
in the stockroom or the warehouse.
“But that’s impossible!” people say. “What about all the nuts and
bolts and shims and washers and screws and so forth? These are tiny
little parts, they’re inexpensive, and we usually have thousands of
Data Integrity 197
any given item in stock. There’s no way to get the computer records
to match what’s actually out there.”
Here enters the concept of counting tolerance. Items such as fas-
teners are normally not hand counted but scale counted. (The stock
is weighed, and then translated into pieces by a conversion factor.) If,
for example, the scale is accurate to plus or minus 2 percent, and/or
the parts vary a bit in weight, then it obviously isn’t practical to insist
on an exact match of the count to the book record. In cases where
items are weigh counted (or volume counted, such as liquids in a
tank), companies assign a counting tolerance to the item. In the ex-
ample above, the counting tolerance might be plus or minus 3 per-
cent. Any physical count within plus or minus 3 percent of the
computer record would be considered a hit, and the computer record
would be accepted as correct.
Given this consideration, let’s expand the earlier statement about
accuracy: 95 percent of all the on-hand balance numbers inside the
computer should match what is physically on the shelf inside the
stockroom, within the counting tolerance. Don’t go to the pilot and
cutover steps without it.
There are a few more things to consider about counting toler-
ances. The method of handling and counting an item is only one cri-
terion for using counting tolerances. Others include:
1. The value of an item. Inexpensive items will tend to have
higher tolerances than the expensive ones.
2. The frequency and volume of usage. Items used more fre-
quently will be more subject to error.
3. The lead-time. Shorter lead times can mean higher tolerances.
4. The criticality of an item. More critical items require lower
tolerances or possibly zero tolerance. For example, items at
higher levels in the bill are more likely to be shipment stop-
pers; therefore, they may have lower tolerances.
The cost of control obviously should not exceed the cost of inac-
curacies. The bottom line is the validity of the material plan. The
range of tolerances employed should reflect their impact on the com-
pany’s ability to produce and ship on time. Our experience shows
198 ERP: M I H
TEAMFLY
Team-Fly
®
Class A users employ tolerances ranging from 0 percent to 5 percent,
with none greater than 5 percent.
The question that remains is how a company achieves the neces-
sary degree of inventory accuracy. The answer involves some basic
management principles. Provide people with the right tools to do the
job, teach people how to use the tools (called education and training,
right?), and then hold them accountable for results. Let’s take a look
at the specific elements in getting this job done.
1. A zero-defects attitude.
This is the people part of getting and maintaining inventory accu-
racy. The folks in the stockroom need to understand that inventory
record accuracy is important, and, therefore, they are important.
The points the company must make go something like this:
a. ERP is very important for our future. It will make the com-
pany more prosperous and our jobs more secure.
b. Having the planning and scheduling tools within ERP work-
ing well is critical for successful ERP.
c. Inventory record accuracy is an essential part of making those
tools work.
d. Thus the people who are responsible for inventory accuracy are
important. How well they do their jobs makes a big difference.
2. Limited access.
This is the hardware part of getting accuracy. In many companies,
limited access means having the area physically secured—fenced
and locked. Psychological restrictions (lines on the floor, signs,
roped-off areas) have also been proven to be effective.
This need for limited access is not primarily to keep people out, al-
though that’s the effect. The primary reason is to keep accountability
in. In order to hold the warehouse and stockroom people account-
able for inventory accuracy, the company must give them the neces-
sary tools. One of these is the ability to control who goes in and out.
That means limiting access exclusively to those who need to be there.
Data Integrity 199
Only then can the warehouse and stockroom people be in control
and legitimately be held accountable for results.
Let us add a word of caution about implementing limited access.
It can be an emotional issue. In the world of the informal system,
many people (group leaders, schedulers, buyers, etc.) spend a lot of
time in the stockroom. This isn’t because they think the stockroom’s
a great place to be. They’re in the stockroom trying to get compo-
nents, to make the product, so they can ship it. It’s called expediting,
and they do it in self-defense.
If, one fine morning, these people come to work to find the ware-
houses and stockrooms fenced and locked, the results can be devas-
tating. They’ve lost the only means by which they’ve been able to do
the most important part of their jobs—get product shipped.
Before installing limited access, do three things:
1. Tell ’em. Tell people in advance that the stockrooms and ware-
houses are going to be secured. Don’t let it come as a surprise.
2. Tell ’em why. The problem is not theft. It’s accountability. It’s
necessary to get the records accurate, so that ERP can work.
3. Tell ’em Job 1 is service—service to the production floor, ser-
vice to the shipping department, and ultimately service to the
customers.
In a company implementing ERP, priority number one is to run
the business; priority number two is implementation. Therefore, in
the stockrooms and warehouses, priority one is service and priority
two is getting the inventory records accurate. (Priority number two
is necessary, of course, to do a really good job on priority number
one.) Make certain that everyone, both in and out of the warehouses
and stockrooms, knows these things in advance.
Talking about priorities gives us the opportunity to make an im-
portant point about inventories in general: Have as little as possible
to get the job done. With inventories, less is truly more. However, you
simply can’t wave a magic wand, lower the inventories, and expect
everything to be okay. What’s needed is to change processes, so that
inventory is no longer needed to the extent it was. Now, the folks in
the warehouse are not the prime drivers of these kinds of process
changes; it’s the people on the plant floor and in purchasing and else-
where throughout the company who should have as a very high pri-
200 ERP: M I H
ority this important issue of changing processes to lessen the need for
inventories. More on this in Chapter 16.
3. A good transaction system.
This is the software part of the process. The system for recording in-
ventory transactions and updating stock balances should be simple
and should, to the extent possible, mirror the reality of how material
actually flows.
Simple implies easy to understand and easy to use. It means a
relatively few transaction types. Many software packages contain
lots of unnecessary transaction codes. After all, what can happen to
inventory? It goes into stock and out of it. That’s two transaction
types. It can go in or out on a planned or unplanned basis. That’s
four. Add one for a stock-to-stock transfer and perhaps several
others for inventory adjustments, backflushing,
1
and miscellaneous
activities. There are still probably less than a dozen different trans-
action types that are really needed. Just because the software pack-
age has 32 different types of inventory transactions doesn’t mean the
company needs to use them all to get its money’s worth. Using too
many unnecessary transaction types makes the system unduly com-
plicated, which makes it harder to operate, which makes it that much
more difficult to get and keep the records accurate. Who needs this?
Remember, warehouse and stockroom people will be using these
tools, not Ph.D.s in computer science. Keep it simple. Less is more.
The transaction system should also be a valid representation of re-
ality—how things happen in the real world. For example: inventory
by location. Many companies stock items in more than one bin in a
given stockroom and/or in more than one stockroom. Their trans-
action systems should have the capability to reflect this. Another
example: quick updates of the records. Inventory transaction pro-
cessing does not have to be done in real time. However, it should be
done fairly frequently and soon after the actual events have taken
place. No transaction should have to wait more than 24 hours to be
processed. Backflushing won’t work well at all with these kinds of de-
lays. Nor will our next topic: cycle counting.
Data Integrity 201
1
This is a technique to reduce component inventory balances by calculating com-
ponent usage from completed production counts exploded through the bill of mate-
rial. Also called post-deduct.
4. Cycle counting.
This is the mechanism through which a company gains and main-
tains inventory record accuracy. Cycle counting is fundamentally the
ongoing quality check on a process. The process being checked is:
Does the black box match the real world? Do the numbers inside the
computer match what’s physically in the warehouse?
Cycle counting has four specific objectives:
a. To discover the causes of errors, so that the causes can be elimi-
nated. The saying about the rotten apple in the barrel applies here. Get
it out of the barrel before it spoils more apples. Put more emphasis on
prevention than cure. When an inventory error is discovered, not only
fix the record but—what’s far more important—eliminate the cause
of the error. Was the cause of the error an inadequate procedure, in-
sufficient security, a software bug, or perhaps incomplete training of
a warehouse person? Whenever practical, find the cause of the error
and correct it so that it doesn’t happen again.
b. To measure results. Cycle counting needs to answer the ques-
tion: “How are we doing?” It should routinely generate accuracy
percentages, so the people know whether the records are sufficiently
accurate. In addition, some companies routinely verify the cycle
counting accuracy numbers via independent audits by people from
the Accounting department, often on a monthly basis. In this way,
they verify that the stockroom’s inventory records are as good as the
stockroom people say they are.
c. To correct inaccurate records. When a cycle count does not match
the computer record, the item should be recounted. If the results are the
same, the on-hand balance in the computer must be adjusted.
d. To eliminate the annual physical inventory. This becomes prac-
tical after the 95 percent accuracy level has been reached on an item-
to-item basis. Although doing away with it is important, it’s not
primarily because of the expense involved. The problem is that most
annual physical inventories make the records less accurate, not more
so. Over the years, their main purpose has been to verify the balance
sheet, not to make the individual records more accurate.
Consider the following scenario in a company implementing ERP.
202 ERP: M I H
The stockroom is fenced and locked; the computer hardware and
software is operating properly; and the people in the stockroom are
educated, trained, motivated, and enthusiastic. Inventory record ac-
curacy is 97.3 percent. (Remember, this is units, not dollars. When the
units are 95 percent to 99 percent accurate, the dollars are almost al-
ways in the 99 percent plus accuracy range. This is because plus and
minus dollar errors cancel each other out; unit errors stand alone.)
It seems counterproductive to open the gates to the stockroom one
weekend, bring in a bunch of outsiders, and have them running up
and down the aisles, climbing up and down the bins, writing down
numbers, and putting them into the computer. What happens to in-
ventory accuracy? It drops. What happens to accountability? There’s
not much left. What happens to the morale of the people in the stock-
room? It’s gone—it just flew out the open gates.
Avoid taking annual physical inventories once the records are at least
95 percent accurate. Most major accounting firms won’t insist on them.
They will want to do a spot audit of inventory accuracy, based on a sta-
tistically valid sample. They’ll probably also want to review the cycle
counting procedures, to audit the cycle count results, and to verify the
procedures for booking adjustments. That’s fine. But there should be
no need to take any more complete physical inventories, not even one
last one to confirm the records. Having accounting people doing a
monthly audit of inventory accuracy (as per paragraph b above) can fa-
cilitate the entire process of eliminating the annual physical inventory.
This comes about because the accounting folks are involved routinely,
and can begin to feel confidence and ownership of the process.
An effective cycle counting system contains certain key character-
istics. First of all, it’s done daily. Counting some parts once per
month or once per quarter won’t get the job done.
A critically important part of cycle counting is the control group.
This is a group of about 100 items—less in companies with relatively
few item numbers—that are counted every week. The purpose of the
control group gets us back to the first objective of cycle counting: dis-
covering the causes of errors. This is far easier to determine with
parts counted last week than with those checked last month, last
quarter, or last year.
Ease of operation is another requirement of an effective system.
It’s got to be easy to compare the cycle count to the book record, easy
to reconcile discrepancies, and easy to make the adjustment after the
error has been confirmed.
Data Integrity 203
Most good cycle counting systems require a confirming recount.
If the first count is outside the tolerance, that merely indicates the
probability of an error. A recount is necessary to confirm the error.
With highly accurate records, often it’s the cycle count that’s wrong,
not the record.
Last, a good cycle counting system should generate and report
measures of accuracy. A percentage figure seems to work best—to-
tal hits (good counts) divided by total counts. (Excluded from these
figures are counts for the control group; within a few weeks, the con-
trol group should be at or near 100 percent.) Report these measures
of accuracy frequently, perhaps once per week, to the key individu-
als—stockroom people, project team, steering committee. Post them
on bulletin boards or signs where other people can see them.
Get count coverage on all items, and 95 percent minimum accu-
racy, before going live with the planning and scheduling tools. In
many companies, cycle counting must be accelerated prior to going
on the air in order to get that coverage. The company may need to al-
locate additional resources to make this possible.
Once the stockroom has reached 95 percent inventory record ac-
curacy, don’t stop there. That’s merely the minimum number for run-
ning ERP successfully. Don’t be satisfied with less than 98 percent
accuracy. Our experience has been that companies that spend all the
money and do all the things necessary to get to 95 percent need only
dedication, hard work, and good leadership to get in the 98 percent
to 99 percent range. Make sure everyone knows that going from 95
percent to 98 percent is not merely an accuracy increase of 3 percent.
It really is a 60 percent reduction in exposure to error, from 5 percent
to 2 percent. ERP will operate a good deal better with only 1 or 2 per-
cent of the records wrong than with 4 percent or 5 percent.
There are two other elements involved in inventory status that
need to be mentioned: scheduled receipts and allocations. Both ele-
ments must be at least 95 percent accurate prior to going live.
Scheduled Receipts
Scheduled receipts come in two flavors: open production orders and
open purchase orders. They need to be accurate on quantity and or-
der due date. Note the emphasis on the word order. Material Re-
quirements Planning doesn’t need to know the operational due dates
and job location of production orders in a job shop. It does need to
204 ERP: M I H
know when the order is due to be completed, and how many pieces
remain on the order. Don’t make the mistake of thinking that plant
floor control must be implemented first in order to get the numbers
necessary for Material Requirements Planning.
Typically, the company must review all scheduled receipts, both
production orders and purchase orders, to verify quantity and tim-
ing. Then, establish good order close-out procedures to keep resid-
ual garbage from building up in the scheduled receipt files.
In some companies, however, the production orders can represent
a real challenge. Typically, these are companies with higher speeds
and volumes. In this kind of environment, it’s not unusual for one or-
der to catch up with an earlier order for the same item. Scrap report-
ing can also be a problem. Reported production may be applied
against the wrong production order.
Here’s what we call A Tale of Two Companies (with apologies to
Charles Dickens). In a certain midwestern city, on the same street, two
companies operated ERP quite successfully. That’s where the similar-
ity ends. One, company M, made machine tools. Company M’s prod-
ucts were very complex, and the manufacturing processes were low
volume and low speed. The people in this company had to work very
hard to get their on-hand balances accurate because of the enormous
number of parts in their stockrooms. They had far less of a challenge
to get shop order accuracy because of the low volumes and low speeds.
Their neighbor, company E, made electrical connectors. The prod-
uct contained far fewer parts than a machine tool. Fewer parts in
stock means an easier job in getting accurate on-hand balances. These
connectors, however, were made in high volume at high speeds.
Company E’s people had to work far harder at getting accurate pro-
duction order data. They had to apply proportionately more of their
resources to the shop order accuracy, unlike company M.
The moral of the story: Scratch where it itches. Put the resources
where the problems are.
Allocations
Allocation records detail which components have been reserved for
which scheduled receipts (production orders). Typically, they’re not
a major problem. If the company has them already, take a snapshot
of the allocation file, then verify and correct the numbers. In the
worst case, cancel all the unreleased scheduled receipts and alloca-
Data Integrity 205
tions and start over. Also, be sure to fix what’s caused the errors: bad
bills of material, poor stockroom practices, inadequate procedures,
and the like. If there are no allocations yet, make certain the software
is keeping them straight when the company starts to run Material
Requirements Planning.
Bills of Material
The accuracy target for bills of material is even higher than on inven-
tory balances: 98 percent minimum in terms of item number, unit of
measure, quantity per parent item, and the parent item number itself.
An error in any of these elements will generate requirements incor-
rectly. Incorrect requirements will be generated into the right compo-
nents or correct requirements into the wrong components, or both.
First, what does 98 percent bill of material accuracy mean? In
other words, how is bill accuracy calculated? Broadly, there are three
approaches: the tight method, the loose method, and the middle-of-
the road method.
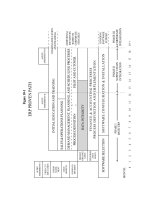
For the tight method, assume the bill of material in Figure 10-2 is
in the computer:
Suppose there’s only one incorrect relationship here—assembly A
really requires five of part D, not four. (Or perhaps it’s part D that’s
not used at all, but, in fact, four of a totally different part is required.)
The tight method of calculating bill accuracy would call the entire
206 ERP: M I H
Figure 10-2
Finished
Product X
1/
Assembly A
2/
Item L
1/
Item B
2/
Item C
4/
Item D
10/
Raw material Q
bill of material for finished product X a miss, zero accuracy. No more
than 2 percent of all the products could have misses and still have the
bills considered 98 percent accurate.
Is this practical? Sometimes. We’ve seen it used by companies with
relatively simple products, usually with no more than several dozen
components per product.
The flip side is the loose method. This goes after each one-to-one
relationship, in effect each line on the printed bill of material. Using
the example above, the following results would be obtained:
Misses Hits
D to A B to A
C to A
A to X
Q to L
L to X
Accuracy: five hits out of six relationships, for 83 percent accuracy.
Most companies would find this method too loose and would opt for
the middle-of-the-road method. It recognizes hits and misses based
on all single level component relationships to make a given parent.
Figure 10-3 uses the same example:
Data Integrity 207
Figure 10-3
Finished
Product X
1/
Assembly A
2/
Item L
1/
Item B
2/
Item C
10/
Raw material Q
4/
Item D
HIT
HITMISS
Accuracy: 67 percent. Overall, this approach is used most frequently.
Select this method unless there are strong reasons to the contrary,
and stick to it. Consistency is important; if the measurement is con-
sistent, then you can determine if you’re improving, on a plateau, or
backsliding. Again, the overall bottom line is the validity of the mas-
ter schedule and material plan.
Once the company has decided how to calculate bill of material ac-
curacy, it’ll need to determine the measurement approaches to be
used, to both acquire accuracy initially and to monitor it on an on-
going basis. Here are some options:
1. Floor audit.
Put some product engineers into the assembly and subassembly ar-
eas. Have them compare what’s actually being built to the bill of ma-
terial. They should work closely with not only the foremen but also
with the assemblers. Correct errors as they’re discovered.
2. Office/factory review.
Form a team of people from the plant floor plus engineers, material
planners, and perhaps cost people to review the bills jointly, sitting
around a conference table. The question to be asked: “Is this the way
we build it?” Again, correct errors as they’re found.
3. Product teardown.
Take a finished product apart. Compare the parts and pieces on the
table with the computer listing and correct the errors. This is a good
approach for many companies, but may be impractical if the product
is a jet airliner. Another shortcoming can be the difficulty in recog-
nizing subassemblies.
4. Unplanned issues/receipts.
When production people go back to the stockroom for more parts, is
it because they scrapped some or because they didn’t get them in the
first place? If the latter is the case, there may be a bill error that
caused the picking list to be generated incorrectly.
208 ERP: M I H
TEAMFLY
Team-Fly
®
If parts are returned to stock after the assembly of a product, per-
haps they shouldn’t have gone out to the plant floor in the first place.
Again, the picking list may have been wrong because the bill was
wrong. Correct the errors as they’re discovered. This can be a good
technique to monitor bill of material accuracy on an ongoing basis.
Certainly, some of these methods are inappropriate for some com-
panies. Select one method, or a combination, and get started as soon
as possible. Don’t go on the air without 98 percent accuracy on all
bills because MRP won’t work well without accurate bills.
In addition to being accurate, the bills of material need to be com-
plete, properly structured, and integrated.
1. Completeness.
Ideally, bills of material should include everything involved in
making the product—things like raw materials, fasteners, packing
materials, solder and flux, paint, and so forth. At a minimum, all the
important stuff (like raw materials, purchased components, unique
packaging materials, etc.) must be in the bills before turning on Mas-
ter Scheduling and MRP.
The test is: Is this item a shipment stopper? If the unit in question
is truly a standard item (nuts, bolts, paint, rivets, solder) that you can
get off the shelf from the supply house down the street, then it’s not
a shipment stopper. Otherwise, it probably is. Therefore, all the ship-
ment stoppers must be in the bills before you go live. However, don’t
delay the implementation to get all the non-shipment-stoppers on
the system. They should be added as soon as it’s practical, but don’t
let them be on the critical path.
2. Structure.
Structure has two meanings. First, bills must be properly struc-
tured to show stock points, phantoms, and so on.
Second, companies whose products have many options usually
need to structure their bills into a modular format, creating what are
called “planning bills.” This enables effective forecasting, master
scheduling, and customer order promising. (More on this later in
this chapter.) Caution: Estimate the work load closely ahead of time.
Data Integrity 209
Typically, it takes a good deal of time and effort to develop modular
bills. Don’t forget the principle of three knobs: the work to be done,
the calendar time in which it needs to be done, and the resources
available to do it.
3. Integration.
Some companies have a variety of different bill of material files.
Engineering has one, but manufacturing has its own. The cost ac-
counting department doesn’t like either of those, so it maintains an-
other one to fit its needs.
ERP represents a company-wide game plan, in units and dollars,
so everyone is “singing from the same sheet of music.” That’s impos-
sible if different departments have different hymnals. After all, the
bill of material, along with the routings, represents the network
around which ERP is built. The various bills must be integrated into
a single, unified bill that serves the needs of all the different depart-
ments.
2
Routings
Here’s another example of why it’s easier to implement ERP in a flow
shop: The routings are often not very important. In many cases,
they’re not needed at all because, in a flow environment, the routing
is defined by how the equipment is laid out. In a job shop, the rout-
ings are not physical; they’re informational, and therefore they’re es-
sential for you job shoppers.
For those of you who need routings, there’s good news and bad
news. The bad news is that three key elements are unforgiving; they
need to be at least 98 percent accurate. These three elements are the
operations to be performed, their sequence, and the work centers at
which they’ll be done. Their accuracy is extremely important be-
cause they’ll be used by the computer to locate jobs (in plant floor
control) and to apply load (in capacity requirements planning). This
210 ERP: M I H
2
This may not be as tough as it sounds. Much of today’s software for ERP allows
for flexible retrieval of bill of material information, tailored to the specific needs of
each department. This can be done by intelligent coding capabilities within the bill
of material (product structure) record.
is where most companies need to apply a fair amount of time and ef-
fort, typically by foremen and manufacturing engineers.
The good news is that the standards, the other key element within
the routing, are forgiving. Extreme accuracy of the standards is not
necessary for CRP and plant floor control. This is because they con-
vert a variety of units—pieces, pounds, gallons, feet—into a common
unit of measure: standard hours. Errors, plus and minus, tend to can-
cel each other out, and the law of large numbers has an effect. A good
rule of thumb for standards is to try for accuracy of plus or minus 10
percent. Even if they’re skewed to the high or low side, the efficiency
factor can be used to translate the standard hours to clock hours.
Another good rule of thumb: If the standards today are good
enough to calculate product costs, payroll, and efficiencies, then
they’ll be accurate enough for ERP. Companies that already have
standards on a work-center-by-work-center basis typically find that
they don’t need to spend a great deal of time and effort in order to fix
the ones that are obviously wrong. However, most of your time
should be spent on the unforgiving elements.
Calculating routing accuracy is fairly straightforward. If, on a
given routing, all of the operations, sequence numbers, and work
centers are correct, that’s a hit. Otherwise, it’s a miss. The target is to
get at least 98 hits out of every 100 routings checked.
Methods for auditing and correcting routings include:
1. Floor audit.
Usually one or more manufacturing engineers follows the jobs
through the plant, comparing the computer-generated routing to
what’s actually happening. Here again, talk to the operators, the folks
who are making the items. Virtually every element involves an operator
to one degree or another. They know what’s happening. A variation
here is to check the jobs physically at a given work center. Does each job
at a given work center have an operation in its primary routing or al-
ternate that calls for that work center? If not, what’s it doing there?
2. Office/factory review.
Normally involves people from production and from manufactur-
ing engineering in a group, reviewing the computer-generated rout-
Data Integrity 211
ings against their knowledge of the plant and any additional docu-
mentation available.
3. Order close-out.
As shop orders are completed and closed out, the actual reporting
is compared to the computer-generated routing.
Not every one of these methods will be practical for every com-
pany. Some companies use a combination of several.
Companies that need plant floor control and CRP, but don’t have
routings and standards by work center, have a big job ahead of them,
and can’t afford to wait for phase II to begin. They should start just
as soon as possible. This part of the project needs to be adequately
resourced to do a big job—identify all the work centers, develop
routings and standards—without delaying the implementation of
the total system. Some companies have had to expand the manufac-
turing and engineering departments and/or obtain temporary indus-
trial engineering help from outside the company. This is another case
where that cost of a one-month delay number can help a lot with re-
source allocation/acquisition decisions.
Customer Orders
Last, but certainly not least, customer orders must be accurate. They
usually are and, for that reason, we’ve listed them last. However, since
the customer comes first, we’d better make sure that our customer or-
der files match their purchase orders. Not usually a problem, but at a
minimum take a spot check to ensure that everything’s okay with
what may be the most important set of data in the entire company.
The process of checking is usually simple. The customer service
people pull a small sample, maybe 50 or 100 orders, call the cus-
tomers and verify product, quantity, date, and anything else that may
be important. If this audit turns up problems, the process may need
to be expanded to a complete verification of the entire order file.
F
ORGIVING
D
ATA
Virtually all forgiving data is made up of item and work center num-
bers. In these categories, four-decimal-place accuracy isn’t necessary.
212 ERP: M I H
We’re not aware of any ERP initiative that went down the drain be-
cause the order quantities were not calculated with sufficient preci-
sion or because the demonstrated capacities weren’t within plus or
minus 2 percent.
Item Data
Item data refers to the planning factors necessary for the planning
and scheduling tools of master scheduling and MRP. Most of it is
static and is stored in the computer’s item master file. It includes
things like lead times, order quantities, safety stock/time, shrinkage
factors, scrap or yield factors (stored in the bill of material).
Getting the item data collected and loaded is a necessary step, but
it’s normally not a big problem. The people doing it should be pri-
marily the same ones who’ll be operating these planning systems: the
master scheduler(s), material planners, and distribution planners.
They’ll need education, time to do the job, and some policy direc-
tion.
Wherever practical, use the numbers already available. Review
them, make sure they’re in the ballpark, and fix the ones that are ob-
viously wrong. If the lead time for an item is too high or too low,
change it to a reasonable number; otherwise, leave it alone. If the or-
der quantity for a part is out of line, change it; if not, let it be. If an
item routinely experiences some scrap loss in production, add in a
scrap or shrinkage factor. Otherwise, leave that factor at zero.
The subject of using the numbers already in place leads to a larger
issue. When implementing ERP, change only what’s absolutely
necessary to make it work. Don’t make changes for incremental op-
erational improvement unless they’re also necessary for implemen-
tation. They’ll be plenty of time later, after the system is on the air, to
fine-tune the numbers and get better and better. There are two rea-
sons for this—people and diagnosis:
1. Implementing Enterprise Resource Planning is a time of great
change in a company. For most people, change is difficult. In-
troducing nonessential changes will make the entire imple-
mentation process more difficult than it needs to be.
2. Unnecessary changes also complicate the diagnostic process
when something goes wrong. The greater the number of things
Data Integrity 213
that were changed, the greater the number of things that could
be causing the problem. This makes it correspondingly (per-
haps even exponentially) harder to find the problem and fix it.
Work Center Data
The information involved here includes things like work center iden-
tification, demonstrated capacity, efficiency (or productivity) fac-
tors, and desired queues for the job shops.
Review the work center arrangement now being used. Ask whether
the machines are grouped correctly into work centers and whether the
operator skill groups are established properly. A key factor here—
how does each foreman view the equipment and people in his or her
department, in terms of elements to be scheduled and loaded?
Make whatever changes are necessary. The goal is to enable CRP, in-
put/output, and shop dispatching to give the foreman the right infor-
mation as to work load, priorities, and schedule performance. Realize
that changes in work center identification will mean changes to the
routings. A good bit of work may be involved. A computer program can
often help in revising routings to reflect new work center assignments.
Start to gather statistics for each work center: demonstrated ca-
pacity, efficiency factors, and planned queue. This last element may
represent a dramatic change. For most companies, planned queues
will be smaller than they were under the informal system. Many
companies determine their queues by considering “the range” and
“the pain.” Range refers to the variability of job arrival at the work
centers; pain means how much it will hurt if the queue for a particu-
lar work center disappears, and it runs out of work.
The key players in these decisions are the foremen and the indus-
trial engineers. Usually, the engineers develop the numbers, while the
foremen are more involved with the qualitative information, such as
grouping equipment for the best work center arrangement, the
amount of pain suffered by the center that runs out of work, and so
on. Foremen buy-in is critical here. Therefore, they, and their bosses,
must call the shots. They, and their people, are the ones who’ll be ac-
countable for making it work.
Forecasts
Yes, Virginia, the sales forecasts fall into the forgiving category. And
it’s a darn good thing, too, because the forecasts will never be super
214 ERP: M I H
accurate. This may be a tough pill for you long-term manufacturing
people to swallow, but that’s the way it is.
The reason your sales forecasts will never be highly accurate is that
your marketing and sales people cannot predict the future with cer-
tainty. Okay? If they could, do you think they’d be working for a liv-
ing, knocking themselves out 40 plus hours per week trying to get
customers to order your product? Of course not. Where would they
be if they could foresee the future with certainty? At the racetrack, of
course. And if the track’s closed? At home on their computers—
trading in stock options and speculating on pork belly futures.
However, there’s a flip side to this. In almost all companies who
implement ERP, forecast accuracy improves substantially. This is
done through more frequent reviews, on a more focused basis, with
good communications and measurements. You marketing and sales
folks should plan on working hard to improve the accuracy of your
forecasts. Everyone, though, should recognize that the law of dimin-
ishing returns applies here: As forecast accuracy increases, there
comes a point where each additional unit of effort does not generate
a commensurate unit of greater accuracy.
This is where the forgiving nature of forecasts comes into play.
Many companies have found their ability to cope with forecast error
increases dramatically as they obtain:
1. Improved demand management, order promising and master
scheduling capabilities. With closer links to the customers, they fre-
quently can deal more with specific customer demand and rely less
on purely forecasted projections.
2. Reduced lead times. Shorter lead times are one of the most im-
portant parts of running a manufacturing business well. The shorter
the lead time—to enter the customer orders, to make the product, to
buy the material—the less vulnerable a company is to forecast error.
Consequently, the company is better able to ship what the customers
want, when they want it. And isn’t that what it’s all about?
3. The ability to forecast at a higher level. A growing number of
companies have found it really isn’t necessary to do lots of forecast-
ing at the individual item or stockkeeping unit (SKU) level. Rather,
through the intelligent use of planning bills of material, they can
forecast higher in the product structure. When Widget Model #123
comes in six different colors, all of which are applied in the finishing
Data Integrity 215
operation, is it really necessary to forecast all six colors of Model
#123? Probably not. Rather, whenever possible, forecast at the model
level; this means one forecast rather than six. The law of large num-
bers will also apply—the one-model forecast will almost always be
more accurate than the individual forecasts for each of the SKUs.
Finish and paint to the customer orders as they’re received. And the
planning bills of material will be there to help them not run out of the
different colors of paint.
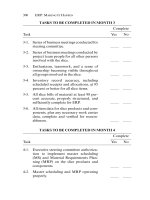
IMPLEMENTERS’ CHECKLIST
Complete
Task Yes No
1. Inventory record accuracy, including
scheduled receipts and allocations, at 95
percent or better.
_____ _____
2. Bill of material accuracy at 98 percent or
better.
_____ _____
Q & A
WITH THE
A
UTHORS
M
IKE
: I can imagine you’ve seen some pretty impressive data ac-
curacy efforts over the years. True?
T
OM
: Indeed. The most impressive was in a company that made
highly complex machinery with many components, subassem-
blies, and piece parts. They had around 60,000 active part num-
bers. Because of management problems in their materials
management group, their inventory accuracy efforts were lagging
the rest of the project. They had about 55% percent accuracy in
January and were scheduled to go live in April. Well, don’t you
know, they changed materials managers and got very focused on
this problem. By mid-March, they had reached—and were main-
taining—95 percent+ inventory accuracy in all four stockrooms.
The pilot and cutover happened on schedule. It can be done.
216 ERP: M I H
Complete
Task Yes No
3. Bills of material properly structured, suffi-
ciently complete for MRP, and integrated
into one unified bill for the entire company.
_____ _____
4. Routings (operations, sequence, work cen-
ters) at 98 percent or better accuracy.
_____ _____
5. Open production orders at 98 percent or
better accuracy.
_____ _____
6. Open purchase orders at 98 percent or bet-
ter accuracy.
_____ _____
7. Forecasting process reviewed for timeli-
ness, completeness, and ease of use.
_____ _____
8. Item data complete and verified for reason-
ableness.
_____ _____
9. Work center data complete and verified for
reasonableness.
_____ _____
Data Integrity 217
TEAMFLY
Team-Fly
®
Chapter 11
Going on the Air—
Basic ERP (Phase I)
Going on the air means turning on the tools, starting to run them.
It’s the culmination of a great deal of work done to date.
Back in Chapter 3, we discussed the proper implementation se-
quence:
• Phase I—Basic ERP
• Phase II—Supply Chain Integration
• Phase III—Extensions and Enhancements to support Corpo-
rate Strategy.
Let’s take a moment and look at a new version of the Proven Path
diagram, as shown in Figure 11-1. We’ve enlarged the section deal-
ing with process definition, pilot & cutover—to show more specifics
on the phase I and phase II implementations. We’ll cover phase II—
supply chain integration—in the next chapter. For now let’s look at
going on the air with the phase I tools of basic ERP.
These are Sales & Operations Planning, demand management,
master scheduling, Rough-Cut Capacity Planning, and Material Re-
quirements Planning. Further, in a flow shop, plant scheduling
should be implemented here.
Recognize that some of the elements of ERP have already been im-
219
INITIAL EDUCATION AND TRAINING
SALES & OPERATIONS PLANNING
DEMAND MGMT, DETAILED
PLANNING, AND SCHEDULING
PROCESSES
PROCESS DEFINITION:
PERFORM-
ANCE
GOALS
PROJECT
ORGANIZ-
ATION
ERP PROVEN PATH–PHASE I ONLY
PHASE I
BASIC ERP
0 1 2 3 4 5 6 7 8 9 10 11 12 13 14 15 16 17 18 19
+
MONTH:
GO/NO-GO
DECISION
COST/
BENEFIT
VISION
STATE-
MENT
FIRST-CUT
EDUCATION
AUDIT/
ASSESSMENT I
DATA INTEGRITY AND COMPLETENESS
AUDIT/
ASSESSMENT II
FINANCE & ACCOUNTING PROCESSES – PROCESS DEFINITION & IMPLEMENT
ATION
SOFTWARE CONFIGURATION & INST
ALLATION
SOFTWARE SELECTION
PILOT & CUTOVER:
DEMAND MGMT,
MASTER SCHEDULING,
MATERIAL PLANNING
FOR PHASE I PROCESSES FOR PHASE I PROCESSES
Figure 11-1