Báo cáo hóa học: " Synthesis and Photoluminescence Properties of Porous Silicon Nanowire Arrays" pdf
Bạn đang xem bản rút gọn của tài liệu. Xem và tải ngay bản đầy đủ của tài liệu tại đây (671.2 KB, 7 trang )
NANO EXPRESS
Synthesis and Photoluminescence Properties of Porous Silicon
Nanowire Arrays
Linhan Lin
•
Siping Guo
•
Xianzhong Sun
•
Jiayou Feng
•
Yan Wang
Received: 27 May 2010 / Accepted: 26 July 2010 / Published online: 5 August 2010
Ó The Author(s) 2010. This article is published with open access at Springerlink.com
Abstract Herein, we prepare vertical and single crystal-
line porous silicon nanowires (SiNWs) via a two-step
metal-assisted electroless etching method. The porosity of
the nanowires is restricted by etchant concentration, etching
time and doping lever of the silicon wafer. The diffusion of
silver ions could lead to the nucleation of silver nanoparti-
cles on the nanowires and open new etching ways. Like
porous silicon (PS), these porous nanowires also show
excellent photoluminescence (PL) properties. The PL
intensity increases with porosity, with an enhancement of
about 100 times observed in our condition experiments.
A ‘‘red-shift’’ of the PL peak is also found. Further studies
prove that the PL spectrum should be decomposed into two
elementary PL bands. The peak at 850 nm is the emission of
the localized excitation in the nanoporous structure, while
the 750-nm peak should be attributed to the surface-oxidized
nanostructure. It could be confirmed from the Fourier
transform infrared spectroscopy analyses. These porous
SiNW arrays may be useful as the nanoscale optoelectronic
devices.
Keywords Porous silicon nanowires Á
Electroless etching Á Silver catalyst Á
Photoluminescence Á Porosity
Introduction
Silicon with nanoscale has received much attention due to its
potential applications on electronics, photonics, nanoscale
sensors and renewable energy. Several silicon nanostruc-
tures, such as porous silicon (PS), silicon nanowires (SiNWs)
and silicon nanocrystals, were proposed over the past
decade. Due to their unique one-dimensional physical
properties, SiNWs were explored for field effect transistors
[1–4], chemical or biological sensors [5–9], battery elec-
trodes [10, 11] and photovoltaics [12–14]. However, the
application of silicon is still greatly restricted due to its
indirect energy band gap, especially in the field of optically
active material and optoelectronics. Silicon nanocrystals
[15, 16] and PS [17, 18] are thought to be possible can-
didate systems in solving this physical inability and act as
effective light emitters. PS is typically prepared by
applying a voltage bias to a silicon substrate immersed in
the ethanol and hydrofluoric acid mixture. The metal-
assisted chemical etching process was also used to prepare
PS [19] and SiNWs [20–24] as well. Few attempts were
focused on the luminescence of SiNWs [25–29]. Recently,
it is found that this method can be used to synthesize a new
silicon nanostructure named Porous SiNWs [30, 31], which
could combine the physical feature of SiNWs and PS. It is
also possible to gain a large area uniform array controllable
and repeatable. It is expected this could open a new
opportunity for the silicon based optoelectronics and pho-
toelectrochemical devices.
In this work, we synthesized porous SiNWs with differ-
ent parameters, including the etchant concentration, etching
time and post-treatment. The variable morphology of the
SiNWs is present, and the etching mechanism is discussed.
The photoluminescence (PL) properties dependent on the
processing parameters are also investigated here.
L. Lin Á S. Guo Á X. Sun Á J. Feng (&)
Department of Materials Science and Engineering,
Key Lab of Advanced Materials, Tsinghua University,
100084 Beijing, People’s Republic of China
e-mail:
Y. Wang
Institute of Microelectronics of Tsinghua University,
100084 Beijing, People’s Republic of China
123
Nanoscale Res Lett (2010) 5:1822–1828
DOI 10.1007/s11671-010-9719-6
Experiment Details
SiNW arrays were prepared by Ag-assisted chemical
etching of n-Si (100) wafers with the resistivity of about
0.02 X cm. The samples were firstly washed with acetone
and deionized water and then immersed into H
2
SO
4
and
H
2
O
2
solution in a volume ration of 3:1 to remove the
organic contaminants on the surface. The thin oxide layer
formed on the surface was then dissolved in a 5% HF
solution. This treated wafer was transferred into an Ag
deposition solution containing 4.8 M HF and 0.005 M
AgNO
3
for 1 min at room temperature. The Ag nanopar-
ticles (AgNPs) coated samples were sufficiently rinsed with
deionized water to remove extra silver ions and then
soaked into an etchant bath. The HF concentration of the
etching solutions is 4.8 M, while the H
2
O
2
concentrations
vary from 0.1 to 0.5 M. The etching times are 30, 60, 90,
120 and 180 min, respectively. The Ag metal was dis-
solved with nitric acid. Then, each sample was divided into
two parts, one of which was immersed into 5% HF solution
to remove the oxide layer induced by the nitric acid.
Finally, the wafers were cleaned with water and dried
under N
2
flow.
The SiNW arrays were characterized by scanning elec-
tron microscopy (SEM) using JEOL JSM-6460LV, Ther-
mally-Assisted Field Emission SEM (LEO 1530) and TEM
(JEOL-200CX). The local atomic environments and
bonding configurations in the samples were examined by
Fourier transform infrared spectroscopy (FTIR) using
Nicolet 6700. The PL measurements were conducted using
an XYtriple spectrograph equipped with a liquid
N
2
-cooled CCD camera. A 514.5-nm line Ar
?
laser was
employed to excite the luminescence with a spot size of
about 5 lm in diameter and excitation power of 0.1 mW.
All PL spectra were taken at room temperature.
Results and Discussion
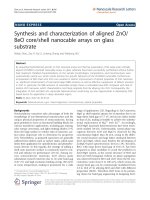
SEM and TEM images of the as-grown SiNWs etched with
different H
2
O
2
concentrations for 1 h are summarized in
Fig. 1. The nanowires distribute uniformly on the whole
wafers and are vertical to the substrate surface. The
nanowires etched with lower H
2
O
2
concentrations are
isolated from each other. However, when the concentration
of H
2
O
2
increases, the tips of the nanowires congregate
together. The diameters of the congregated bundles are
several micrometers from the top view. These congregated
bundles are also uniformly distributed on the entire wafers
and could be confirmed from the cross-section images.
From the TEM images, it is found that the surface of the
nanowires becomes rough and the porosity (or the density)
of the nanopores increases with H
2
O
2
concentration. From
our condition experiments, we found that the nanopores
appear from the lowest H
2
O
2
concentration of 0.1 M, for
which the pores are smaller (several nanometers) and
porosity is rather low. This is different from the earlier
report [31] which pointed out that the nanopores did not
appear, but only rough surface was found until the H
2
O
2
concentration was high enough. With the increase of H
2
O
2
concentrations, the pores also seem to grow, with the
diameters ranging from several nanometers to nearly
10 nm for higher H
2
O
2
concentrations. The diffraction
pattern in Fig. 1o indicates the nanowire is single crystal-
line. We also prepared SiNWs with the same H
2
O
2
concentration of 0.3 M, but different etching times from
30 min to 3 h. The morphology of these SiNWs is sum-
marized in Fig. 2. The variable morphology of the SiNWs
with etching time is similar to the concentration of the
etchant. The congregated bundles appear, and the porosity
increases with longer etching time. Especially for the
3-h-etched sample, the inserted image of the congregated
tips shows that the tips of the nanowires were etched in
excess and the tips are fragmentary. The TEM image shows
that the wire consists of the net-like silicon framework.
This is also different from the earlier publication [31], in
which the authors figured out the H
2
O
2
concentration is the
key factor of the porosity varieties, while the etching time
could only increase the thickness of the porous layer. This
could be well explained by the formation mechanism of the
nanopores listed below.
The length variation of the nanowires with H
2
O
2
con-
centration and etching time is shown in Fig. 3. The
chemical etching of Si includes the reactions listed below.
2Ag þH
2
O
2
þ 2H
þ
! 2Ag
þ
þ 2H
2
O ð1Þ
Si þ4Ag
þ
þ 6F
À
! 4Ag þSiF
2À
6
ð2Þ
The total reaction
Si
0
þ 2H
2
O
2
þ 6F
À
þ 4H
þ
!½SiF
6
2À
þ 4H
2
O ð3Þ
From Eq. 3, the potential for the etching process could be
expressed as below.
DE ¼ DE
0
À
0:059
4
log
SiF
2À
6
ÂÃ
½H
2
O
2
2
½H
þ
4
½F
À
6
ð4Þ
The increase in H
2
O
2
concentration could enhance the
potential for the etching process, which indicates that the
etching reaction is more thermodynamically favored and
the etching could be accelerated. Therefore, the length of the
nanowires is not only time dependent, but also relies on the
oxidant concentration. Figure 3b shows that the length of
SiNWs etched for 3 h is a bit lower than expected. This could
be attributed to the serious conglomeration of the SiNWs.
The etching process of the porous SiNWs could be
elucidated in Fig. 4. As the catalyst, the AgNPs are
Nanoscale Res Lett (2010) 5:1822–1828 1823
123
oxidized into Ag
?
ions by H
2
O
2
. The Ag
?
ions extract
electrons from Si nearby and are deoxidized into Ag again.
The Si atoms around are oxidized and dissolved, leading to
the etching of the silicon surface and the formation of the
vertical SiNW arrays [32]. However, during the etching
process, the Ag
?
ions could not be recovered to Ag totally.
Ag
?
ions with certain concentration around the AgNPs
would diffuse out to the tips of the SiNWs, where the
concentration of Ag
?
ions is lower. For the lightly doped
silicon wafer, the Ag
?
ions along with the SiNWs are
difficult to be deoxidized into smaller AgNPs as the lack of
defective sites for new nucleation. So the diffused Ag
?
cannot etch the sidewalls of the SiNWs and no porous
structure appears. However, for the heavily doped silicon
wafers, the dopants could induce amount of weak defective
points in the silicon lattices. These defective points could
serve as the nucleation centers. When the Ag
?
ions near the
defective points reach a critical concentration, the Ag
?
will
nucleate on the side walls or the tips of the SiNWs and the
smaller AgNPs appear. These newly formed AgNPs open
new etching pathways on the SiNWs and facilitate the
formation of the nanopores. Furthermore, the nucleation of
the AgNPs on the side walls would also reduce the Ag
?
concentration and accelerates the Ag
?
diffusion. When the
Ag
?
ions concentration reaches the critical value again,
new nucleation occurs. This could be confirmed by our
results listed in Fig. 2, the porosity of the nanowires
increases with the etching time, which indicates that new
AgNPs appear and new nanopores form with time. It could
also be found that some nanopores overlap on the side
walls, especially for the SiNWs etched with longer time. It
is because new AgNPs nucleation takes place near the
defects distributed on the wires, some nucleation centers
stay near the formed nanopores, and the newly etched pores
would overlap with the original ones. It could also explain
why the nanopores seem to grow larger with times. From
this mechanism, we could deduce that the side walls on the
topside of the wires have higher porosity compared with
the downside. It is confirmed by the TEM images in Fig. 5.
As the nanowires were scraped from the wafers, the cuts of
Fig. 1 SEM and TEM images
of the variable morphology of
porous SiNWs etched with
different H
2
O
2
concentrations.
a–c 0.1 M H
2
O
2
, d–f 0.2 M
H
2
O
2
, g–i 0.3 M H
2
O
2
,
j–l 0.4 M H
2
O
2
, m–o 0.5 M
H
2
O
2
. The SAD pattern is
shown in the inset (o)
1824 Nanoscale Res Lett (2010) 5:1822–1828
123
the wires are trim. However, the tips are fragmentary as
shown in the SEM image. Figure 5b–d correspond to the
different sections on the same nanowire marked in Fig. 5a.
It could be clearly seen that the porosity increases and the
nanopores grow larger from the bottom to the top tip. The
increase in H
2
O
2
concentrations could accelerate the
oxidation of Ag and increase the Ag
?
ions concentrations,
leading to more additional etching pathways and higher
porosity. It could be concluded that the doping lever of the
silicon wafer, the H
2
O
2
concentration and the etching time
are the key factors for the nanopores formation on the
SiNWs.
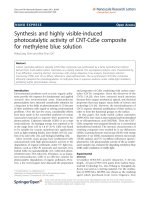
The room temperature PL measurement was carried out
to study the optical properties of the porous SiNWs.
Figure 6a and b display the PL spectrums of the porous
SiNWs with different H
2
O
2
concentrations and etching
Fig. 2 SEM and TEM images
of the variable morphology of
porous SiNWs etched with
0.3 M H
2
O
2
for different times.
a–c 30 min, d–f 60 min,
g–i 90 min, j–l 120 min,
m–o 180 min. The inset in n is
the higher magnification image
as marked
Fig. 3 The lengths of the
porous SiNWs depend on
a H
2
O
2
concentrations and
b etching times
Nanoscale Res Lett (2010) 5:1822–1828 1825
123
times. As the increase in the H
2
O
2
concentrations or
etching times, the porosity of the nanowires increases and
leads to the PL intensity enhancement. The PL intensity of
SiNWs etched with 0.5 M H
2
O
2
is almost 35 times as high
as the samples etched with 0.1 M H
2
O
2
. When the sample
was etched for 3 h, an increase in the PL intensity by a
factor of 40 is observed, compared with the 30 min-etched
sample. However, it is unexpected to find that PL peaks of
the samples with higher porosity seem to ‘‘red-shift’’ and
are not well symmetrical. It is thought that higher porosity
would decrease the size of the silicon nanostructure, which
could lead to the blue-shift of the PL peak due to the
quantum confinement effect. In order to explain this phe-
nomenon, we decomposed the PL spectrums shown in
Fig. 7a. It is displayed that the PL spectrum is composed of
two elementary PL bands with the peaks around 750 and
850 nm, respectively. This indicates that the PL spectrums
shown in Fig. 6a and b have two origins. We also measure
the PL spectrums of the samples treated with HNO
3
but
without HF solution, which are considered to have an oxide
layer on the surfaces. It is found that the PL peaks are fixed
at *730 nm for all the samples. The PL intensity varieties
with the preparation parameters are similar with the sam-
ples with HF treatment. These PL peaks at 730 nm are
close to the 750-nm PL peaks decomposed from the
HF-treated samples. The deviation should be attributed to
the decomposition of the observed PL spectrum with two
ideal Gauss peaks. It is supposed that the HF-treated
samples are partially oxidized when exposing in the air and
the PL spectrums in Fig. 6a and b compose of two PL
bands. The peak fixed at 750 nm arises from the silicon
nanostructure coated with a thin oxide layer, while the one
at 850 nm should be the emission of the localized excita-
tion in the nanoporous structure.
The FTIR analysis was carried out to confirm our sup-
position. As is shown in Fig. 8, the characteristic asym-
metric stretching signals of Si–O–Si Bridge distribute
between 1,000 and 1,300 cm
-1
in the spectrum. The
signals include a strong band at *1,080 cm
-1
(adjacent
oxygen atoms execute the asymmetric stretching motion in
phase with each other) and a shoulder at *1,200 cm
-1
(adjacent oxygen atoms execute the asymmetric stretching
motion 180° out of phase). The peaks between 2,050 and
2,170 cm
-1
represent the absorption due to different
vibration modes of Si–H
x
bonds, while the peak at
2,248 cm
-1
corresponds to the Si–H stretching mode in
O
3
-SiH. It is shown that the signal from Si–O bond is much
stronger for the HNO
3
-treated samples. The small peaks
around 2,100 and 2,248 cm
-1
indicate that there are still
small amount of surface hydrogen bonds. After HF treat-
ment, the signal of Si–O bond still exists but falls down. As
the previous oxide layer was dissolved in the HF solution,
these weak peaks should be due to the natural oxidation in
the air. The stronger Si–H signal reflects the fact that the
surface is mainly terminated by Si–H
x
bonds. These FTIR
results approve our deduction above.
Furthermore, we study the elementary PL intensity of
the HF treated samples with different processing parame-
ters. As is shown in Fig. 7, for the samples with lower
porosity, the peak at 750 nm is stronger than the one at
850 nm. When the porosity increases, both the PL inten-
sities increase. However, the emission intensity from the
local nanoporous structure enhances more quickly and
takes up the leading place. This is more obvious in Fig. 7c,
the intensity of the 850-nm PL peak is twice as high as the
peak at 750 nm for the 3-h-etched sample. This explains
why the PL peaks of the HF-treated samples seem to
‘‘red-shift’’ with longer etching times or higher H
2
O
2
concentrations.
Fig. 4 Schematic view of the
formation mechanism of porous
SiNW arrays
Fig. 5 TEM image of different sections on the same wire. a low
magnification image of the SiNW, b–d corresponding higher
magnification images marked in a
1826 Nanoscale Res Lett (2010) 5:1822–1828
123
Conclusions
In summary, we carried out electroless etching on the
highly doped n-type silicon (100) wafers to synthesize the
porous SiNW arrays. We found that longer etching time or
higher H
2
O
2
concentration could facilitate the diffusion
and nucleation of Ag
?
ions and effectively enhance the
porosity of the nanowires. The PL intensity could be
Fig. 6 The PL spectrums of the SiNWs with different preparation
parameters. a,b Correspond to the samples with HF treatment,
c,d correspond to the samples with HNO
3
treatment. (1)–(5)ina and
c correspond to the SiNWs etched for 60 min with the H
2
O
2
concentrations of 0.1, 0.2, 0.3, 0.4 and 0.5 M, respectively. (1)–(5)in
b and d correspond to the SiNWs etched with 0.3 M H
2
O
2
for 30, 60,
90, 120, and 180 min, respectively
Fig. 7 a The decomposition of the PL spectrum of the SiNWs treated with HF and the PL intensity varieties of the elementary bands with
b H
2
O
2
concentrations and c etching times
Nanoscale Res Lett (2010) 5:1822–1828 1827
123
effectively enhanced by the increased porosity. Further
studies including the decomposition of the PL spectrum
and the FTIR analysis confirm that the surface of the
HF-treated porous SiNWs are composed of Si–H
x
and Si–O
bonds, corresponding to the peaks at 850 and 750 nm,
respectively. The emission intensity from the local porous
structure quickly enhances with the porosity and takes up
the leading place of the PL spectrum, resulting in the
‘‘red-shift’’ observed. These porous SiNWs combine the
physical properties of SiNWs and PS and could lead to
opportunities for new generation of nanoscale optoelec-
tronic devices.
Acknowledgments This work was supported by Tsinghua National
Laboratory for Information Science and Technology (TNList) Cross-
discipline Foundation.
Open Access This article is distributed under the terms of the
Creative Commons Attribution Noncommercial License which per-
mits any noncommercial use, distribution, and reproduction in any
medium, provided the original author(s) and source are credited.
References
1. Y. Huang, X.F. Duan, Y. Cui, L.J. Lauhon, K.H. Kim, C.M.
Lieber, Science 294, 1313 (2001)
2. Y. Ahn, J. Dunning, J. Park, Nano Lett. 5, 1367 (2005)
3. Q.L. Li, S.M. Koo, M.D. Edelstein, J.S. Suehle, C.A. Richter,
Nanotechnology 18, 315202 (2007)
4. S.M. Koo, Q.L. Li, M.D. Edelstein, C.A. Richter, E.M. Vogel,
Nano Lett. 5, 2519 (2005)
5. Z. Li, Y. Chen, X. Li, T.I. Kamins, K. Nauka, R.S. Williams,
Nano Lett. 4, 245 (2004)
6. K. Yang, H. Wang, K. Zou, X.H. Zhang, Nanotechnology 17,
S276 (2006)
7. G.F. Zheng, F. Patolsky, Y. Cui, W.U. Wang, C.M. Lieber, Nat.
Biotechnol. 23, 1294 (2005)
8. Y. Cui, Q.Q. Wei, H.K. Park, C.M. Lieber, Science 293, 1289
(2001)
9. K.Q. Peng, X. Wang, S.T. Lee, Appl. Phys. Lett. 95, 243112
(2009)
10. C.K. Chan, H.L. Peng, G. Liu, K. McIlwrath, X.F. Zhang, R.A.
Huggins, Y. Cui, Nat. Nanotechnol. 3, 31 (2008)
11. K.Q. Peng, J.S. Jie, W.J. Zhang, S.T. Lee, Appl. Phys. Lett. 93,
033105 (2008)
12. B.Z. Tian, X.L. Zheng, T.J. Kempa, Y. Fang, N.F. Yu, G.H. Yu,
J.L. Huang, C.M. Lieber, Nature 449, 885 (2007)
13. E.C. Garnett, P.D. Yang, J. Am. Chem. Soc. 130, 9224 (2008)
14. K.Q. Peng, X. Wang, S.T. Lee, Appl. Phys. Lett. 92, 163103
(2008)
15. N.A. Hill, K.B. Whaley, Phys. Rev. Lett. 75, 1130 (1995)
16. P. Mutti, G. Ghislotti, S. Bertoni, L. Bonoldi, G.F. Cerofolini,
L. Meda, E. Grilli, M. Guzzi, Appl. Phys. Lett. 66, 851 (1995)
17. L.T. Canham, Appl. Phys. Lett. 57, 1046 (1990)
18. L.T. Canham, W.Y. Leong, M.I.J. Beale, T.I. Cox, L. Taylor,
Appl. Phys. Lett. 61, 2563 (1992)
19. X. Li, P.W. Bohn, Appl. Phys. Lett. 77, 2572 (2000)
20. K.Q. Peng, Y.J. Yan, S.P. Gao, J. Zhu, Adv. Mater. 14, 1164
(2002)
21. M.L. Zhang, K.Q. Peng, X. Fan, J.S. Jie, R.Q. Zhang, S.T. Lee,
N.B. Wong, J. Phys. Chem. C 112, 4444 (2008)
22. K.Q. Peng, Y.J. Yan, S.P. Gao, J. Zhu, Adv. Funct. Mater. 13,
127 (2003)
23. K.Q. Peng, Z.P. Huang, J. Zhu, Adv. Mater. 16, 73 (2004)
24. K.Q. Peng, Y. Xu, Y. Wu, Y.J. Yan, S.T. Lee, J. Zhu, Small 1,
1062 (2005)
25. J. Huo, R. Solanki, J.L. Freeouf, J.R. Carruthers, Nanotechnology
15, 1848 (2004)
26. S. Kim, C.O. Kim, D.H. Shin, S.H. Hong, M.C. Kim, J. Kim, S.H.
Choi, T. Kim, R.G. Elliman, Y.M. Kim, Nanotechnology 21,
205601 (2010)
27. T.K. Sham, S.J. Naftel, P.S.G. Kim, R. Sammynaiken, Y.H.
Tang, I. Coulthard, A. Moewes, J.W. Freeland, Y.F. Hu, S.T. Lee,
Phys. Rev. B
70, 045313 (2004)
28. M.W. Shao, L. Cheng, M.L. Zhang, D.D.D. Ma, J.A. Zapien, S.T.
Lee, X.H. Zhang, Appl. Phys. Lett. 95, 143110 (2009)
29. M.H. Kim, I.S. Kim, Y.H. Park, T.E. Park, J.H. Shin, H.J. Choi,
Nanoscale Res. Lett. 5, 286 (2010)
30. A.I. Hochbaum, D. Gargas, Y.J. Hwang, P.D. Yang, Nano Lett. 9,
3550 (2009)
31. Y.Q. Qu, L. Liao, Y.J. Li, H. Zhang, Y. Huang, X.F. Duan, Nano
Lett. 9, 4539 (2009)
32. K.Q. Peng, A.J. Lu, R.Q. Zhang, S.T. Lee, Adv. Funct. Mater. 18,
3026 (2008)
Fig. 8 FTIR spectra of the SiNWs treated with HNO
3
and HF
1828 Nanoscale Res Lett (2010) 5:1822–1828
123