Báo cáo hóa học: " Deep-level Transient Spectroscopy of GaAs/AlGaAs Multi-Quantum Wells Grown on (100) and (311)B GaAs " pot
Bạn đang xem bản rút gọn của tài liệu. Xem và tải ngay bản đầy đủ của tài liệu tại đây (298.32 KB, 4 trang )
SPECIAL ISSUE ARTICLE
Deep-level Transient Spectroscopy of GaAs/AlGaAs
Multi-Quantum Wells Grown on (100) and (311)B
GaAs Substrates
M. Shafi
•
R. H. Mari
•
A. Khatab
•
D. Taylor
•
M. Henini
Received: 29 July 2010 / Accepted: 19 October 2010 / Published online: 16 November 2010
Ó The Author(s) 2010. This article is published with open access at Springerlink.com
Abstract Si-doped GaAs/AlGaAs multi-quantum wells
structures grown by molecular beam epitaxy on (100) and
(311)B GaAs substrates have been studied by using con-
ventional deep-level transient spectroscopy (DLTS) and
high-resolution Laplace DLTS techniques. One dominant
electron-emitting level is observed in the quantum wells
structure grown on (100) plane whose activation energy
varies from 0.47 to 1.3 eV as junction electric field varies
from zero field (edge of the depletion region) to
4.7 9 10
6
V/m. Two defect states with activation energies
of 0.24 and 0.80 eV are detected in the structures grown on
(311)B plane. The E
c
-0.24 eV trap shows that its capture
cross-section is strongly temperature dependent, whilst the
other two traps show no such dependence. The value of the
capture barrier energy of the trap at E
c
-0.24 eV is 0.39 eV.
Keywords Laplace DLTS Á Multi-quantum wells Á
DX centre Á Heterostructures
Introduction
During last few decades, heterostructure-based devices
have contributed to the advancement of diode lasers, high-
speed electrical devices [1] and THz detectors [2]. Elec-
trically and optically active defect states in the bandgap of
semiconductor materials can play an important role in their
carrier transport properties. Previous DLTS studies of
defects in GaAs/AlAs/GaAs quantum wells [3] showed that
at least six out of eight sub-bands in the heterostructures
are occupied by defect states. Using DLTS technique, Jia
et al. [4] investigated Si-doped GaAs/AlGaAs quantum
wells and superlattices and demonstrated that the energy of
the well-known DX centre in AlGaAs epilayers decreases
in the case of multi-quantum wells and increases for
superlattices. Arbaoui et al. [5] have also reported defects
states in MBE-grown AlGaAs/GaAs multi-quantum well
structures which can affect the carrier transport properties.
Most of the studies on defects in GaAs/AlGaAs quantum
wells and superlattices reported so far are on samples
grown on (100) GaAs plane. The crystallographic orien-
tation of the substrate has a strong influence on incorpo-
ration of impurities and defects and hence on optical and
electronic properties of III–V materials. It is therefore
important to probe similar structures grown on non-(100)
planes. In this work, DLTS [6] and LDLTS [7] techniques
have been employed to investigate the electrical properties
of defect states present within the bandgap of Si-doped
GaAs/AlGaAs multi-quantum wells (MQWs).
Experimental Details
The n-type silicon-doped GaAs/AlGaAs MQWs were
grown by molecular beam epitaxy (MBE) on a semi-
insulating (100) and (311)B GaAs substrates. The epilayers
that are doped to a concentration level of 2 9 10
16
cm
-3
are grown in the following order starting from the sub-
strate: 1 lm GaAs buffer layer, 0.14 lmAl
0.33
Ga
0.67
As
barrier, a 60 periods GaAs (50A
˚
)/Al
0.33
Ga
0.67
As (90A
˚
)
MQWs, 0.14 lmAl
0.33
Ga
0.67
As barrier. Ohmic contacts
were made to the bottom n-type-doped GaAs buffer
layer using wet chemical etching, metal evaporation of
Ge/Au/Ni/Au (54-nm/60-nm/20-nm/136-nm-thick layers)
M. Shafi Á R. H. Mari Á A. Khatab Á D. Taylor Á M. Henini (&)
School of Physics and Astronomy, Nottingham Nanotechnology
& Nanoscience Centre, University of Nottingham,
Nottingham NG7 2RD, UK
e-mail:
123
Nanoscale Res Lett (2010) 5:1948–1951
DOI 10.1007/s11671-010-9820-x
and annealing at 360°C for 30 s. The Schottky contacts
were fabricated by evaporating Ti/Au (40 nm/175 nm) on
the top of the n-type-doped Al
0.33
Ga
0.67
As.
Experimental Results
Current–voltage (I–V) measurements were taken prior to
DLTS measurements to select the Schottky diodes with low
leakage currents. Typical leakage currents of 2.4 9 10
-9
and 1.2 9 10
-9
A at reverse bias of -5 V were obtained on
(100) and (311)B devices, respectively. Background doping
concentration determined from capacitance–voltage (C–V)
measurements was 1.64 9 10
16
and 2.21 9 10
16
cm
-3
for
(100) and (311)B samples, respectively. The devices were
mounted in a 7-K closed-cycle helium cryostat. DLTS
spectra obtained from both (100) and (311)B devices using
a sampling rate window of 2.5 s
-1
, a quiescent reverse bias
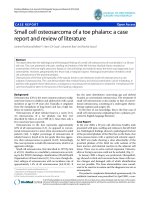
of -5 V and a filling pulse of 1 ms are shown in Fig. 1a.
LDLTS spectra of (100) and (311)B are shown in the inset
of Fig. 1a. A prominent peak associated with the electron
trap labelled E1 is detected in (100). The broader feature
that appears in the tail of E1 at a temperature *350 K could
not be resolved by either technique. (311)B sample shows
two peaks associated with defect states labelled EB1 and
EB2. Trap EB1 appears as a shoulder of the main peak EB2
at temperature *390 K and is resolved by using LDLTS as
shown in the inset of Fig. 1a.
Carrier emission rates were determined at different
temperatures using LDLTS. The value of the activation
energy of each trap is determined by using the relation
given by [6].
e
n
¼ r
n
hV
th
iN
c
exp À
E
A
k
B
T
ð1Þ
where E
A
is the activation energy, r
n
is the capture cross-
section, \V
th
[is the thermal velocity of the electron, N
c
is
the effective density of states in the conduction band, and
k
B
is the Boltzmann’s constant.
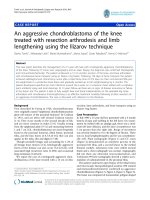
The dependence of the emission rate signatures of trap
E1 on the junction electric field is depicted in Fig. 2aas
function of reverse bias. Electric field–dependent carrier
emission measurements were taken using the double pulse
method [8]. The activation energy of trap E1 determined
from the slope of the Arrhenius plots (Fig. 2b) using Eq. 1
at different junction electric field strengths is illustrated in
Fig. 2c. From the extrapolation of energy to the zero field
value (edge of the depletion region) in the energy-field
graph (Fig. 2c), the activation energy value varies from
0.47 to 1.3 eV as the electric field is varied from zero to
4.7 9 10
6
V/m.
The emission rates of traps EB1 and EB2 in (311)B
samples show no dependence on the junction electric field,
and their activation energies as determined from Arrhenius
plots (Fig. 1b) are 0.24 and 0.80 eV, respectively.
Direct carrier capture measurements have also been
carried out using filling pulse method [9] at different
temperatures using the relation given below
DCt
p
ÀÁ
¼ DC
max
1 Àexp
Àt
p
s
c
!
ð2Þ
where DC is the magnitude of the capacitance transient, t
p
is the applied pulse duration, and s
c
is the capture
coefficient. The value of s
c
is derived from Eq. 2 and r
n
is determined using the following relation [9].
r
n
¼
1
s
c
hV
th
in
ð3Þ
where n is the free carrier concentration.
The inset of Fig. 3a, b, c shows r
n
as function of tem-
perature for traps in (100) and (311)B samples. r
n
of trap
EB1 (Fig. 3c, and the inset) shows a strong dependence on
the temperature, whilst r
n
of E1 and EB2 (Fig. 3a, b and
the insets) are temperature independent. The capture bar-
rier energy is determined using the relation given below
[10].
0
1
2
3
4
5
6
7
250 300 350 400 450
DLTS Signal (a.u)
Temperature (K)
(100)
(311)B
E1
EB1
EB2
(a)
10 1000
Laplace DLTS Signal(a.u)
Emission rate (sec
-1
)
EB1
EB2
E1
-4
-3
-2
2.3 2.4 2.5 2.6 2.7 2.8 2.9
ln (e
n
/T
2
) (sec
-1
K
-2
)
1000/T (K
-1
)
EB1
EB2
(b)
Fig. 1 a DLTS spectra of GaAs/AlGaAs multi-quantum well struc-
tures grown on (100) and (311)B GaAs substrates. The inset shows
the peaks resolved by Laplace DLTS technique; b Activation energies
of defect states EB1 and EB2 in (311)B samples as determined from
the Arrhenius plots
Nanoscale Res Lett (2010) 5:1948–1951 1949
123
r
n
TðÞ¼r
1
exp
ÀE
1
k
B
T
ð4Þ
where E
?
is the energy barrier to capturing electrons and
r
?
is the apparent value of the capture cross-section.
Discussion
Our results demonstrate that trap E1 in (100) sample is
strongly influenced by the external applied electric field.
The broad feature that appears in the tail of this peak could
be due to the existence of a closely spaced defect that
cannot be resolved because of its very small concentration.
We observed that the emission rates in the 416–430 K
temperature range of trap E1 (Fig. 2a) decrease as the
junction reverse bias increases. This kind of behaviour is
not compatible within the framework of the well-known
Poole–Frenkel mechanism in which the emission rate is
enhanced with the increase in the junction electric field
[11]. However, this sort of trend of carrier emission as a
function of electric field has also been observed for
DX-related centres in GaAs/AlGaAs MQWs structures by
Jia et al. [12]. In addition, this effect was found to be
dependent on the Al composition. Their results show that
the decrease in the thermal emission rates with increasing
field is strongest for the layers having medium Al com-
positions (Al: 30–40%) and smallest for the large Al con-
tent layers (Al: 50–60%). Our emission rates versus
electrical field results in the MQWs samples which have a
33% Al composition confirm their observations.
Further, the emission rates decrease with increasing field
strengths, which is contrary to the Poole–Frenkel effect. Jia
et al. [12] suggested that these changes in the emission and
capture rates at different field strengths are due to the traps
which are closely located and interacting with each other.
Moreover, if the electric field is not uniform in the deple-
tion region of the Schottky junction, emission rates con-
tribute non-uniformly from the depletion layer edge (zero
field) to the maximum junction field [13]. This infers that
the decrease in the carrier emission rate of E1 might be due
to its interaction with some other traps such as the one that
appears in the tail of its DLTS signal.
The dependence of the emission rate on the electric field
indicates that the trap can acquire a different net charge
-8
-7
-6
-5
2.56 2.61 2.66
ln(e
n
/
T
2
) (sec
-1
K
-2
)
1000/T (K
-
1
)
0.7
1.3
1.5
1.7
2.1
×10
6
V/m
Energy Level (E1)
×10
6
V/m
×10
6
V/m
×10
6
V/m
×10
6
V/m
(b)
10
100
1000
-5-4-3-2-10
Emission rate (sec
-1
)
Bias (V)
416K 420K
424K 430K
(a)
(c)
Energy (eV)
0
0.2
0.4
0.6
0.8
1
1.2
1.4
1.6
Activation energy data
extrapolated line
0 1 2 3 4 5
Energy Level (E1)
Applied Field × 10
6
V/m
Fig. 2 Emission rate signatures of each defect state; a Illustration of
the bias dependence of the emission rates of E1; b Arrhenius plots
obtained from the thermal emission rates at different junction fields;
c Activation energy of trap E1 as a function of applied electric field
-10
-8
-6
-4
-2
0
0 5 10 15 20
ln[1-(S
(tp)
/ S
o
)]
ln[1-(S
(tp)
/ S
o
)]
ln[1-(S
(tp)
/ S
o
)]
Filling Pulse (µsec)
1
2
3
375 385 395
Temperature (K)
σ
n
(cm
2
)
×10
-14
-0.4
-0.3
-0.2
-0.1
0.0
0 10203040
Fillin
g
Pulse
µ
sec)
T=380K
σ
n
=1.50 ×10
-18
cm
2
0.5
1.5
2.5
3.5
370 380 390 400
Temperature (
K)
-0.5
-0.4
-0.3
-0.2
-0.1
0
345678
Filling Pulse (µsec)
σ
n
=1.48 ×10
-15
cm
2
T=425K
0
2
4
400 410 420 430
Temperature (K)
σ
n
(cm
2
)×10
-15
σ
n
=1.89 ×10
-14
cm
2
T=380K
(a)
Trap E1
Trap EB2
σ
n
(cm
2
) ×10
-
18
Trap EB1
(c)
(b)
Fig. 3 Capture cross-section measurement for a trap E1, b trap EB2
and c trap EB1. Temperature effect on capture cross-section for each
trap is shown in the insets
1950 Nanoscale Res Lett (2010) 5:1948–1951
123
after the emission of the carriers from the trap. The trap E1
is electrically charged upon electron emission, and it
becomes neutral by capturing an electron. This suggests
that E1 should be a donor-like level. From the activation
energy results (Fig. 2c) for E1, the exact location of the
trap in the bandgap of the material is difficult to identify.
At zero field, extrapolation for the activation energy in
Fig. 2c gives the value of 0.47 eV which could correspond
to DX centre.
Since Laplace DLTS was able to resolve the broad peak
in (311)B sample, thermal emission rates of both traps
(EB1 and EB2) were analysed separately at different
reverse biases and no such behaviour to what we have seen
in the (100) sample has been observed. Thus, the emission
rate signatures of EB1 and EB2 are electric field inde-
pendent, and their charge state is neutral. The activation
energies determined from their emission rates using Eq. 1
are 0.24 and 0.80 eV, respectively. The emission rate sig-
natures of EB2 are comparable with published data of
defect E4 studied by Hayakaw et al. [13] in MBE-grown
Si-doped AlGaAs layers. They have considered the influ-
ence of stoichiometry on the traps and assigned this trap to
a complex that can include both group III vacancy (arsenic-
interstitial or antisite defect As
III
) and the arsenic vacancy
(group III interstitial or III
As
).
The capture cross-section (r
n
) results determined at
different temperatures show that carrier capture rates are
thermally activated for EB1(inset of Fig. 3c), whereas the
defect states E1 and EB2 show no such dependence upon
temperature as depicted in insets of Fig. 3a, b. Although r
n
of E1 does not depend on the temperature, but due to the
strong influence of the junction field, the apparent capture
cross-section determined from the intercept of the Arrhe-
nius plot of the emission rates shows large fluctuations in
its value from 1.75 9 10
-15
to 3.45 9 10
-10
cm
2
as the
field varies from zero to 4.7 9 10
6
V/m. The direct capture
cross-section measurements of this trap (Fig. 3a) at 380 K
and applied bias of -5 V give a value of 1.89 9
10
-14
cm
2
, which is much smaller than its apparent value.
The value of capture cross-section of trap EB2 (Fig. 3b) is
found to be 1.48 9 10
-15
cm
2
. The inset of Fig. 3c clearly
shows the increase of r
n
from 1.04 9 10
-18
to 2.58 9
10
-18
cm
2
as the temperature increases from 372 to 392 K.
The capture barrier energy calculated using relation (4)is
0.39 eV, which suggests a strong interaction of carriers
with the lattice [14].
Conclusion
We reported here the DLTS and LDLTS studies of MQWs
samples grown by MBE on (100) and (311)B GaAs sub-
strates. The activation energy of the dominant trap E1
observed in the sample grown on (100) is found to be
dependent on the junction electrical field. The measured
value for this trap varies from 0.47 to 1.3 eV as junction
electric field varies from zero to 4.7 9 10
6
V/m. Since the
emission rates of E1 are dependent on electric field, it can
be concluded that E1 is a donor-like level. Since EB1 and
EB2 traps in (311)B showed no evidence of a field
dependence, their charge states are confirmed to be neutral.
In addition, we observed that the capture cross-section of
EB1 is thermally activated, while those of E1 and EB2 are
not.
Open Access This article is distributed under the terms of the
Creative Commons Attribution Noncommercial License which per-
mits any noncommercial use, distribution, and reproduction in any
medium, provided the original author(s) and source are credited.
References
1. R. Ajjel, H. Maaref, Microelectronics. J. 37, 1404 (2006)
2. M. Kagan, I. Altukhov, E. Chirkova, V. Sinis, R. Troeger, S. Ray,
J. Kolodzey, Physica. Status. Solidi. (b) 235, 135 (2003)
3. Q. Zhu, Z. Gu, Z. Zhong, Z. Zhou, L. Lu, Appl. Phys. Lett. 67,
3593 (1995)
4. Y. Jia, Z. Han, H. Grimmeiss, L. Dobaczewski, J. Appl. Phys. 80,
2860 (1996)
5. A. Arbaoui, B. Tuck, C.J. Paull, M. Henini, J. Mat. Sci. 1,75
(1990)
6. D.V. Lang, J. Appl. Phys. 45, 3023 (1974)
7. L. Dobaczewski, A. Peaker, K. Nielsen, J. Appl. Phys. 96, 4689
(2004)
8. V.P. Markevich, A.R. Peaker, V.V. Litvinov, L.I. Murin,
N.V. Abrosimov, Physica. B. 376, 200 (2006)
9. Akbar Ali, M. Shafi, Abdul Majid, Phys. Scr. 74, 450 (2006)
10. C.H. Henry, D.V. Lang, Phys. Rev. B. 15, 989 (1977)
11. J. Frenkel, Phys. Rev. 54, 647 (1938)
12. Y.B. Jia, H.G. Grimmeiss, Phys. Rev. B. 47, 1858 (1993)
13. C.Y. Chang, W.C. Hsu, S.J. Wang, S.S. Hau, J. Appl. Phys. 60,
1042 (1986)
14. T. Hayakawa, M. Kondo, T. Suyama, K. Takahashi, S. Yamamoto,
S. Yano, T. Hijikata, Appl. Phys. Lett. 49, 788 (1986)
Nanoscale Res Lett (2010) 5:1948–1951 1951
123