Báo cáo hóa học: " Quantifying the quality of hand movement in stroke patients through three-dimensional curvature" potx
Bạn đang xem bản rút gọn của tài liệu. Xem và tải ngay bản đầy đủ của tài liệu tại đây (617.1 KB, 14 trang )
RESEARCH Open Access
Quantifying the quality of hand movement in
stroke patients through three-dimensional
curvature
Rieko Osu
1*†
, Kazuko Ota
2†
, Toshiyuki Fujiwara
2
, Yohei Otaka
3,2
, Mitsuo Kawato
1
and Meigen Liu
2
Abstract
Background: To more accurately evaluate rehabilitation outcomes in stroke patients, movement irregularities
should be quantified. Previous work in stroke patients has revealed a reduction in the trajectory smoothness and
segmentation of continuous movements. Clinically, the Stroke Impairment Assessment Set (SIAS) evaluates the
clumsiness of arm mov ements using an ordinal scale based on the examiner’s observations. In this study, we
focused on three-dimensional curvature of hand trajectory to quantify movement, and aimed to establish a novel
measurement that is independent of movement duration. We compared the proposed measurement with the SIAS
score and the jerk measure representing temporal smoothness.
Methods: Sixteen stroke patients with SIAS upper limb proximal motor function (Knee-Mouth test) scores ranging
from 2 (incomplete performance) to 4 (mild clumsiness) were recruited. Nine healthy participant with a SIAS score
of 5 (normal) also participated. Participants were asked to grasp a plastic glass and repetitively move it from the
lap to the mouth and back at a conformable speed for 30 s, during which the hand movement was measured
using OPTOTRAK. The position data was numerically differentiated and the three-dimensional curvature was
computed. To compare against a previously proposed measure, the mean squared jerk normalized by its minimum
value was computed. Age-matched healthy participants were instructed to move the glass at three different
movement speeds.
Results: There was an inverse relationship between the curvature of the movement trajectory and the patient’s
SIAS score. The median of the -log of curvature (MedianLC) correlated well with the SIAS score, upper extremity
subsection of Fugl-Meyer Assessment, and the jerk measure in the paretic arm. When the healthy participants
moved slowly, the increase in the jerk measure was comparable to the paretic movements with a SIAS score of 2
to 4, while the MedianLC was distinguishable from paretic movements.
Conclusions: Measurement based on curvature was able to quantify movement irregularities and matched well
with the examiner’s observations. The results suggest that the quality of paretic movements is well characterized
using spatial smoothness represent ed by curvature. The smaller computational costs associated with this
measurement suggest that this method has potential clinical utility.
Background
Stable manipulation of objects, for instance in activities
such as raising a glass of water to the mouth, requires
smooth con trol of the hand. Hemiparesis of the arm fol-
lowing stroke results in a degradation in the quality of
hand movements. To measure the level of impairment
in stroke patients with hemiparesis a number of assess-
ment tools are available, including the Brunnstrom stage
for motor impairment [1], the Motricity Index [2], the
Fugl-Meyer assessment [3] and the Stroke Impairment
Assessment Set (SIAS) [4-6]. Of the scaled assessments
available, the psychometric properties of the SIAS
(which was developed in and is frequently used in
Japan) are well described, with this scale providing the
* Correspondence:
† Contributed equally
1
Computational Neuroscience Laboratories, Advanced Telecommunications
Research Institute International (ATR), Kyoto, Japan
Full list of author information is available at the end of the article
Osu et al. Journal of NeuroEngineering and Rehabilitation 2011, 8:62
/>JNER
JOURNAL OF NEUROENGINEERING
AND REHABILITATION
© 2011 Osu et al; licensee BioMed Central Ltd. This is an Open Access articl e distributed under the terms of the Creative Commons
Attribution License ( which permits unrestricted use, distribution, and reproduction in
any medium, provided the original work is properly cited.
ability to evaluate arm function based on the observed
clumsiness of movement [4-6].
To motivate stroke patients to use their paretic arm
[7-10], it is important that the affected arm can execute
a task q uickly and smoothly. Therefore, movement free
of clumsiness is an important characteristic of move-
ment kinematics, and may promote the use of the pare-
tic arm [11]. Movement irregularity represented by
clumsiness may include both spatial and temporal aspect
of trajectory smoothness. Quantitative evaluation of
clumsiness, or spatio-temporal irregularity, is considered
helpful. However, existing scales, including the SIAS
scale, are based on the exa miner’s observations and thus
may be subject to subject ivity or observer bias. This has
prompted research into the development of a process
that allows for the objective evaluation of movement
based on the analysis of move ment kinematics [12-16].
It is also important to determine if the clinical scale of
movement irregularity obtained through observation
correlates with the objective measures of movement
irregularity [17-23].
Research into the field of computational motor control
has shown that well-trained movements are smoothest
in either the kinematic domain or the motor command
domain [24-26]. Based on these observations, a ttempts
have been made to evaluate movement based on
smoothness, normally expressed as the presence of jerki-
ness (rate of change of acceleration), in the healthy par-
ticipants. For example, Hogan and Ste rnad proposed a
mean squared jerk measure normalized by the minimum
possible mean squared jerk of that movement amplitude
and duration [27], which is called the mean squared jerk
ratio (MSJ ratio). The MSJ ratio is one of the dimen-
sionless jerk-measures occurring independent of move-
ment dura tion and amp litude [28]. In patients with
conditions such as stroke, movement is typicall y charac-
terized by many sub-movements [29-31]; therefore, it is
expected t hat in these patients movement will be jerkier
than in healthy people. Motor control researchers have
attempted to incorporate some form of jerk measure
into the functional evaluation of patients with stroke-
induced deficits or other motor deficits [32-35].
In this study, in addition to jerk metrics, we focused
on three-dimensional curvature, mathematically
described as an inverse of the radius of curvature at the
each point on the trajectory, to evaluate the quality of
hand movement. Curvature and jerk differ in the sense
that curvature quantifies spa tial characteristics, while
jerk quantifies the temporal characteristics of trajectory.
In theory, curvature is always zero for movemen t on a
straight path even when the amount of jerking is high.
Therefore, in theory, the curvature metric and the jerk
metric do not correlate with each other. However, in
reality, the human movement path is not perfectly
straight except when the movement path is constrained
by a physi cal object. When an abrupt change in accel-
eration (stop or reversal of the movement) occurs, the
path will also sharply curve, resulting in high curvature
[36,37]. Je rk requires a third order derivative of position,
while curvature can be computed using first-order (velo-
city) and second-order (acceleration) derivatives.
In healthy participa nts, a reaching movement is ballis-
tic and curvature is generally small in the middle, at
around 0.01 (1/mm) or less [37]. Curvature increases
only around the posture phase of a discrete movement
or the reflecting point of rhythmic movemen t. Here, we
hypothesized that, in stroke patients, the curvature
increases even in the middle of reaching due to the
patient’s inability to control the movement and the exis-
tence of sub-movements. In this study, we tested
whether the irr egularity of movement can be quantified
by curvature metrics, by evaluating movement in the
paretic arm of stroke patients, a gainst the movement of
age-ma tched healthy volunteers. We then compare d our
recorded metrics with the SIAS score and upper extre-
mity subscales of the Fugl Meyer Assessme nt, as well as
with previously proposed jerk metrics. Finally, we exam-
ined how the curvature and jerk metrics are sensitive to
the movement speed.
Methods
Participants
Sixteen patients suffering from hemiparesis were
recruited into the study. The thirteen patients partici-
pated in Experiment 1 were drawn from a larger group
who were hospitalized in a university hospital for 3
weeks for the purpose of intensive training to improve
finger extension movement through the HANDS ther-
apy [9]. These patients (P1-P13) were expected to obtain
major improvements in hand function (as evaluated
using the SIAS finger function test score). However, the
HANDS therapy was not targeting proximal upper
extremity function, which is the process involved in
reaching movements and what we were assessing in this
study (s ee below). As the aim of this study was to evalu-
ate the movement kinematics of these patients, and not
to evaluate the HANDS therapy, we did not feel that the
inclusion of patients from the HANDS trial would affect,
or bias, our findings. To be recruited into this study,
patients had to meet the following inclusion criteria: (1)
the time since stroke onset w as longer than 150 days;
(2) the patient had no cognitive deficits; (3) there was
no pain in the paretic upper extremity; (4) the passive
extension range of motion was greater than 0 degrees in
the affect ed wrist and -10 degrees at the metacarpopha-
langeal (MP) joints. In the patients recruited into the
study it was confirmed through outpatient consultation
before admission that there were no detectable motor
Osu et al. Journal of NeuroEngineering and Rehabilitation 2011, 8:62
/>Page 2 of 14
improvements in the last month. The three additional
patients (P14, P15, P16) who particip ated in Experiment
2 were outpatients recruited through the Tokyo Bay
Rehabilitation Hospital. These three patients also met
the above inclusion criteria. Nine right-handed healthy
volunteers free of orthopedic or neurological disorders
were also recruited into the study. One of these volun-
teers participated in the Experiment 1 (H1, a 38-ye ar-
old female), The other eight (H2-H8, aged from 23 to
62, four male and four female) participated in Experi-
ment 2. The purpose of the study was explained to all
of the participants and informed consent w as obtained
from all participants. The study was approved by the
institutional ethics committee.
Tasks
In Experiment 1, the patients were asked to grasp a
plastic glass with the hand of the affected side. The
patients were then asked to move t he glass from the lap
to the mouth and back to the lap repeatedly for 30 s at
a comfortable speed using the shoulder, elbow and wrist
joints. The position of the glass was measured with a
sampling rate o f 200 Hz using an OPTOTRAK Certus
(see APPENDIX). The measurements were performed
twice. The initial measurement was just after admi ssion
and the final measurement was just before discharge.
The period between the initial and final measurements
was approximately 3 weeks. The healthy participant’s
left arm moveme nt (H1) was also measured twice in the
same manner as the stroke patients. In Experiment 2,
the participants were asked to execute movements in
the three different patterns. In the first pattern, the
movements were executed continuously at a comfortable
speed as in Experiment 1 (comfortable condition). In the
second pattern, the movements were executed continu-
ously at maximum speed (fast condition). In the third
pattern, the movements were executed slowly (slow con-
dition). The eight healthy participants were asked to
move either th eir left or right arm. The three patients
were first asked to move the u naffected arm and then
asked to move the affected arm. Thus in the analysis,
we treated the unaffected side movement of the three
patients as healthy arm da ta. Consequently, we acquired
data from 11 unaffected arms (mean 53.5 years; SD 14.1
years) age matche d with the paretic arms participated in
Experiment 1 and the left arm (from 5 participants) and
right arm (from 6 participants) were counterbalanced
among participants. Three of the healthy participants
(H2, H3, H4) worked in the rehabilitation profession (as
an occupational therapist, physiotherapist and rehabilita-
tion doctor) and these partic ipants were also asked to
mimic the movement of stroke patients (mimic condi-
tion). The position measurement was carried out in the
same way as in Experiment 1.
Clinical assessments
For Experiment 1, the patients movement was assessed
using a number of tests: the SIAS upper e xtremity
motor function assessment, the upper extremity subsec-
tion of the Fugl-Meyer Assessment, and the modified
Ashworth scale (MAS) at elbow joint. These tests were
performed at the time of admission and discharge by
two board-certified physiatrists, who were independent
of and blinded to the study. The SIAS motor function
assessment has been shown to strongly correlate with
both the Motricity Index and Brunnstrom st age [6]. The
SIAS upper extremity motor function assessment has
two components: 1) the Knee-Mouth t est, which evalu-
ates proximal function, and 2) the Finger test that evalu-
ates individual finger movements. In this study, we
focused on the Knee-Mouth test because reaching
movements mainly involve the proximal joints (see
APPENDIX). The Knee-Mouth test is rated fr om 0 to 5,
with 0 indicating complete paralysi s and 5 indicating no
paralysis. T he scores 3, 4, and 5 are rated according to
the observed smoothness in the movement trajectory
(severe or moderate clumsiness rating a score of 3, mild
clumsiness rating 4, and smoothness comparable to the
unaffected side rating 5). The differences among scores
1, 2 and 3 reside in the patient’s ability to raise their
arm to a particular height (up to mouth for 3, up to
nipple for 2, lower than the nipple for 1), irrespect ive of
the smoothness of the movement trajectory. Within the
upper extremity subscale of Fugl-Meyer Assessment, the
total score of the following sub-items were used in this
study (FMA-UE); flexor synergy, extensor synergy,
movement combining synergies, movement out of
synergy, wrist, and hand. The total possible score for
this test was 54.
Analysis
The acquired position data was digitally low pass filtered
(with a Butterworth filter) with a cut off frequency of 8
Hz since a movement fluctuation higher than 8 Hz may
be caused by other factors such as tremor. For the ana-
lysis, we used the portion of the position data where the
movement pattern was relatively stable and did not
include measurement error (missing data caused by
occlusion of the marker from the camera because of the
unexpected pronation of several patients), which was 15
s for Experiment 1 and 25 s for Experiment 2. The posi-
tion data was then rotated so that the main movement
direction (from table to mouth) corresponded to the x-
axis. Velocity and acceleration was computed by two
point numerical differentiation.
Curvature and MedianLC (median of -log of curvature)
The three-dimensional instantaneous curvature at each
time point was computed based on the following equa-
tion.
Osu et al. Journal of NeuroEngineering and Rehabilitation 2011, 8:62
/>Page 3 of 14
κ
2
=
1
ρ
2
=
˙
x
2
+
˙
y
2
+ ˙z
2
¨
x
2
+
¨
y
2
+ ¨z
2
−
˙
x
¨
x +
˙
y
¨
y + ˙z¨z
2
˙
x
2
+
˙
y
2
+ ˙z
2
3
(1)
Because the distribution of instantaneous curvature is
skewed, we computed the -log of the curvature (-log()).
Next, the -log() at the time point when the movement
speed (tangential velocity) exceeds 50 mm/s was
extracted. The median -log()atallextractedtime
points was computed as a representative of that trajec-
tory, and designated MedianLC.
Jerk and MedianLJ (median of log of jerk)
Jerk a t each time point was computed acc ording to the
following equation,
J =
x
2
+
y
2
+
z
2
1
2
(2)
Because the distribution of jerk is skewed, we took the
log of the jerk (log(J)). The median of log(J) was com-
puted as a representative of that trajectory, which was
designated MedianLJ. T he portion of movement was
extracted using the same threshold of 50 mm/s in
movement speed (tangential velocity) as in MedianLC
when computing median of the distribution.
Mean squared jerk ratio (MSJ ratio)
We computed the MSJ ratio, which is the mean squared
jerk normalized by its minimum value [27].
MSJ ratio =
MeanJ
2
MeanJ
2
0
MeanJ
2
=
1
d
t
f
t
0
J
2
MeanJ
2
0
=
360A
2
d
6
(3)
where A denotes movement amplitude and d denotes
movement duration.
Assuming that discrete movements were concatenated,
each discrete movement segmentthatincludesasingle
stroke was identified from contin uous movement data,
with a threshold of 10% of the maximum speed of those
data. The movement duration and amplitude of each
segment was computed f or normalization. The log of
the MSJ ratio was averaged across segments for each
participant. The portions where segmentation was not
successful (suc h as a segment with an amplitude smaller
than 0.1 m) were excluded from analysis. The average
number of extracted movement se gments across partici-
pants was 8.15 ± 2.97. Since we could not successfully
segment the movement of patient 4 because his move-
ments w ere continuous, we excluded this patient’sdata
from this analysis.
Statistics
For correlation analysis, Spearman’s ranked correlation
coefficient was applied. For the comparison among
groups, a Kruskal-Wallis test was appl ied. Consistency
and reliability of the measure was assessed by intraclass
correlation coefficient (ICC).
Results
Clinical characteristics of the patients involved in the
study
Patient clinical characteristics are described in Table 1.
The average age of t he patients in Experiment 1 was
53.7 ± 15.0 years (range: 26 - 72 years). The median
SIAS Knee-Mouth test score at admission was 3, with a
range from 2 to 4 (Table 2). Patients with a score of 0
or 1 were not included. Although the HANDS therapy
targeted improvement o f finger function, patients 3, 4
and 5 showed an improvement in the SIAS Knee-Mouth
test score, whereby their score improved from 2 to 3
during hospitalization [9]. This means that these
patients were no t able to touch the mouth at admission,
but were able to at discharge. The median of SIAS
Knee-Mouth test score at discharge was 3.
Characteristics of hand path movement
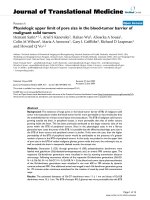
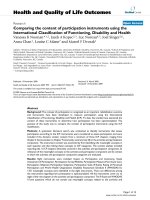
Figure 1 shows the initial measurements for hand path,
speed, curvature and jerk movement in the patients with
a SIAS score of 2, 3, and 4, and in the healthy partici-
pant H1 respectively. T he hand path and speed profiles
demonstrated decreased irregularity as the SIAS score
increased. When focusing on the curvature around its
smaller value (zoomed c urvature), the difference was
conspicuous since the curvature dropped to a very small
value and remained less than 0.005 (1/mm) in the
healthy volunteer (H1), but tended to fluctuate in the
stroke patients. Especially for those patients who had
lower SIAS scores (e.g., patients who scored 2 or 3), the
curvature remained high even in the middle of the
movement. However, jerk was not consistent across the
SIAS scores. This is probab ly because jerk increases not
only with movement irregularity but also with move-
ment speed, suggesting the necessity of normalization.
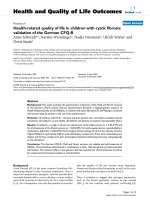
Distribution of the -log() and log(J)
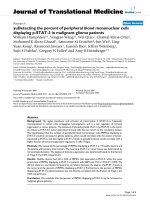
The upper panels of Figure 2 sh ow the -log()during
the movement for the participants with a SIAS score of
2, 3, and 4 and the healthy participant H1 (those
described in Figure 1). As the SIAS score increased, the
median of the -log() (MedianLC; vertical dashed line)
shifted to the right, suggesting that the number of the
data points with a lower curvature increased. In Experi-
ment 1, the MedianLC in the initial measurements was
significantly different in the three SIAS score groups
(Kruskal-Wallis test, p < 0.05), and post-hoc testing
Osu et al. Journal of NeuroEngineering and Rehabilitation 2011, 8:62
/>Page 4 of 14
revea led that the MedianLC of the SIAS 3 and 4 groups
was significantly higher than the MedianLC of the SIAS
2 group (Wilcoxon test, p < 0.05). The median of Med-
ianLC for the respective SIAS score groups was as fol-
lows: SIAS 2 group, 3.99 (five patients); SIAS 3 gro up,
4.81 (four patients); SIAS 4 group, 5.11 (four patients)
(Table 2). The MedianLC in the initial measurement for
the healthy participant, H1, was 5.74. However, as
shown in the lower panels of Figure 2, there was no sig-
nificant relationship between the MedianLJ and the
SIAS score. The Spearman ranked correlation coefficient
between the initial MedianLJ and the initial SIAS score
was -0.099 (p = 0.736) and that between the final Med-
ianLJ and the final SIAS score was -0.145 (p = 0.621).
Table 1 Patient Clinical Characteristics
Patient ID Age (years) Sex Affected side Days from onset Lesion type Lesion location
Experiment 1
P1 65 F R 780 CI corona radiata
P2 42 M R 4170 CI corona radiata
P3 72 M R 1800 CI MCA
P4 60 M L 1140 CI MCA
P5 60 M L 990 CI basal ganglia
P6 67 F R 2675 CH basal ganglia
P7 70 M R 210 CI medulla oblongata
P8 52 M L 2160 CI N/A
P9 26 M L 420 CH sub-cortical hematoma
P10 49 M R 360 CI N/A
P11 58 F R 612 CH thalamus
P12 26 M L 2700 CI MCA
P13 51 M R 315 CH basal ganglia
AVG/count 53.7 10M/3F 8R/5L 1410 9CI/4CH
(SD) (15.0) (1211)
Experiment 2
P14 67 F L 1110 CH thalamus
P15 58 M R 1418 CH thalamus
P16 72 M L 624 CI corona radiate
F, female; M, male; R, right; L, left; CI, cerebral infarction; CH, cerebral hemorrhage; AVG, average; SD, standard deviation; MCA, middle cerebral artery; N/A, not
available.
Table 2 Comparison between the MedianLC and log of MSJ ratio with other functional assessment scores
Initial measurement Final measurement
Patient ID SIAS K-M FMA-UE MAS elbow MLC LMSJR SIAS K-M FMA-UE MAS elbow MLC LMSJR
P1 2 15 1 4.36 11.13 2 19 0 4.41 10.08
P2 2 21 1+ 3.90 10.48 2 27 1 4.29 9.57
P3 2 22 1+ 3.68 7.52 3 30 1 4.13 8.49
P4 2 33 1 4.26 N/A 3 37 1 4.61 N/A
P5 2 30 1 3.99 10.47 3 39 1 3.71 10.69
P6 3 17 2 4.33 9.58 3 28 1 4.49 8.27
P7 3 32 1+ 5.11 7.66 3 45 1 4.66 9.46
P8 3 36 3 5.12 8.29 3 43 1+ 4.91 7.58
P9 3 31 1 4.50 8.48 3 35 0 5.06 7.48
P10 4 N/A N/A 5.10 7.20 4 N/A N/A 4.93 7.93
P11 4 50 2 4.73 8.03 4 50 1+ 4.63 8.52
P12 4 48 1 5.57 6.02 4 52 0 5.54 5.43
P13 4 51 1 5.11 5.73 4 53 0 5.21 5.86
H1 (5) (54) (0) 5.74 6.37 (5) (54) (0) 5.80 5.69
SIAS K-M, Stroke Impairment Assessment Set Knee-Mouth test; FMAUE, Fugl Meyer Assessment of the upper extremity (where a total score of 54 points was
possible); MAS, modified Ashworth scale; MLC, medial of log of curvature (MedianLC); LMSJR, log of mean squared jerk ratio.
Osu et al. Journal of NeuroEngineering and Rehabilitation 2011, 8:62
/>Page 5 of 14
5 10
0
0.5
5 10
0
0.5
5 10
0
0.5
5 10
0
0.5
200 (mm)
0
5 10
0
5
5 10
0
5
5 10
0
5
5 10
0
5
5 10
0
0.02
0.04
5 10
0
0.02
0.04
5 10
0
0.02
0.04
5 10
0
0.02
0.04
P5
(SIAS 2)
P9
(SIAS 3)
P10
(SIAS 4)
H1
(SIAS 5)
Time
(
s
)
Time
(
s
)
Time
(
s
)
Time
(
s
)
Path (mm)
Speed (m/s)
Curvature
(1/mm)
Z
oome
d
Curvature
(1/mm)
ABCD
EFGH
IJKL
MNOP
5 10
0
50
5 10
0
50
5 10
0
50
5 10
0
50
Jerk (m/s
3
)
QRST
Figure 1 Hand paths, including the speed, curvature, and jerk profiles were evaluated in four representative participants. Panels A, B, C
and D show the respective hand paths. The hand path is projected on a plane composed of the first principal component (main movement
direction: left to right correspond to table to mouth) and the second principal component (lower side in general corresponds to being proximal
while upper corresponds to being distal from the body). Panels E, F, G, and H show speed (tangential velocity); panels I, J, K, and L show
curvature profiles for the patients with SIAS scores of 2 (patient P5), 3 (patient P9), 4 (patient P10), and the healthy volunteer (H1), respectively.
Panels M, N, O, and P show the same curvature profiles as in panels I, J, K, and L, but are zoomed around the low curvature values between 0
and 0.05 (1/mm). Panels Q, R, S, T show the jerk profiles computed by Equation (2).
Osu et al. Journal of NeuroEngineering and Rehabilitation 2011, 8:62
/>Page 6 of 14
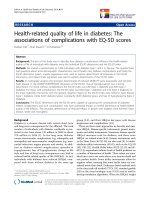
Correlation between the MedianLC, MSJ ratio and clinical
assessment scores
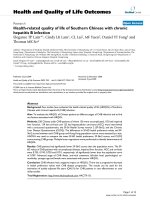
We analyz ed the correlation between the MedianLC and
clinical assessment scores in Experiment 1. Figure 3A
plots the MedianLC against the SIAS score and these
two variables were correlated. The Spearman ranked
correlation coefficient for the initial MedianLC and
SIAS was 0.842 ( p < 0.001; magenta circles), whereas
the correlation between the final MedianLC and SIAS
was 0.733 (p < 0.005; blue crosses). Figure 3B plots the
MedianLC against t he FMA-UE score and these two
variables were correlated. The Spearman ranked correla-
tion coefficient for the initial MedianLC and FMA-UE
was 0.753 (p < 0.005; magenta circles), whereas the cor-
relation between the final MedianLC and FMA-UE was
0.747 (p < 0.005; blue crosses).
Since the MedianLJ was not correlated with the SIAS
score , we computed the MSJ ratio, which represents the
jerk normalized with the minimum possible jerk of the
corresponding movement amplitude and duration
(Table 2). Figure 3C plots the log of MSJ ratio against
the SIAS scores. The Spearman ranked correlation
coefficient between the initial log of the MSJ r atio and
the SIAS was -0.769 (p < 0.005 ; magenta circles), while
the correlation between the final measurements was -0.7
(p < 0.01; blue crosses). Figure 3D plots the log of the
MSJ ratio against the FMA-UE scores. The Spearman
ranked correlation coefficient between the initial log of
the MSJ ratio and the FMA-UE was -0.797 (p <0.005;
magenta circles ), while the correlation between the final
measurements was -0.643 (p < 0.05; blue crosses).
Neither the MedianLC nor the log of the MSJ ratio
significantly correlated with the MAS elbow scores,
suggesting that these variables do not represent the
spasticity at elbow joint. We then compared the Med-
ianLC with the log of the MSJ ratio. The Spearman
ranked correlation coefficient between the MedianLC
and the log of the MSJ ratio was -0.659(p < 0.05) for
the initial measurements and -0.895 (p < 0.0001) for
the final measurements. The significant correlation
between these variables demonstrates that in stroke
patients the spatial smoothness, represented by Med-
ianLC, is related to temporal smoothness, represented
by jerk.
00 00
2 4 6 8
0
20
40
2 4 6 8
0
20
40
2 4 6 8
0
20
40
2 4 6 8
0
20
40
P5
(SIAS 2)
P9
(SIAS 3)
P10
(SIAS 4)
H1
(SIAS 5)
Percentage o
f
Data Points
(%)
-log(g) -log(g)-log(g)-log(g)
AB
C
D
8 10 12
20
40
8 10 12
20
40
8 10 12
20
40
8 10 12
20
40
log(J) log(J)log(J)log(J)
EFGH
median
Figure 2 Histograms demonstrating the -log() and log(J). Panels A, B, C, and D show the -log() expressed as a percentage of data points
in the extracted movement strokes for patients with SIAS scores of 2 (patient P5), 3 (patient P9), 4 (patient P10), and a healthy volunteer (H1),
respectively. The vertical dashed lines denote the median of the distribution. Panels E, F, G and H show the log(J) as described above.
Osu et al. Journal of NeuroEngineering and Rehabilitation 2011, 8:62
/>Page 7 of 14
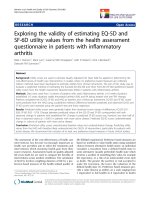
Experiment 2: Distribution of the -log() and MSJ ratio for
different movement patterns
Figure 4 shows the speed, jerk, curvature and distribu-
tion of the -log() for each movement pattern in a typi-
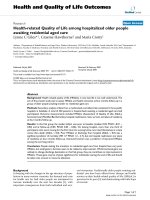
cal healthy participan t. Figure 5A shows the boxplots of
the MedianLC denoting m edian and quartile points for
each movement pattern. The solid red, blue and green
thick line represents the median of MedianLC for SIAS
scores 2, 3 and 4 (includi ng both initial and final mea-
surements in Experiment 1), respectively. Although on
average there was a 69.5% decrease (SD 13.4%) in peak
speed from the fast condition to slow condition (fast
condition: mean ± SD of peak speed = 2.72 ± 0.59 m/s;
slow condition: 0.82 ± 0.40 m/s), on average the
decrease in MedianLC was 5.9% (SD 3.3%). Within
these three movement patterns from eleven healthy
arms, we observed a correlation between the MedianLC
and peak movement speed. However, MedianLC o f
these three movement patterns from healthy arms was
significantly different from that of SIAS score of 4 (Wil-
coxon rank sum test, p < 0.0001). That is, even when
the movement speed was different, we were able to
2 3 4 5
4
5
6
20 30 40 50
4
5
6
2 3 4 5
6
8
10
12
20 30 40 50
6
8
10
12
inital score
fin
a
l
sco
r
e
SIAS score
Median of -log(g) (MedianLC)
SIAS score
log of MSJ ratio
FMA upper extremity
FMA upper extremity
Median of -log(g) (MedianLC)
log of MSJ ratio
A
B
CD
Figure 3 The relationship between the MedianLC or the MSJ ratio and the different clinical assessment scores. Magenta circles denote
initial measurements while blue crosses denote the final measurements for the 13 patients and the healthy volunteer, H1, who participated in
Experiment 1. Panel A plots the MedianLC against the SIAS scores. Panel B plots the MedianLC against the FMA-UE (where a total score of 54
points was possible). Panel C plots the log of MSJ ratio against the SIAS scores. Panel D plots the log of the MSJ ratio against FMA-UE. The
dashed line shows the linear fitting of the data represented by the magenta circles and blue crosses.
Osu et al. Journal of NeuroEngineering and Rehabilitation 2011, 8:62
/>Page 8 of 14
differentiate paretic movements from healthy move-
ments through the MedianLC. Thus, the MedianLC
appear s to be useful for comparing between normal and
irregular movements.
We also examined the sensitivity of the log of MSJ
ratio with respect to the movement pattern and speed.
Figure 5B shows the boxplots of the log o f MSJ ratio
denoting median and quartile points for each healthy
movement pattern, and median of patient movement for
each SIAS score (colored solid lines, see Figure 5A for
detail). The log of the MSJ r atio of healthy movements
overlapped with that of affected movement, and was not
significantly different from that of SIAS score 4. There-
fore, it is difficult to differentiate paretic arm movement
from healthy movement using the jerk metric if the
movement speed is different.
The magenta triangle plots the MedianLC and the log
of the MSJ ratio of movement when the healthy partici-
pants from the rehabilitation profession mimic the
movements of patients affected by stroke. Interestingly,
two of the three participants decreased MedianLC to
the value comparable to that of SIAS 3 movemen t, sug-
gesting that they accurately captured the characteristics
of movement with a paretic arm. The log of MSJ ratio
of these movements was comparable with the value of
healthy slow movements.
Figure 5C plots the MedianLC against the log of the
MSJ ratio. Although a correlation between the Med-
ianLC and the log of MSJ ratio was observed for the
healthy participants (the Spearman ranked correlation
coefficients of 0.784, p < 0.0001), the slope was signifi-
cantly different when comparing movements f rom the
Jerk (m/s
3
) Speed (m/s)
Z
oome
d
Curvature
(1/mm)
Percentage of
Data Points (%)
10
0
1
10
0
50
10
0
0.05
2 4 6
0
20
-log(g)
Time (s)
Pattern
1
(comfortable)
A
D
G
-
10
0
1
10
0
50
10
0
0.05
2 4 6
0
20
-log(g)
Time (s)
Pattern 2
(fast)
B
E
H
K
10
0
1
10
0
50
10
0
0.05
2 4 6
0
20
-log(g)
Time (s)
Pattern 3
(slow)
C
F
I
L
median
Figure 4 Speed, jerk, curvature and -log() data for three different movement speeds from the healthy volunteer (H2). Panels A, B, and
C show the speed; panels D, E, and F show the jerk profile; panels G, H, and I show the zoomed curvature and panels J, K, and L the -log().
See Figures 1 and 2 for details.
Osu et al. Journal of NeuroEngineering and Rehabilitation 2011, 8:62
/>Page 9 of 14
Exp.1 SIAS 2
5 6 7 8 9 10 11 12 13
4
5
6
lo
g
of MSJ ratio
Median o
f
-log
(
g
)
(
MedianL
C)
Median of -log(g) (MedianLC)
log of MSJ ratio
A
B
C
H2,H3,H4 (mimic)
Exp.2 P14 (SIAS 2)
affected side
Exp.2 P15 (SIAS 4)
affected side
Exp.2 P16 (SIAS 4)
affected side
Exp.2 Healthy
(including unaffecte
d
side of P14, 15, 16)
Exp.1 SIAS 4
Exp.1 SIAS 3
comfort-
able
fast slow mimic comfort-
able
fast slow mimic
SIAS 2
SIAS 3
SIAS 4
SIAS 2
SIAS 3
SIAS 4
4
5
6
5
6
7
8
9
10
11
12
Figure 5 Comparison between the MedianLC and the log of the MSJ ratio across different movement speeds and SIAS scores.The
boxplots in panels A and B show the median (central marks), the quartiles (edges of the boxes), and the most extreme data points (whiskers) of
the MedianLC (Panel A), or the log of MSJ ratio (Panel B) from three different movement speeds (fast, comfortable, and slow) for 11 healthy arm
(including three unaffected arm of patients 14, 15, and 16). Magenta diamonds in panels A and B denotes the MedianLC or the log of MSJ ratio
from mimicking movements for three healthy participants. Red, blue, and green thick and dotted lines in panels A and B denotes median (thick
lines) and quartile (dotted lines) of MedianL from both initial and final measurements in Experiment 1 whose SIAS scores were 2, 3, and 4,
respectively. Panel C plots the log of the MSJ ratio against the MedianLC. Magenta triangles denote data from three different movement speeds
for 11 healthy arms. Red, blue, and green open circles denote data from initial and final measurements in Experiment 1 where the SIAS scores
were 2, 3, and 4. The red filled triangles, green filled circles and green filled squares denote data from three movement speeds for the affected
arm of P14 (SIAS score 2), P15 (SIAS score 4), and P16 (SIAS score 4) respectively. The dash dot line shows linear fitting of the data represented
by the magenta triangles. The dashed line shows linear fitting of the data represented by the open circles.
Osu et al. Journal of NeuroEngineering and Rehabilitation 2011, 8:62
/>Page 10 of 14
healthy participants and the s troke patients (p < 0.001).
The filled triangles, circles, and squares denote the Med-
ianLC against the log of the MSJ ratio for three move-
ment patterns from affected side of P14, P15, and P16.
The MedianLC of movements from patients who scored
4 on the SIAS scale did not differ much among the
three movement patterns, as observed in healthy m ove-
ments, although the log of the MSJ ratio did differ con-
siderably among the movement patterns. However, the
MedianLC associated with movement that scored 2 on
the SIAS scale, did differ with respect to the different
movement patterns, and tended to decrease alongside
an increase in speed and a decrease in the MSJ ratio.
Consistency and reliability of the MedianLC
Using the data fro m Experiment 1, the consist ency and
reliability of the MedianLC was assessed using an intra-
class correlation coef ficient (ICC). To examine consis-
tency within a session, we separated the 15 s data into
two 7.5 s components and computed the MedianLC for
each component for each participant. We then com-
puted the ICC of the MedianLC between the first half
and second half of the measurement. The ICC was
0.949 for the initial measurements and 0.948 for the
final measurement, suggesting the MedianLC is highly
consistent within a measurement. To confirm the relia-
bility across the sessions, we c ompared the MedianLC
between the initial and final measurements (incl uding in
the healthy participant, H1), assuming that the same
measure ments were repeated under the same conditions
for each patient. The ICC was 0.881, which is relatively
high. Given that the HANDS therapy (undertaken
between the initial and final measurements) led to a
change in the SIAS score in three patients, the reliability
of the current analysis must be considered to be limited.
Discussion
In this study, we developed a spatial smoothness mea-
sure based on three-dimensional curvature to evaluate
movement irregularities in the affected arm of stroke
patients. This measure was then compared wit h clinical
assessment scores and with a previously developed mea-
sure of smoothness, the MSJ ratio. The measure we
developed in this study assessed the median of the nat-
ural log of curvature (MedianLC) in the end-point tra-
jectory during three-dimensional reaching. By utilizing
this measure, we were able to verify that the SIAS Knee-
Mouthtest(SIASK-M),theclinicaltestusedtoevalu-
ate clumsiness of the paretic arm in stroke patients, is
consistent with the spatial smoothness represented b y
curvature. The preservation of spatial smoothness dur-
ing very slow movements in the healthy participant,
where temporal smoothness was destroyed, was in con-
trast with the degradation of spatial smoothness
coincident with the loss of temporal smoothness
observed in the stroke patients. The measure also corre-
lated with the upper extremity subscale of the Fugl
Meyer Assessment that is used to evaluate impairment
in stroke patients. Our results show that the MedianLC
is a possible tool for evaluating movement quality in the
paretic arm of stroke patients.
The MedianLC is not the first method to objectively
evaluate the irregularity of movement [17-2 0,34]. Pre-
vious studies have proposed a jerk-based measurement
because smoothness in movement is defined as the
smallest change in acceleration, which is the definition
of jerk [32-35]. Although curvature and jerk differ in the
sense that curvature quantifies spatial characteristics,
while jerk quantifies the temporal characteristics of tra-
jectory, we found a signific ant correlation between the
MedianLC and the MSJ ratio [27,28]. Since the move-
ments were three-dimensional and required the use of
multiple joints (where a greater degree of freedom was
allowed), it is reasonable to think that temporal devia-
tion affects spatial deviation and vice versa, and that
curvature tends to correlate with jerk. In contrast , the
slope was significantly different with respect to the
movement observed in the healthy participants and in
the stroke patients. For the movements observed in the
healthy participants, the MedianLC did not decrease
much even when MSJ ratio increased as the participants
decreased the speed of their movement. This finding
suggests that the quality of paretic movement may be
better differentiated b y spatial smoothness, represented
by curvature, than temporal smoothness, represented by
jerk, if the movement speed is uncontrollable. Although
in single case, we observed a coincident reduction of
spatial and temporal smoothness when movement speed
incr eased in a patient with a SIAS score of 2. This find-
ing was not observed in the two patients with a SIAS
score of 4. Further research is necessary to resolve the
relationship between severity of impairment, movement
speed and movement irregularity.
Spatial irregularity has previously been evaluated by
measuring the ratio of actual hand path and direct path
length (represented as an index of curvature, IOC)
[21-23]. The IOC measures the degree of deviation in
hand path in one whole movement segment. In contrast,
the metric described in this study quantifies instanta-
neous curvature at each time point. In the current data,
we did not find significant correlation between IOC
measure and Media nLC. This may pa rtly be because the
IOC cannot separate between hand paths characterized
by less meandering than those with more meandering if
the path length of the two is the same.
An advantage of the MedianLC over a jerk-type mea-
sure or IOC is that movement segmentation is not
required. As a jerk measure has to be normalized with
Osu et al. Journal of NeuroEngineering and Rehabilitation 2011, 8:62
/>Page 11 of 14
respect to both duration and amplitude of each segment
of the movement, it is very important to identify each
segment that includes a single stroke. The IOC measure
also requires the direct path length of each segment.
However, for patients, it is often difficult to clearly iden-
tify the timing of movement initiation and termination
because of the irregularity of the movement [29]. There-
fore, MedianLC is advantageous for the analysis of pare-
tic arm movements.
The reliability of the MedianLC was confirmed by cal-
culating the ICC between the two measurements, at
approximately 2 weeks apart, although the reliability of
the result is limited by the intervention between the two
measurements. Consistency within a measurement was
also assessed by the high ICC between the first and the
second7.5sblockofdataineachmeasurement.How-
ever, in some patients we observed a difference in the
MedianLC between the first half and the second half
(mean ± SD of the difference was 0.14 ± 0.13). Since the
15 s data was halv ed without accounting for movement
segments, an incomplete segment may h ave caused mea-
surement noise. To acquire a more consistent MedianLC,
a longer analysis time w indow would be preferable. On
the other hand, there is the possibility that the patients’
performance itself might have actually changed during a
measurement. For instance some patients showed an
increased MedianLC in the second half, suggesting the
possibility of practice effect, while some others had a
reduced MedianLC, possibly because the patie nts were
tired or their movements became more spastic. The
MedianLC is most reliable when the movement is consis-
tent throughout a measurement and there is a long
enough duration for analysis (15 s or more). However,
for patients a shorter measurement period is preferable,
and the shortest minimum duration that gives the most
reliable values must be taken into account when transfer-
ring this type of metric to the clinic.
The relationship between the MedianLC and the clini-
cal observation of clumsine ss was assessed by determin-
ing the correlation between the MedianLC and SIAS K-
M. These two variables highly related. The initial Med-
ianLC was correlated with the initial SIAS K-M and the
final MedianLC was correlated with the final SIAS K-M.
Five out of three patients with a SIAS score of 2 at
admission improved to a SIAS score of 3 at discharge
[9]. However, the MedianLC value did not increase sig-
nificantly in these patients and their MedianLC at dis-
charge was 4.13, 4.61, and 3.71, respectively, which was
smaller than the average MedianLC of the SIAS 3 group
at initial m easurement (MedianLC value of 4.76). This
may be because the transition from SIAS 2 to SIAS 3 is
not based on smoothness, but on the ability to reach
the hand high enough, and the improvement in spatial
smoothness was not in parallel with the promotion to
the SIAS score of 3 from 2. The correlation between
MedianLC and the clinical assessment of FMA-UE, on
the other hand, demonstrates that the movements with
less spatial irregularity result in better upper extr emity
function. Therefore, MedianLC represents a useful indi-
cator of the functional recovery in the upper extremity.
Even within the group with the same SIAS K-M score,
some variability of the MedianLC was observed. Because
the ICC across measurements was relatively high, the
MedianLC may be a finer scale of movement irregulari-
ties than the expert rating. Also, given that MedianLC
does not require an expert’s observation, if the measure-
ment system were to be made portable and easy to use,
it could be used as a self-training system feedback
mechanism available to patients for daily rehabilitation.
Patients could learn smoother movements by trying to
increase the score in the movement training.
Computationally, smooth ness has been discussed as a
candidate objective function that should be optimized at
the trajectory plann ing level. In contrast, the mechanism
that increases curvature in stroke patien ts would not be
limited to the degradation in trajectory planning. Degra-
dation in the internal model [38,39], distortion in the
feedback including sensory deficits, a reduction in
motor command [40], or an increase in motor com-
mand noise, can lead to an increase in curvature. Any
inappropriate increase in mechanical impairments due
to spasticity or an increase in tone may also cause
movement irregularities. In the present study, we did
not find a significant relationship between the Med-
ianLC and the modified Ashworth scale (Table 2). It is
poss ible that the variation in the MedianL C within each
SIAS score group was due to the level of spasticity;
however, further investigation is required to fully inves-
tigate these issues.
Conclusions
In this study we developed a measure of spatial smooth-
ness based on three-dimensional curvature that was effec-
tive in evaluating movement irregularities in the aff ected
arm of stroke patients. The mea sure presented in this
report assesses the median of the natural log and was
comparable to an examiner’s observation, as well as to a
cli nical assessment of functional recovery. The results of
this study suggest that the quality of paretic movement is
characterized through spatial smooth ness represented by
curvature. The smaller computational cost involved in
acquiring this measurement suggests that this method
may be use a useful tool in clinical settings.
Appendix
The Stroke Impairment Assessment Set (SIAS)
The SIAS is a comprehensive instrument used to assess
stroke impairment, which provides information on
Osu et al. Journal of NeuroEngineering and Rehabilitation 2011, 8:62
/>Page 12 of 14
motor function, tone, sensory function, range of motion,
pain, trunk function, visuo-spatial function, speech and
sound side function. The SIAS test can also be used to
separately assess the proximal and distal upper extre-
mity motor function.
Proximal Upper Extremity motor function test (Knee-Mouth
test)
The application of the SIAS test to measure upper
extremity function can be performed as follows. In the
sitting position, the patient touches the contralateral
knee with the affected hand and then lifts the hand to
the mouth. When the hand reaches the mouth, the
affected-side shoulder is abducted to 90 degrees. Then,
the hand is returned to the knee. The test is performed
three times. If contracture of the shoulder or elbow is
present, the test is judged on the basis o f movement
within the range of motion. The score is based on the
following criteria:
0 = There is no contraction of biceps brachii.
1 = Minimal voluntary movement is note d, but the
patient cannot raise the hand to the level of the nipple.
2 = Synergic movement is noted in the shoulder and
elbow joints, but t he patient is not able to touch the
mouth with the affected-side hand.
3 = The patient carries out the task with severe or
moderate clumsiness.
4 = The patient carries out the task with mild
clumsiness.
5 = The patient carries out the task as smoothly as on
the unaffected side.
Motion capture system
OPTOTRAK Certus is a motion capture system that can
acquire high-frequency three-dimensional position data
with an accuracy of up to 0.1 mm and resolution of
0.01 mm. From the LED marker attached to the glass,
infrared light was emitted, which was detected by three
cameras.
Acknowledgements
We thank Drs Maiko Osada, Daisuke Matsuura, Mari Ito, Kaoru Honaga,
Takamichi Tohyama and Kotaro Takeda for help with clinical measurements.
This work was supported by the Strategic Information and Communications
R&D Promotion Program, Ministry of Internal Affairs and Communications,
Japan; the Strategic Research Program for Brain Sciences, Ministry of
Education, Culture, Sports, Science and Technology, Japan and the Funding
Program for Next Generation World-Leading Researchers, Japan.
Author details
1
Computational Neuroscience Laboratories, Advanced Telecommunications
Research Institute International (ATR), Kyoto, Japan.
2
Department of
Rehabilitation Medicine, Keio University School of Medicine, Tokyo, Japan.
3
Department of Rehabilitation Medicine, Tokyo Bay Rehabilitation Hospital,
Narashino, Japan.
Authors’ contributions
RO performed analysis of data and drafting of the manuscript. KO performed
the design of the experiments and executed experiments. TF made
substantial contribution to acquisition of the data and recruitment of the
patients. YO, MK, and ML were involved in the interpretation of the results
and critical revision of the manuscript. All authors read and approved the
final manuscript.
Competing interests
The authors declare that they have no competing interests.
Received: 5 April 2011 Accepted: 31 October 2011
Published: 31 October 2011
References
1. Brunnstrom S: Movement therapy in hemiplegia; a neurophysiological
approach New York: Harper & Row; 1970.
2. Demeurisse G, Demol O, Robaye E: Motor evaluation in vascular
hemiplegia. Eur Neurol 1980, 19:382-389.
3. Fugl-Meyer AR, Jaasko L, Leyman I, Olsson S, Steglind S: The post-stroke
hemiplegic patient. 1. a method for evaluation of physical performance.
Scand J Rehabil Med 1975, 7:13-31.
4. Chino N, Sonoda S, Domen K, Saitoh E, Kimura A: Stroke impairment
assessment set (SIAS): a new evaluation instrument for stroke patients.
Jpn J Rehabil Med 1994, 31:119-125.
5. Chino N, Sonoda S, Domen K, Saitoh E, Kimura A: Stroke impairment
assessment set (SIAS). In Functional evaluation of stroke patients. Edited by:
Chino N, Melvin JL. Tokyo: Springer-Verlag; 1995:19-31.
6. Liu M, Chino N, Tuji T, Masakado Y, Hase K, Kimura A: Psychometric
properties of the Stroke Impairment Assessment Set (SIAS). Neurorehabil
Neural Repair 2002, 16:339-351.
7. Wolf SL, Lecraw DE, Barton LA, Jann BB: Forced use of hemiplegic upper
extremities to reverse the effect of learned nonuse among chronic
stroke and head-injured patients. Exp Neurol 1989, 104:125-132.
8. Wolf SL, Winstein CJ, Miller JP, Taub E, Uswatte G, Morris D, Giuliani C,
Light KE, Nichols-Larsen D: Effect of constraint-induced movement
therapy on upper extremity function 3 to 9 months after stroke: the
EXCITE randomized clinical trial. Jama 2006, 296:2095-2104.
9. Fujiwara T, Kasashima Y, Honaga K, Muraoka Y, Tsuji T, Osu R, Hase K,
Masakado Y, Liu M: Motor improvement and corticospinal modulation
induced by hybrid assistive neuromuscular dynamic stimulation
(HANDS) therapy in patients with chronic stroke. Neurorehabil Neural
Repair 2009, 23:125-132.
10. Fujiwara T, Liu M, Hase K, Tanaka N, Hara Y: Electrophysiological and
clinical assessment of a simple wrist-hand splint for patients with
chronic spastic hemiparesis secondary to stroke. Electromyogr Clin
Neurophysiol 2004, 44:423-429.
11. Han CE, Arbib MA, Schweighofer N: Stroke rehabilitation reaches a
threshold. PLoS Comput Biol 2008, 4:e1000133.
12. Hingtgen B, McGuire JR, Wang M, Harris GF: An upper extremity kinematic
model for evaluation of hemiparetic stroke. J Biomech 2006, 39:681-688.
13. Cirstea MC, Mitnitski AB, Feldman AG, Levin MF: Interjoint coordination
dynamics during reaching in stroke. Exp Brain Res 2003, 151:289-300.
14. Mutsaarts M, Steenbergen B, Meulenbroek R: A detailed analysis of the
planning and execution of prehension movements by three adolescents
with spastic hemiparesis due to cerebral palsy. Exp Brain Res 2004,
156:293-304.
15. Lang CE, Beebe JA: Relating
movement control at 9 upper extremity
segments to loss of hand function in people with chronic hemiparesis.
Neurorehabil Neural Repair 2007, 21:279-291.
16. Wagner JM, Rhodes JA, Patten C: Reproducibility and minimal detectable
change of three-dimensional kinematic analysis of reaching tasks in
people with hemiparesis after stroke. Phys Ther 2008, 88:652-663.
17. Platz T, Denzler P, Kaden B, Mauritz KH: Motor learning after recovery
from hemiparesis. Neuropsychologia 1994, 32:1209-1223.
18. Trombly CA: Observations of improvement of reaching in five subjects
with left hemiparesis. J Neurol Neurosurg Psychiatry 1993, 56:40-45.
19. Kahn LE, Zygman ML, Rymer WZ, Reinkensmeyer DJ: Effect of robot-
assisted and unassited exercise on functional reaching in chronic
hemiparesis. 23rd Annual International Conference of the IEEE Engineering in
Medicine and Biology Society; Istanbul, Turkey 2001.
20. Cirstea MC, Levin MF: Compensatory strategies for reaching in stroke.
Brain 2000, 123(Pt 5):940-953.
Osu et al. Journal of NeuroEngineering and Rehabilitation 2011, 8:62
/>Page 13 of 14
21. Richards L, Senesac C, McGuirk T, Woodbury M, Howland D, Davis S,
Patterson T: Response to intensive upper extremity therapy by
individuals with ataxia from stroke. Top Stroke Rehabil 2008, 15:262-271.
22. Woodbury ML, Howland DR, McGuirk TE, Davis SB, Senesac CR, Kautz S,
Richards LG: Effects of trunk restraint combined with intensive task
practice on poststroke upper extremity reach and function: a pilot
study. Neurorehabil Neural Repair 2009, 23:78-91.
23. Patterson TS, Bishop MD, McGuirk TE, Sethi A, Richards LG: Reliability of
upper extremity kinematics while performing different tasks in
individuals with stroke. J Mot Behav 2011, 43:121-130.
24. Flash T, Hogan N: The coordination of arm movements: an
experimentally confirmed mathematical model. J Neurosci 1985,
5:1688-1703.
25. Nakano E, Imamizu H, Osu R, Uno Y, Gomi H, Yoshioka T, Kawato M:
Quantitative examinations of internal representations for arm trajectory
planning: minimum commanded torque change model. J Neurophysiol
1999, 81:2140-2155.
26. Uno Y, Kawato M, Suzuki R: Formation and control of optimal trajectory
in human multijoint arm movement. Minimum torque-change model.
Biol Cybern 1989, 61:89-101.
27. Hogan N, Sternad D: On rhythmic and discrete movements: reflections,
definitions and implications for motor control. Exp Brain Res 2007,
181:13-30.
28. Hogan N, Sternad D: Sensitivity of smoothness measures to movement
duration, amplitude, and arrests. J Mot Behav 2009, 41:529-534.
29. Krebs HI, Aisen ML, Volpe BT, Hogan N: Quantization of continuous arm
movements in humans with brain injury. Proc Natl Acad Sci USA 1999,
96:4645-4649.
30. Milner TE: A model for the generation of movements requiring endpoint
precision. Neuroscience 1992, 49:487-496.
31. Vallbo AB, Wessberg J: Organization of motor output in slow finger
movements in man. J Physiol 1993, 469:673-691.
32. Rohrer B, Fasoli S, Krebs HI, Hughes R, Volpe B, Frontera WR, Stein J,
Hogan N: Movement smoothness changes during stroke recovery. J
Neurosci 2002, 22:8297-8304.
33. Krebs HI, Hogan N, Aisen ML, Volpe BT: Robot-aided neurorehabilitation.
IEEE Trans Rehabil Eng 1998, 6:75-87.
34. Smith MA, Brandt J, Shadmehr R: Motor disorder in Huntington’s disease
begins as a dysfunction in error feedback control. Nature 2000,
403:544-549.
35. Cozens JA, Bhakta BB: Measuring movement irregularity in the upper
motor neurone syndrome using normalised average rectified jerk. J
Electromyogr Kinesiol 2003, 13:73-81.
36. Imamizu H, Uno Y, Kawato M: Internal representations of the motor
apparatus: implications from generalization in visuomotor learning. J Exp
Psychol Hum Percept Perform 1995, 21:1174-1198.
37. Pollick FE, Ishimura G: The three-dimensional curvature of straight-ahead
movements. Journal of Motor Behavior 1996, 28:271-279.
38. Kawato M: Internal models for motor control and trajectory planning.
Curr Opin Neurobiol 1999, 9:718-727.
39. Beer RF, Dewald JP, Rymer WZ: Deficits in the coordination of multijoint
arm movements in patients with hemiparesis: evidence for disturbed
control of limb dynamics. Exp Brain Res 2000, 131:305-319.
40. Wagner JM, Lang CE, Sahrmann SA, Hu Q, Bastian AJ, Edwards DF,
Dromerick AW: Relationships between sensorimotor impairments and
reaching deficits in acute hemiparesis. Neurorehabil Neural Repair 2006,
20:406-416.
doi:10.1186/1743-0003-8-62
Cite this article as: Osu et al.: Quantifying the quality of hand
movement in stroke patients through three-dimensional curvature.
Journal of NeuroEngineering and Rehabilitation 2011 8:62.
Submit your next manuscript to BioMed Central
and take full advantage of:
• Convenient online submission
• Thorough peer review
• No space constraints or color figure charges
• Immediate publication on acceptance
• Inclusion in PubMed, CAS, Scopus and Google Scholar
• Research which is freely available for redistribution
Submit your manuscript at
www.biomedcentral.com/submit
Osu et al. Journal of NeuroEngineering and Rehabilitation 2011, 8:62
/>Page 14 of 14