Báo cáo hóa học: " Optical Properties of GaSb Nanofibers" potx
Bạn đang xem bản rút gọn của tài liệu. Xem và tải ngay bản đầy đủ của tài liệu tại đây (906.66 KB, 6 trang )
NANO EXPRESS Open Access
Optical Properties of GaSb Nanofibers
Xiuli Zhou
1,2
, Wei Guo
3
, Alejandro G Perez-Bergquist
2
, Qiangmin Wei
2
, Yanbin Chen
2
, Kai Sun
2*
, Lumin Wang
2,4*
Abstract
Amorphous GaSb nanofibers were obtained by ion beam irradiation of bulk GaSb single-crystal wafers, resulting in
fibers with diameters of ~20 nm. The Raman spectra and photoluminescence (PL) of the ion irradiation-induced
nanofibers before and after annealing were studied. Results show that the Raman intensity of the GaSb LO phonon
mode decreased after ion beam irradiation as a result of the formation of the amorphous nanofibers. A new mode
is observed at ~155 cm
-1
both from the unan nealed and annealed GaSb nanofiber samples related to the A
1g
mode of Sb–Sb bond vibration. Room temperature PL measurements of the annealed nanofibers present a wide
feature band at ~1.4–1.6 eV. The room temperature PL properties of the irradiated samples presents a large blue
shift compared to bulk GaSb. Annealed nanofibers and annealed nanofibers with Au nanodots present two
different PL peaks (400 and 540 nm), both of which may originate from Ga or O vacancies in GaO. The enhanced
PL and new band characteristics in nanostructured GaSb suggest that the nanostructured fibers may have unique
applications in optoelectronic devices.
Introduction
III–V semiconductors are increasingly important for
electronic and optoelectronic devices due t o their high
electron mobility and direct bandgap. And nanostruc-
tured semiconductors have been attracting widespread
attention for their unique quantum-confined nanoscale
properties. In particular, the optical properties of nano-
scale semiconductors are seen as a key to the future of
optoelectronic device fabrication [1,2]. One material that
has received substantial attention in this field is gallium
antimonide (GaSb), a very attractive material system for
lasers, modulators and detectors because the fundamen-
tal gap of GaSb lies close to the 1.55 μm low attenua-
tion window of silica optical fibers. GaSb is also an ideal
substrate for some longer wavelength lasers and photo-
detectors [3-5], low-power-consumption electronic
devices [6], optoelectronic devices with varying wave-
lengths [7] and ord ered semiconductor quantum dots
[8]. For these reasons, it is necessary to c ontinue to
improve our understanding of GaSb and to get deep
understanding of its physical properties.
Some studies usin g ion ac celerators [9], low-energy-
focused Ga
+
ion beams (FIB) [10-12] and high-energy Au
+
and Kr
+
ion beams [13] have shown that ion irradiation of
GaSb under appropriate implantation conditions results
in the formation of porous surface structures. To date,
however, there has be en little investigation on the optical
characteristics of these porous materials after ion bom-
bardment and annealing [14 ,15]. In this communication,
we present the formation of nanofibers on the surface of
GaSb single crystals by low-energy-focused Ga
+
and high-
energy Au
+
and Kr
+
ion beam irradiation. And thermal
annealing was conducted to crystallize the GaSb nano-
fibers. We analyze the optical properties of the GaSb n ano-
fiber semiconductors by means of Raman scattering and
photoluminescence (PL). It shows that the substrate signal
of the GaSb LO mode appears at 237 cm
-1
, and the nanos-
tructured GaSb samples show peaks around ~155 cm
-1
,
which can be assigned to the A
1g
peak of crystalline Sb.
The visible room temperature PL spectru m of the an nealed
nanofibers demonstrates an increase in luminescent inten-
sity, and the low temperature (15 K) PL spectrum presents
two new PL peaks (400 and 540 nm) when compared to
bulk GaSb.
Experimental
GaSb single-crystal wafers with (100) orientation were
irradiated with a 30 keV focused Ga
+
ionbeamatroom
temperature. The evolution of the surface morphology
of GaSb was monitored in situ in an FEI Nova 200
Nanolab FIB/SEM dual beam system. Conventional
broad ion beam irradiation of GaSb using 150 keV Kr
+
* Correspondence: ;
2
Department of Materials Science and Engineering, University of Michigan,
48109 Ann Arbor, MI, USA.
Full list of author information is available at the end of the article
Zhou et al. Nanoscale Res Lett 2011, 6:6
/>© 2010 Zhou et al. This is an Open Acc ess article distributed under the terms of the Creative Common s Attribution License
(http://creative commons.org/licenses/by/2.0), which permits unrestricted use, distribution, and reproduction in any medium,
provided the origi nal work is properly cited.
ions (with a beam diameter of ~25 mm) and 1 MeV Au
+
ions was also conducted.
For the annealing study, parts of the irradiated sam-
ples were annealed at 250 and 350°C for 10 min in a
conventional open tube furnace. Irradiated samples, as
well as irradiated samples coated with Au thin film,
were annealed at 600°C for 10 min.
Raman scattering experiments were demonstrated in
backscattering geometry from the (100) sample surface at
room temperature using a 633 nm He–Ne laser as an exci-
tation source coupled to the commercial Raman spectro-
metry system. For III–V compound semiconductors of the
zinc-blende crystal structure, Raman spectra generally
show two peaks. The lower-frequency peak corresponds
to TO phonons, and the higher frequenc y peak corre-
sponds to LO pho nons. In backscattering, only LO pho-
nons appear in the (100) direction [16]. The laser output
power was fixed at 200 mW so as to avoid excess heating
of the s amples. The scattered light was analyzed using a
standard double-grating spectrometer in the photon-
counting mode, whose spectral resolution is better than
2cm
-1
. Room temperature PL characteristics of the GaSb
nanofibers and bulk GaSb were also obtained using th e
633 nm He–Ne laser. Low temperature PL characteristics
of the bulk GaSb, annealed GaSb nano fibers and GaSb
nano fibers coated with Au were conducted using a
325-nm He–Cd laser with output power 50 mW.
Results and Discussion
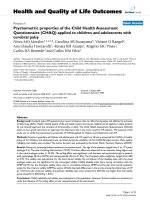
Figure 1a, b present in situ scanning electronic mic ro-
scope (SEM) images showing the morphology of GaSb
under 30 keV Ga
+
ion beam bombardment with inci-
den t ang les of 0° and 70°, respectively. Figure 1c, d pre-
sent SEM images showing the morphology of GaSb with
Kr
+
irradiation at 150 keV. It was found that the surface
quickly evolved into a high density network of uniformly
spaced GaSb nanofibers. Parts of the n anofibers were
connected together to form a flake-like structure. The
diameters of the relatively uniform nanofibers measured
by the SEM is ~20 nm (Figure 1a, b). Increasing the
irradiation time, which corresponds to an increa se in
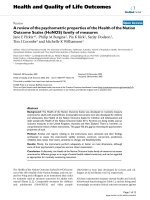
irradiation fluence, decreases the size of the nanofibers.
At low fluences, only small voids are formed, as shown
in Figure 2a. With continuous bombardment, these
voids coalesce and subsequently form fiber-like net-
works, as shown in Figure 2b. The formation of the
GaSb nanofibers can be attributed to the accumulation
of atomic damage created by energetic ions [13], with
redeposition, viscous flow, and curvature-dependent
sputtering also contributing to the morphological evolu-
tion of the fibers [17-20].
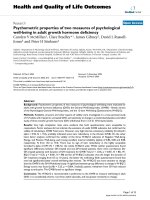
Figure3showsSEMandTEMimagesoftheGaSb
nanofibers formed with Au
+
ions irradiation aft er
annealing at 600°C for 10 min. The annealed fibers
exhibit a clear core–shell structure, as shown in
Figure 3b. Since oxidation occurs during the annealing
process, the composition of the shell layers is expected
to be some form of gallium oxide. Figure 3c, d show the
annealed, Au-coated GaSb fibers, which present Au
nanodots distributed on the surface of the nanofibers.
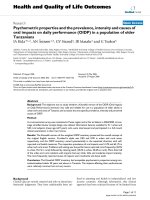
Figure 4a shows the room temperature Raman spec-
trum of the bulk GaSb wafer. A strong peak was found
at 237 cm
-1
and a weak peak at 230 cm
-1
, which are the
LO and TO modes, respectively. As mentioned above,
only the LO mode is allowed for (100) oriented material,
and the TO mode is forbidden [21]. However, a small
peak due to the TO mode is also observed here, prob-
ably due to a slight substrate misorientation or imper-
fection. This phenomenon has also been observed by
other semiconductors with (100) orientation [22].
The curves in Figure 4b present the Raman peaks of
GaSb nanofibers irradiated by a 30 keV Ga
+
ion beam.
Raman spectroscopy was performed on both unannealed
and annealed samples, at temperatures of 350 and 250°C
for 10 min. From the spectra, we can see that the inten-
sity of the LO modes becomes weaker after Ga
+
irradia-
tion. Figure 4b-1 shows the unannealed sample, where
the LO mod e red shifts to ~220 cm
-1
and its intensit y
almost approaches zero. This means that the GaSb
nanofibers become amorphous by Ga
+
ion irradiation.
Figure 4b-2 and 4b-3 present the spectra for the
annealed samples, in which the LO mode red shifts to
~225 cm
-1
and the full widths at half maximum
(FWHM) were broadened in comparison with bulk
GaSb spectrum. The stronger intensity of the LO modes
means the amorphous nanofibers became crystalline
through the annealing process. Such behavior of the
Raman peak red shift and broadening can be explained
by the phonon confinement effect [23]. Figure 4c pre-
sents the Raman peaks of GaSb nanofibers irradiated by
150 keV Kr
+
ions, both unannealed and annealed at the
temperature of 250°C. From the spectra, we c annot find
themodeofGaSbfromthetwocurves.Thesealtera-
tions of the LO mode by ion implantation on the crys-
talline structure are also attributed to the disordering of
the crystalline structure. Because the decay of transla-
tional symmetry relaxes the momentum conservation,
all photons in the Brillouin zone participate in ordered
Raman scattering. These will generally induce the shift
of the LO mode to a lower energy and cause asym-
metric broadening [24].
At the same time, a new strong peak is observed at
around 155 cm
-1
for the samples after Ga
+
and Kr
+
ion
beam bombardment as shown in Figure 4b, c. The
intensity of the peaks is comparable to that o f the LO
modes of the bulk GaSb sampl e. This anomalous phe-
nomenon is unique to GaSb. Kim et al. [15] conducted
Rutherford back scattering (RBS) measurements on
Zhou et al. Nanoscale Res Lett 2011, 6:6
/>Page 2 of 6
Figure 1 SEM images of GaSb nanofibers. a Under normal Ga
+
ion beam bombardment at 30 keV. b With an incident angle of 70°, Ga
+
ion
beam bombardment at 30 keV. c and d Under normal Kr
+
ion beam bombardment at 150 keV.
Figure 2 SEM images of GaSb under different ion beam irradiation fluences. a GaSb irradiated with Ga
+
ions to a fluence of 5.2 × 10
15
cm
-2
under normal bombardment. Only individual voids form at low dose. b GaSb irradiated with Ga
+
ions to a fluence of 1.1 × 10
16
cm
-2
under normal
bombardment. Fiber networks form at higher doses.
Zhou et al. Nanoscale Res Lett 2011, 6:6
/>Page 3 of 6
Figure 3 SEM and TEM images of GaSb nanofibers formed with Au
+
ions irradiation after annealed at 600°C for 10 min . a SEM image
of the annealed GaSb nanofibers b TEM image of the annealed GaSb nanofibers. c, d SEM images of Au-coated GaSb nanofibers after annealed
at 600°C for 10 min.
100 150 200 250 300
0.0
0.2
0.4
0.6
0.8
1.0
Bulk GaSb
Intensity (a.u)
Raman shift (cm
-1
)
LO
TO
a
1
2
3
100 150 200 250 300
0.0
0.2
0.4
0.6
0.8
1.0
30 keV Ga
+
30 keV Ga
+
350
°
C annealed
30 keV Ga
+
250
°
C annealed
Intensity (a.u)
Raman shift (cm
-1
)
b
100 150 200 250 30
0
0.0
0.2
0.4
0.6
0.8
1.0
150 KeV Kr
+
250
°
anneal
150 KeV Kr
+
Intensity (a.u)
Ranman shift (cm
-1
)
c
Figure 4 a Raman spectrum of bulk GaSb. b Raman spectra of GaSb n anofibers formed by 30 keV Ga
+
ion irradiation. Included are spectra
for: (1) unannealed nanofibers; (2) 350°C annealed nanofibers; (3) 250°C annealed nanofibers. c Raman spectra of GaSb nanofibers formed by
150 keV Kr
+
ion irradiation.
Zhou et al. Nanoscale Res Lett 2011, 6:6
/>Page 4 of 6
GaSb samples implanted with Ga
+
ions and found that
Sb atoms are deficient in the surface region of the irra-
diated areas. This phenomenon may be caused by the
selective sputtering of Sb atoms during the ion bom-
bardment process. However, recent work has shown
that the thermal annealing of GaSb nanofibers results in
a complete chemical decomposition of the nanofibers
into crystalline Sb cores surrounded by amorphous
GaO
x
shells [25], which is consistent with our TEM
datashowninFigure3b.IntheSbcrystal,thereisa
Raman peak at around 155 cm
-1
[13], which is related
to the A
1g
(150 cm
-1
)phononofSb.Carlesetal.[26]
have also observed Raman peaks at the same frequency
on nonstoichiometric amorphous GaSb films and
assigned this peak as the A
1g
mode due to Sb–Sb bond
vibration. Therefore, we can conclude that the Raman
peak is related to Sb–Sb bond vibrations rather than
other modes.
In order to study the characteristics of the amorphous
and crystalline nanofibers, we compare the Raman spec-
tra of Ga
+
bombarded samples anneale d at 250 and
350°C for 10 min and Kr
+
bombarded samples annealed
at 250°C, respectively. For the as-irradiated sample, as
shown in Figure 4b-1, no distinct modes of GaSb were
observed due to the amorphous state of the material.
Aft er annealing, the LO modes of GaSb are observed at
around 225 cm
-1
,asshowninFigure4b-2and4b-3.
However, the LO mode from the sample annealed at
350°C was s tronger than that from sample annealed at
250°C, showing that the LO mode of nanostructured
GaSb increased with increasing annealing temperature,
which means that the level of crystallinity of the nanofi-
bers is still low after low temperature annealing. How-
ever, as shown in Figure 4c, there is no mo de for GaSb.
The networks of nanofibers induced by 150 keV Kr
+
ion
irradiation were more obvious on the GaSb surface, so
the anomalous annealing behavior may b e attributable
to the thicker fiber layer forming underneath the mate-
rial surface.
On the other hand, the FWHM of the 250°C annealed
sample is wider than that of the 350°C annealed sample,
with a peak at 155 cm
-1
as shown in Figure 4b. This is
again due to the formation of Sb crystal during
annealing.
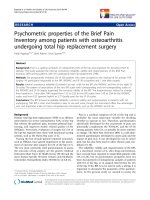
Figure 5a presents the room temperature P L charac-
teristics of bulk GaSb and the annealed GaSb nano-
fibers. We can observe an enhancement of the PL in the
range of 1.4–1.6 eV for the annealed 30 keV Ga
+
and
150 keV Kr
+
ion bombarded samples. Compared with
bulk GaSb with a direct bandgap of ~0.72 eV at room
temperature, the PL spectrum of the ion bombarded
samples shows a blue shift in the bandgap. It seems
likely that the PL mechanism of the GaSb nanofibers is
similar to that of porous silicon [27]. Specifically, the
exact treatment of this PL must be described quantum
mechanically in terms of photons. F or GaSb, the Bohr
radius is about 20.46 nm [28], while nanofib ers in GaSb
are ~20 nm in diameter. According to the effective-
mass approxim ati on, there is an energetic blue shift ΔE
that originates from nanoscale size effects of the GaSb
nanofibers. On the other hand, ion irradiation-induced
spatial separation of the bulk GaSb leads t o an extre-
mely sparse distribution of material compared with bulk
GaSb. The networks of nanofibers are connected with
air gaps in between, forming an inhomogeneous envir-
onment. When the fibers are irradiated by the laser, we
can consider an e mitting dipole in the nanofibers, and
then the fields generated by the substrate include the
dipole field E
0
from pure GaSb and a scat tered field E
s
from the nanoscale, inhomogeneous GaSb fiber net-
works. As a result, there is an extra energy that results
in the blue shift observed in our PL measurement.
1.2 1.4 1.6 1.8
PL Intensity (a.u)
Photoener
gy
(
eV
)
30 keV Ga+250
°
C annealing
bulk GaSb
150 keV Kr+ 250
°
C annealing
a
400 500 600 700 800
PL intensity (a.u)
Wavelen
g
th
(
nm
)
Bulk GaSb, 15 K
GaSb fibers, 600
°
C
anneal, 10min, 15K
GaSb fibers +Au,
600
°
C anneal, 10min,15K
b
1
2
3
Figure 5 a Room temperature PL intensity spectra for bulk GaSb and GaSb nanofibers annealed at 250°C. b Low temperature (15 K) PL
intensity for bulk GaSb, GaSb nanofibers annealed at 600°C and GaSb nanofibers coated with a thin Au film and then annealed at 600°C.
Zhou et al. Nanoscale Res Lett 2011, 6:6
/>Page 5 of 6
Figure 5b shows the low temperature (15 K) PL charac-
teristics of the bulk GaSb, GaSb nanofibers and GaSb
nanofibers coated with Au thin film and annealed at
600°C for 10 min. There was no PL peak observed from
the bulk GaSb, but both the annealed nanofibers and
the Au-coated nanofibers exhibited two PL peaks (at
400 and 540 nm), which could be attributed to Ga or
oxygen-related vacancy defects. Similarly, two peak
results were also obtained in Sinha’sworkonb-Ga
2
O
3
3D microstructures [29]. The nanofiber sample coated
with Au (Figure 5b-2) possesed a higher PL intensity
than that of the plain annealed nanofibers (Figure 5b-1),
which is probably due to surface plasmon effects [30].
Conclusions
In summary, focused Ga
+
ion, broad Kr
+
ion and broad
Au
+
ion beam irradiation were used to fabricate nano-
fibers on the surface of bulk GaSb. Raman scattering
shows that the LO phonon mode of GaSb decreases
after ion beam irradiation. A new mode is observed
around ~155 cm
-1
both from unannealed and annealed
nanofiber samples. The mode is related to the A
1g
mode
of Sb–Sb bond vibrati on. Room temperature PL charac-
teristics present an enhanceme nt from the annealed
GaSb nanofiber samples compared with the bulk. Quan-
tum confinement effects are discussed in regard t o the
blue shift of the bandgap. Low temperature (15 K) PL
characteristics of the annealed nanofibers show a blue
emission peaking at 420 nm and green emission peaking
at 550 nm, which may be attributed to atomic defects in
the nanostructures, such as oxygen vacancies, gallium
vacancies and gallium–oxygen vacancy pairs. Higher PL
intensities were obtained from the annealed GaSb fibers
coated with an Au thin film, which may be due to sur-
face plasmon effects. The en hanced PL and new ban d
characteristics in the annealed GaSb nanostructures sug-
gest that the irradiation-induced nanofibers may well
have vast applications in optoel ectronic devices for th eir
unique optical properties.
Acknowledgements
This work was supported by the Office of Basic Energy Sciences of the U.S.
Department of Energy under Grant No. DE-FG02-02ER46005. The FEI Nova
NanoLab was sponsored by NSF through the Grant DMR-0320740.
Author details
1
School of Physical Electronics, University of Electronic Science and
Technology of China, 610054 Chengdu, China.
2
Department of Materials
Science and Engineering, University of Michigan, 48109 Ann Arbor, MI, USA.
3
Department of Electrical Engineering and Computer Science, University of
Michigan, 48109 Ann Arbor, MI, USA.
4
Department of Nuclear Engineering
and Radiological Sciences, University of Michigan, 48109 Ann Arbor, MI, USA.
Received: 23 June 2010 Accepted: 5 August 2010
Published: 21 August 2010
References
1. Fiori G, Iannaccone G: Nanotechnology 2002, 13:294.
2. Von BJ, Van BT, Zacharias M, Chimowitz EH, Fauchet PM: Solid State
Commun 1998, 105:317.
3. Laudise RA: J Cryst Growth 1983, 65:3.
4. Hilderbrand O, Kuebart W, Bentz KW, Pilkuhn MH: IEEE J Quantum Electron
1981, QE-17:284.
5. Sunder WA, Barns RL, Kometani TY, Parsey JM Jr, Laud RA: J Cryst Growth
1986, 78:9.
6. Bennett BR, Magno R, Boos JB, Kruppa W, Ancona MG: Solid-State Electron
2005, 49:1875.
7. Dutta PS, Bhat HL, Kumar V: J Appl Phys 1997, 81:5821.
8. Facsko S, Dekorsy T, Koerdt C, Trappe C, Kurz H, Vogt A, Hartnagel HL:
Science 1999, 285:1551.
9. Callec R, Poudoulec A, Salvi M, L’Haridon H, Favennec PN, Gauneau M: Nucl
Instrum Methods Phys Res Sect B 1993, 80/81:532.
10. Appleton BR, Holland OW, Narayan J, Schow OE III, Williams JS, Short KT,
Lawson E: Appl Phys Lett 1982, 41:711.
11. Schoendorfer C, Lugstein A, Bertagnolli E: Microelectron Eng 2006, 83:1491.
12. Kluth SM, Fitz Gerald JD, Ridgway MC: Appl Phys Lett 2005, 86:131920.
13. Perez-Bergquist A, Zhu S, Sun K, Xiang X, Zhang Y, Wang LM: Small 2008,
4:1119.
14. Su YK, Gan KJ, Hwang JS, Tyan SL: J Appl Phys 1990, 68:5584.
15. Kim SG, Asahi H, Seta M, Takizawa J, Emura S, Soni RK, Gonda S, Tanoue H:
J Appl Phys 1993, 74:579.
16. Rama Rao CS, Sundaram S, Schmidt RL, Comas J: J Appl Phys 1983, 54:1808.
17. Wei QM, Lian J, Lu W, Wang LM: Phys Rev Lett 2008, 100:076103.
18. Facsko S, Bobek T, Stahl A, Kurz H: Phys Rev B 2004, 69:153412.
19. Cuerno R, Barabási A-L: Phys Rev Lett 1995, 74:4746.
20. Erlebacher J, Aziz MJ, Chason E, Sinclair MB, Floro JA:
Phys Rev Lett 1999,
82:2330.
21. Su YK, Gan KJ, Hwang JS, Tyan SL: J Appl Phys 1990, 68:5584.
22. Holtz M, Zallen R, Sodler RA: J Appl Phys 1986, 59:1946.
23. Campbell IH, Fauchet PM: Solid State Commun 1986, 58(10):739.
24. Tiong KK, Amirtharaj PM, Pollak FH, Aspnes DE: Appl Phys Lett 1984, 44:122.
25. Perez-Bergquist G, Sun K, Zhang YW, Wang LM: J Mater Res 2009, 24.
26. Carles R, Renuccl JB, Gheorghiu A, Theye M-L: Philos Mag B 1984, 49:63.
27. Yu J-I, Kim DL, Lee DY, Yun J-G, Bae I-H, Lee JH: Physica E 2005, 28:93.
28. Liu FM, Jia JH, Zhang LD: Appl Phys A 2000, 70:457.
29. Sinha G, Chaudhuri S: Mater Chem Phys 2009, 114:644.
30. Pradhan AK, Konda RB, Mustafa H, Mundle R, Bamiduro O, Roy UN, Cui Y,
Burger A: Opt Express 2008, 16:6202.
doi:10.1007/s11671-010-9739-2
Cite this article as: Zhou et al.: Optical Properties of GaSb Nanofibers.
Nanoscale Res Lett 2011 6:6.
Submit your manuscript to a
journal and benefi t from:
7 Convenient online submission
7 Rigorous peer review
7 Immediate publication on acceptance
7 Open access: articles freely available online
7 High visibility within the fi eld
7 Retaining the copyright to your article
Submit your next manuscript at 7 springeropen.com
Zhou et al. Nanoscale Res Lett 2011, 6:6
/>Page 6 of 6