Báo cáo hóa học: " Interaction of Water-Soluble CdTe Quantum Dots with Bovine Serum Albumin" ppt
Bạn đang xem bản rút gọn của tài liệu. Xem và tải ngay bản đầy đủ của tài liệu tại đây (495.77 KB, 6 trang )
NANO EXPRESS Open Access
Interaction of Water-Soluble CdTe Quantum Dots
with Bovine Serum Albumin
Vilius Poderys
1,2*
, Marija Matulionyte
2
, Algirdas Selskis
3
, Ricardas Rotomskis
1,2
Abstract
Semiconductor nanoparticles (quantum dots) are promising fluorescent markers, but it is very little known about
interaction of quantum dots with biological molecules. In this study, interaction of CdTe quantum dots coated with
thioglycolic acid (TGA) with bovine serum albumin was investigated. Steady state spectroscopy, atomic force
microscopy, electron microscopy and dynamic light scattering methods were used. It was explored how bovine
serum albumin affects stability and spectral properties of quantum dots in aqueous media. CdTe–TGA quantum
dots in aqueous solution appeared to be not stable and precipitated. Interaction with bovine serum albumin
significantly enhanced stability and photoluminescence quantum yield of quantum dots and prevented quantum
dots from aggregating.
Introduction
Since the first time fluorescent semiconductor nanoparti-
cles (quantum dots) were synthesized, they are widely
explored due to their possible applications in many fields,
including medicine. Tunable emission wavelength, broad
absorption and sharp emission spectra, high quantum
yield (QY), resist ance to chemi cal degrad ation and pho to
bleaching and versatility in surface modification make
quantum dots very promising fluorescent markers [1].
Quantum dots can be used for live cell la beling ex vivo,
detection and imaging of cancer cells ex vivo [2], as a
specific marker for healthy a nd diseased tissues labeling
[3], for labeling healthy and cancerous cells in vivo [4]
and for treatment of cancer using photodynamic therapy
[5]. Despite all unique photo physical properties, some
problems must be solved before quantum dots can be
successfully applied in medicine. Quantum dots usually
are water insoluble and made of materials that are toxic
for biological objects (Cd, Se). To make them suitable for
application in medicine, surface of quantum dots has to
be modified to make them water-soluble an d resistant to
biological media. After injection of quantum dots to live
organisms, they are exposed to various biomolecules
(ions, proteins, blood cells, etc.). This could lead
to degradation of quantum dot coating or quantum
dot itself. In this case, toxic Cd
2+
ions are released and
can cause damage to cells or even cell death.
A lot of research is done to better understand quan-
tum dots synthesis [6] growth [7] and m odification [1].
Recently, the interaction of quantum dots with biomole-
cules attracted much interest and is studied using var-
ious methods, such as atomic force microscopy, gel
electrophoresis, dynamic light scattering, size-exclusion
high-performance liquid chromatography, circular
dichroism spectroscopy and fluorescence correlation
spectroscopy [7-11]. It was shown that interaction of
quantum dots with biological molecules can enhance
optical properties and stability of quantum dots [12-14]
or it may opposit ely lead t o their degradation [15].
Serum albumin is one of the most studied proteins. It is
the most abundant protein in blood plasma and plays a
key role i n the transport o f a large number of metabo-
lites, endogenous ligands, fatty acids, bilirubin, hor-
mones, anesthetics and other commonly used drugs.
In this study, we investigated effect of interaction
between bovine serum al bumin (BSA) and water-soluble
CdTe quantum dots in aqueous solutions using micro-
scopy and spectroscopy methods.
Materials and Methods
Quantum dots solutions were prepared by dissolving
CdTe quantum dots coated with thioglycolic acid (l
PL
=
550 ± 5 nm, PlasmaChem GmbH, Germany) in deionized
water ( pH≈6) or saline (0.9% NaCl solution, pH≈ 5.6).
* Correspondence:
1
Laboratory of Biomedical Physics, Vilnius University Institute of Oncology,
Vilnius, Lithuania.
Full list of author information is available at the end of the article
Poderys et al. Nanoscale Res Lett 2011, 6:9
/>© 2010 Poderys et al. This is an Open Access article distributed under the terms of the Creative Commons Attribution License
( which permits unrestricted use, distribution, and reproduct ion in any medium,
provided the original work is properly cited.
Experiments of CdTe q uantum dots solution with
protein were performed by adding a small amount of
concentrated bovine serum albumin (BSA) (BSA, V frac-
tion, M = 69,000 g/mol, Sigma, Germany) solution in
saline to the quantum dots solution.
Spectral measurements were performed immediately
after preparation of solutions. Absorbance spectra were
measured with Varian Cary Win UV (Varian Inc.,
Australia) absorption spectrometer. Photoluminescence
spectra were measured with Varian Cary Eclipse ( Varian
Inc., Australia) and PerkinElmer LS 50B ( PerkinElmer,
USA) fluorimeters. Photoluminescence excitation wave-
length was 405 nm, excitation slits were 5 nm and emis-
sion slits 5 and 4 nm for Varian Cary Eclipse and
PerkinElmer LS 50B, respectively. Measurements were
taken in 1-cm path length quartz cells (Hellma,
Germany). Samples for atomic f orce microscopy mea-
surements were prepared by casting a drop (40 μl) of
solution on freshly cleaved V-1 grade muscovite mica
(SPI supplies, USA ) spinning a t 1,000 rpm. Atomic force
microscope (AFM) diInnova (Veeco instruments inc.,
USA) was used to take 3-dimensional (3-D) images of
quantum dots. Measurements were performed in tapping
mode in air; RTESP7 cantilevers (Veeco instruments inc.,
USA) were used. Samples for scanning transmission elec-
tron microscopy (STEM) measurements were prepared
by casting a drop of solution on TEM grid and drying it
in ambient air. STEM images were obtained with HITA-
CHI SU8000 microscope (Hitachi High-Technologies
Corporation, Japan). Malvern Zetasizer Nano S (Malvern
Instruments Ltd., England) was used to determine parti-
cles size distributions in investigated solutions.
Results
Normalized photoluminescence and absorption spectra
of BSA and CdTe quantum dots coated with thioglycolic
acid is presented in Figure 1. BSA has absorption band in
UV region at 280 nm, and fluorescence band peak is at
338 nm. CdTe–TGA quantum dots absorb light in wide
spectral region and have excitonic absorption band at
508 nm, and photoluminescence band peak of quantum
dots solution is at 550 n m. Titration of freshly prepared
quantum dots solution with BSA showed that addition of
protein to CdTe quantum dots solution increases photo-
luminescence intensity of quantum dots (simultaneously
a slight (~4 nm) bathochromic shift of quantum dots
excitonic absorption band is observed). This effect was
observed until 10
-5
mol/l BSA concentration was
reached. Further increase of BSA concentration in quan-
tum dots solution induced slight decrease in photolumi-
nescence intensity (Figure 2, curve A). Constant decrease
in CdTe quantum do ts solution photoluminescence
intensity was observed, when CdTe quantum dots solu-
tion was titrated with saline (Figure 2, curve B).
This constant decrease in photoluminescence intensity
was caused by decreasing concentration of quantum dots
(dilution effect). Curve C (Figure 2) shows CdTe quan-
tum dots photoluminescence intensity change caused by
CdTe–BSA interaction (dilution effect is eliminated).
The biggest increase in CdTe quantum dots photolumi-
nescence intensity (120% of initia l value) was observed
when ratio of BSA/quantum dot was 1.75:1.
Dynamics of quantum dots photoluminescence prop-
erties (photoluminescence intensity and photolumines-
cence band peak position) in solutions with BSA and
without BSA are presented in Figure 3. Photolumines-
cence intensity of CdTe– TGA quantum dots solution
(c =6×10
-6
mol/l) without bovine serum albumin was
Figure 1 Normalized photoluminescence and normalized
absorption spectra of bovine serum albumin (BSA) and CdTe
quantum dots coated with thioglycolic acid.
Figure 2 CdTe quantum dots (CdTe c =7.5×10
-6
mol/l)
photoluminescence intensity (at 550 nm): A during titration
with BSA (c =10
-4
mol/l), B titrating with saline, C change of
photoluminescence intensity caused by BSA (dilution effect is
eliminated).
Poderys et al. Nanoscale Res Lett 2011, 6:9
/>Page 2 of 6
increasing for the first 144 h (Figure 3, curve A). Photo-
luminescence band maximum position and width stayed
intact. After 144-h photoluminescence intensity started
to decrease, band started to narrow and shift to longer
wavelength region. Simultaneously absorption slightly
decreased (Figure 3, curve B). Decrease in quantum dots
photoluminescence intensity and bathochromic shift of
photoluminescence band indicates aggregation of quan-
tum dots. After 9 days, precipitate of large aggregates
appeared in quantum dots solution.
A sudden increase in photoluminescence intensity (by
27%) was observed after protein was added to the
CdTe quantum dots solution in saline (Figure 3a).
Photoluminescence intensity further increased for
approximately 40 h. Later photoluminescence intensity
started decreasing, but decrease in intensity was quite
slow and at longer time scale became negligible (even
after 6 months no pre cipitate was observed). Photolumi-
nescence band width and maximum position remained
constant, and absorption intensity slightly increased.
This indicates that core of quantum dot remained intact.
Investigation of quantum dot size with atomic force
microscope (AFM) and scanning electron transmission
microscope (STEM) showed that in solution without
protein quantum dots aggregate (Figure 4a–d). AFM
image of quantum dots, deposited from solution that
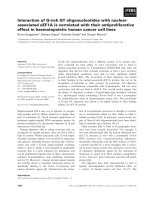
Figure 3 a dynamics of CdTe quantum dots solution (c =6×10
-6
mol/l) photoluminescence intensity (measured at peak position) and
photoluminescence band peak position, b absorption (at excitonic absorption band maximum) dynamics of CdTe quantum dots.
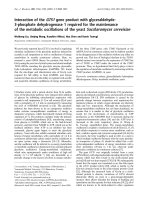
Figure 4 AFM (a, b, c, e) and STEM (d, f) images of CdTe quantum dots. a–c AFM images of quantum dots dispersed on mica (dispersed from
aqueous solution kept for: a 40 min, b 5h,c 24 h), d STEM image of quantum dots dispersed on TEM grid (dispersed from solution kept for 48 h),
e AFM image of quantum dots with BSA dispersed on mica (dispersed from aqueous solution kept for 2 months), f STEM image of quantum dots
with BSA (dispersed from aqueous solution kept for 2 months). Inserts (in d and f images) show magnified view (40 nm × 40 nm). Concentrations
of solutions used for sample preparation were 6 × 10
-6
mol/l.
Poderys et al. Nanoscale Res Lett 2011, 6:9
/>Page 3 of 6
was kept for 40 min, is presented in Figure 4a. A lot of
small round structures were present on the surface.
These structures were ~2.5 nm in height and ~25 nm in
width. Shape of colloidal quantum dots should be close
to spherical (width of quantum dot should be approxi-
mately equal to height). Height of these structures is
approximately equal to a height of single quantum dot,
but width was much bigger. This could be explained by
AFM imaging artifact called “tip imaging”. It is also pos-
sible that these small structures are not single quantum
dots but few quantum dots attached to each other. AFM
image of quantum dots deposited from solution that was
kept for 5 h shows larger structures (Figure 4b). Height
and width of these structures varied in broader range.
Some small structures (height–2.5 nm, width–20 nm)
could be seen, but bigger structures (up to 9 nm in
height and up to 70 nm in width) were also present.
Image of sample prepared from solution that was kept
for 24 h (Figure 4c) showed that sizes of the structures
increased even more (height–up to 13 nm, width–up to
150 nm). In STEM images (Figure 4d), obtained 2 days
after solution preparation, various size structures (much
larger than single quantum dots) were seen. This shows
that CdTe–TGA quant um dots dissol ved in aqueous
solution are not stable, and aggregates and forms large
clusters of quantum dots.
AFM image (Figure 4e) of sample prepared from
CdTe quantum dots solution in saline with BSA (solu-
tion was kept for 2 months) showed that there were no
large structures that could form precipitate, but there
were plenty of round structures that were 9–20 nm in
height and 40–60 nm in width. Height of structures
seen in image (9–20 nm) was bigger than height of sin-
gle quantum dot (~2.5 nm). BSA is heart-shaped mole-
cule; its approximate size is 8 nm × 8 nm × 3 nm [14].
Structures observed in AFM image were a bit bigger
than BSA molecules. Structures observed in AFM image
could be CdTe quantum dots coated with BSA. In
STEM image, only small structures (single quantum
dot) ~3 nm in diameter are seen. In bigger collections,
quantum dots are separated one from another by
~3 nm (Figure 4f). Interaction of quantum dots with
BSA could lead to the formation of additional quantum
dot co ating layer that prevents quantum dots from
aggregation. Additional coating layer is not visible in
STEM image because BSA is formed of light atoms that
are not visible in STEM images.
Particle size distributions in BSA solution, CdTe–TGA
quantum dots solution and CdTe–TGA quantum dots
solution with BSA are presented in Figure 5 (solutions
were kept for 1 week). Average diameter of particles in
BSA solution is 8.7 nm. This result very well coincides
with dimensions of BSA molecule presented in literature
[16]. Sizes of particles present in CdTe quantum dot s
solution are bigger than 50 nm in diameter, much big-
ger than size of single quantum dot (that should be
approximately 2–3 nm). This shows that quantum dots
formed aggregates and confirms results obtained with
AFM and STEM. Particle size distribution in CdTe–
TGA with BSA solution shows that in this solution
average particle size is slightly bigger (diameter
~12.5 nm) than in BSA solution (diameter ~8.7 nm).
This shows that CdTe–TGA quantum dots interact with
BSA and form quantum dot–protein complex whose
size is approximately 12.5 nm.
Discussion
Our proposed model explaining spectral dynamics of
CdTe–TGA quantum dots in aqueous solution with and
without BSA is presented in Figure 6.
Dynamics of photoluminescence properties of inves-
tigated solut ions (presented in Figure 3) show two
phases—growth of photoluminescence and decrease of
photoluminescence. In the first phase, photolumines-
cence of quantum dots increased in both investigated
solutions (quantum dots without protein and quantum
dots with protein). Despite quite large increase in
photoluminescence spectra, changes in absorption
spectrum were very small. During this phase, photolu-
minescence band peak position and photoluminescence
band width remained constant. These changes indicate
that core of quantum dot remains intact. Core degra-
dation would cause blue shift of photoluminescence
band; aggregation of quantum dots would cause a red
shift. Change in photolumi nescence intensity indicates
that properties of quantum dot coating (or coating
Figure 5 Particle size distributions: A in aqueous BSA solution
(c = 10
-5
mol/l), B in aqueous CdTe–TGA quantum dots
solution (c =6×10
-6
mol/l), C in aqueous CdTe–TGA quantum
dots solution (c =6×10
-6
mol/l) with BSA (c =10
-5
mol/l). All
solutions were kept for 1 week.
Poderys et al. Nanoscale Res Lett 2011, 6:9
/>Page 4 of 6
itself) are changing: molecules coating core of quantum
dot are rearranging, being replaced by other molecules
of being washed-out. Theoretically, increase in quan-
tum dots photoluminescence intensity is explained by
decrease in non-radiative transitions or their speeds.
Decrease in defects on quantum dots surface would
cause this effect [17]. Another process that can change
intensity of quantum dots photoluminescence is aggre-
gation. Aggregation of quantum dots decreases photo-
luminescence quantum yield. Slow dissolution
(monomerization) of quantum dots powder (aggre-
gates) could cause increasing photoluminescence inten-
sity due to increased photoluminescence quantum
yield of single quantum dots compared with aggregated
form. More detailed investigation into absorption spec-
trum dynamics during first d ay after preparation of
solution contradicts to this explanation. Absorption of
quantum dots dissolved in deionized water decreases
during first day. This decrease can be explained by
aggregation of quantum dots. Aggregation of quantum
dots leads to decrease in absorption intensity, red shift,
broadening and photoluminescence band intensity
decrease. But in first phase, width and wavelength
of photoluminescence band do not change, whereas
photoluminescence intensity increases. So these
changes are caused not by aggregation of quantum
dots but by changes in quantum dot coating. CdTe–
TGA quantum dots are fluorescent nanoparticles com-
posed of CdTe core and TGA coating. Rearrangement
of quantum dot coating can lead to decrease in defects
on quantum dot surface and increase in photolumines-
cence quantum yield. Sudden increase in quantum
dots photoluminescence band intensity, after adding
BSA to solution, shows that interaction of quantum
dots with BSA strongly increases photoluminescence
quantum yield. Photoluminescence decay measure-
ments presented in literature [18] confirm this result.
Photoluminescence decay of q uantum dots with BSA is
tri-exponential, while photoluminescence decay of
quantum dots is described with four exponents.
This shows that addition of protein eliminates one
excitation relaxation path. Photoluminescence lifetime
analysis shows that fastest relaxation component (τ
1
=
3.4 ns) disappears [18]. Fastest relaxation component is
caused by defects of quantum dots [19]. Elimination
of this component leads to increase in quantum
dots photoluminescence quantum yield. So increase
in photoluminescence intensity at the first phase
is caused by rearrangement of TGA molecules
(Figure 6IA, IB) .
In the second phase, photoluminescence of quantum
dots starts to decrease. TGA molecules are not cova-
lently bound to CdTe core (they are attached to it by
coordinating bonds [20]) and probably are washing out
slowly (Figure 6IIA, IIIB). This process i ncreases num-
ber of defects on quantum dots surface and leads to
decrease in photoluminescence quantum yield. AFM
and STEM images (Figure 4a–d) show that quantum
dots in aqueous media aggregate. TGA coating makes
CdTe quantum dots water soluble. Washing out of coat-
ing decreases water solubility of quantum dots, increases
aggregation speed (Figure 6IIIA) and leads to formation
of precipitate (Figure 6IVA). In the second phase, effects
of aggregation (decrease in photoluminescence intensity
Figure 6 Model of CdTe–TGA aggregation and interaction with bovine serum albumin.
Poderys et al. Nanoscale Res Lett 2011, 6:9
/>Page 5 of 6
and red shift of photoluminescence band) are seen in
quantum dots solution without protein (Figure 3a).
Second phase is different for quantu m dots solution
with protein. In this case, photoluminescence decreases
slowl y and after some time stabilizes. Position of photo-
luminescence band does not change during this phase.
This shows that quantum dots in the presence of pro-
tein do not aggregate, and protein prevents the degrada-
tion of quantum dot coating and aggregation of
quantum dots.
Conclusions
This study showed that water-soluble CdTe–TGA quan-
tum dots in aqueous solutions are not stable. Spectro-
scopic and atomic force microscopy measurements
showed that quantum dots aggregate in solution, and
9 days after preparation of solution, precipitate was
observed. BSA interacts with CdTe–TGA quantum dots,
prevents them from aggregating, increases photolumi-
nescence quantum yield and makes them stable. This
effect is achieved by forming a new layer of quantum
dot coating.
Acknowledgements
This work was supported by the project “Multifunctional nanoparticles for
specific non-invasive early diagnostics and treatment of cancer” (No. 2004-
LT0036-IP-1NOR).
Author details
1
Laboratory of Biomedical Physics, Vilnius University Institute of Oncology,
Vilnius, Lithuania.
2
Biophotonics Laboratory, Quantum Electronics
Department, Physics Faculty, Vilnius University, Vilnius, Lithuania.
3
Department of Material Structure, Institute of Chemistry, Vilnius, Lithuania.
Received: 24 June 2010 Accepted: 5 August 2010
Published: 22 August 2010
References
1. Rotomskis R, Streckyte G, Karabanovas V: Medicina (Kaunas) 2006,
42(7):542-558.
2. Nida DL, Rahman MS, Carlson KD, Richards-Kortum R, Follen M: Gynecol
Oncol 2005, 99(3):89-94.
3. Rotomskis R: Tumori 2008, 94(2):89-94.
4. Gao X, Cui Y, Levenson RM, Chung L, Nie S: Nat Biotechnol 2004,
22(8):969-976.
5. Bakalova R, Ohba H, Zhelev Z, Ishikawa M, Baba Y: Nat Biotechnol 2004,
22(11):1360-1361.
6. Rong H, Xiaogang Y, Hongye T, Feng G, Daxiang C: Front Chem China 2008,
3(3):325-329.
7. Xie YZ, Kunets VP, Wang ZM, Dorogan V, Mazur YI, Wu J, Salamo GJ: Nano-
MicroLett 2009, 1(1):1-3.
8. Shao L, Dong C, Sang F, Qian H, Ren J: J Fluoresc 2009, 19(1):151-157.
9. Ipe BI, Shukla A, Lu H, Zou B, Rehage H, Niemeyer CM: Chemphyschem
2006, 7(5):1112-1118.
10. Pons T, Uyeda HT, Medintz IL, Mattoussi H: J Phys Chem B 2006,
110(41):20308-20316.
11. Nehilla BJ, Vu TO, Desai TA: J Phys Chem B 2005, 109(44):20724-20730.
12. Gao X, Chan WCW, Nie S: J Biomed Opt 2002, 7:532-537.
13. Wang Q, Kuo Y, Wang Y, Shin G, Ruengruglikit C, Huang Q: J Phys Chem B
2006, 110(34):16860-16866.
14. Liang J, Cheng Y, Han H: J Mol Struct 2008, 892(1–3):116-120.
15. Karabanovas V, Zakarevicius E, Sukackaite A, Streckyte G, Rotomskis R:
Photochem Photobiol Sci 2008, 7(6):725-729.
16. Carter DC, Ho JX: Adv Protein Chem 1994, 45:153-203.
17. Byrne SJ, Corr SA, Rakovich TY, Gun’ko YK, Rakovich YP, Donegan JF,
Mitchell S, Volkov Y: J Mater Chem 2006, 16:2896-2902.
18. Poderys V, Motekaitis D, Rotomskis R: Medical Physics in the Baltic States,
Proceedings of the 7th International conference on medical physics.
2009, 24-29.
19. Jeong S, Achermann M, Nanda J, Ivanov S, Klimov VI, Hollingsworth JA:
J Am Chem Soc 2005, 127(29)
:10126-10127.
20. Mandal A, Tamai N: J Phys Chem C 2008, 112(22):8244-8250.
doi:10.1007/s11671-010-9740-9
Cite this article as: Poderys et al.: Interaction of Water-Soluble CdTe
Quantum Dots with Bovine Serum Albumin. Nanoscale Res Lett 2011 6:9.
Submit your manuscript to a
journal and benefi t from:
7 Convenient online submission
7 Rigorous peer review
7 Immediate publication on acceptance
7 Open access: articles freely available online
7 High visibility within the fi eld
7 Retaining the copyright to your article
Submit your next manuscript at 7 springeropen.com
Poderys et al. Nanoscale Res Lett 2011, 6:9
/>Page 6 of 6