Báo cáo hóa học: " Research Article Missing Texture Reconstruction Method Based on Perceptually Optimized Algorithm" ppt
Bạn đang xem bản rút gọn của tài liệu. Xem và tải ngay bản đầy đủ của tài liệu tại đây (18.69 MB, 13 trang )
Hindawi Publishing Corporation
EURASIP Journal on Advances in Signal Processing
Volume 2010, Article ID 208976, 13 pages
doi:10.1155/2010/208976
Research Article
Missing Texture Reconstruction Method Based on
Perceptually Optimized Algorithm
Takahiro Ogawa and Miki Haseyama
Graduate School of Information Science and Technology, Hokkaido University, Sapporo 060-0814, Japan
Correspondence should be addressed to Takahiro Ogawa,
Received 23 August 2010; Revised 12 October 2010; Accepted 26 October 2010
Academic Editor: Enrico Capobianco
Copyright © 2010 T. Ogawa and M. Haseyama. This is an open access article distributed under the Creative Commons Attribution
License, which permits unrestricted use, distribution, and reproduction in any medium, provided the original work is properly
cited.
This paper presents a simple and effective missing texture reconstruction method based on a perceptually optimized algorithm.
The proposed method utilizes the structural similarity (SSIM) index as a new visual quality measure for reconstructing missing
areas. Furthermore, in order to adaptively reconstruct target images containing several kinds of textures, the following two
novel approaches are introduced into the SSIM-based reconstruction algorithm. First, the proposed method performs SSIM-
based selection of the optimal known local textures to adaptively obtain subspaces for reconstructing missing textures. Secondly,
missing texture reconstruction that maximizes the SSIM index in the known neighbor ing areas is performed. In this approach,
the nonconvex maximization problem is reformulated as a quasi convex problem, and adaptive reconstruction of the missing
textures based on the perceptually optimized algorithm becomes feasible. Experimental results show impressive improvements of
the proposed method over previously reported reconstruction methods.
1. Introduction
Restoration of missing areas in digital images has been
intensively studied since it can be applied to a number of
fundamental applications such as restoration of corrupted
old films, removal of unnecessary objects, and error con-
cealment. Therefore, many methods have been proposed
in order to realize these applications. Generally, they are
broadly classified into two categories, structural and textu-
ral reconstruction approaches, and many papers on these
approaches have been published. Attractive methods that
perform simultaneous reconstruction of missing structures
andtexturesinimageshavealsobeenproposed[1, 2].
Most algorithms reported in the literature are based on
structural inpainting techniques for accurate reconstruction
of missing edges [3–5]. These techniques are effective for
pure structure images. However, since general images also
contain many textures, different methods work better in
these areas. Thus, several methods have been proposed
for accurate reconstruction of missing textures [6–12]. The
remainder of this paper focuses on the texture reconstruction
approach with discussion of its details.
Traditionally, missing texture reconstruction is realized
as one of the applications of texture synthesis. Efros et al.
firstly proposed a pioneered method for the texture synthesis
[6, 7]. Their approach models textures by using the MRF
(Markov random field) model and enables missing texture
reconstruction by copying pixels of a target image itself, that
is, nonparametric sampling in synthesis. Further m ore, Wei
and Levoy proposed a fast algorithm for the searching step
in the texture synthesis by utilizing multiresolution concepts
[8]. Then many methods which perform the exemplar-
based inpainting are mainly inspired by the nonpar ametric
sampling in [6]. Drori et al. proposed a fragment-based
algorithm for image completion which could preserve struc-
tures and textures [9]. Furthermore, the exemplar-based
image inpainting method proposed by Criminisi et al. is a
representative one based on the texture synthesis [10, 11].
This method adopts a patch-based greedy sampling scheme
similar to the fr agment-based completion, but it is simpler
and faster. A good review of the exemplar-based inpainting
methods based on [6] is shown in [12].
In the field of texture reconstruction, not only the meth-
ods based on the texture synthesis but also many methods,
2 EURASIP Journal on Advances in Signal Processing
which estimate missing intensities by utilizing statistical
features of known textures within a target image as training
patterns, have been proposed. Generally, since the restoration
of missing areas is an ill-posed problem, it is difficult to
directly estimate the missing intensities. Thus, these methods
perform approximation of textures within the target image
in lower-dimensional subspaces and enable derivation of
the inverse projection for the corruption. Amano and Sato
proposed an effective PCA-based method for reconstructing
missing textures using back projection for lost pixels and
realized accurate reconstruction performance [13]. Further-
more, kernel methods have recently been developed and their
achievements have been reported in a number of papers [14–
16]. Subspaces constructed on the basis of kernel methods
are also suitable for approximating nonlinear texture features
in target images. Several missing texture reconstruction
methods that utilize projection schemes onto nonlinear sub-
spaces obtained by kernel PCA and CCA have been proposed
[17, 18]. Furthermore, image reconstruction based on sparse
representation approaches [19–21] have been intensively
studied. By utilizing sparse representation, optimal signal
atoms can be adaptively selected from a dictionary for
representing target signals. This means that these methods
can adaptively provide optimal subspaces for restoring
missing areas. Several missing area reconstruction methods
based on sparse representation have been proposed [21–23].
It should be noted that in conventional methods,
reconstruction is mostly performed by minimizing errors of
intensities, that is, the mean squared error (MSE), which is
the most popular metric. However, it has been reported that
MSE optimal algorithms do not necessarily produce images
of high visual quality [24].Thus,itmaynotbeappropriate
to utilize the MSE as a quality measure for reconstruct ion.
Recent advances in full-reference image quality assessment
(IQA) have resulted in the emergence of several powerful
perceptual distortion measures that outperform the MSE
and its variants. Criteria such as PQS [25], NQM [26], IFC
[27], and VIF [28] are well known as perceptual distortion
measures, and their performances have been evaluated in
detail [29]. The structural similarity (SSIM) index [30]is
utilized as a representative quality measure in many fields of
image processing. Since its formulation is simple and easy
to be analyzed, the SSIM index can be applied to not only
image quality assessment but also design of linear equalizers
[31]. Therefore, by using this quality measure, accurate
reconstruction of missing textures can be expected.
In this paper, we present a simple and effective missing
texture reconstruction method based on a perceptually
optimized algorithm. The proposed method utilizes the
SSIM index as a criterion for reconstructing missing areas in
the target image. Specifically, we introduce the following two
novel approaches into the SSIM-based algorithm and realize
adaptive reconstruction of missing textures.
(1) SSIM-based selection of the optimal known local
textures for reconstructing target textures including
missing areas.
(2) Reconstruction of the target textures maximizing the
SSIM index in the known neighboring areas.
The first approach provides optimal subspaces for the
following SSIM-based reconstruction approach by using an
algorithm similar to several matching pursuit algorithms
[32, 33]. Furthermore, in the second approach, we introduce
the computation scheme in [31] into the SSIM-based
reconstruction algorithm, and its nonconvex maximization
problem is r eformulated as a quasi convex problem. Then the
optimal solution based on the SSIM index can be computed,
and accurate reconstruction of the missing textures is
expected.
This paper is organized as follows. First, in Section 2,
we briefly explain the SSIM index used as the quality
measure in the proposed method. Next, the missing texture
reconstruction method based on the perceptually optimized
algorithm is proposed in Section 3. Experimental results that
verify the performance of the proposed method are shown in
Section 4. Finally, conclusions are given in Section 5.
2. SSIM Index
The SSIM index represents the similarity between two signal
vectors x and y (
∈ R
n
), and its specific definition is as follows:
SSIM
x, y
=
l(x, y)
α
·
c(x, y)
β
·
s(x, y)
γ
,(1)
where the terms l(x, y)andc(x, y), respectively, compare the
mean and variance of the two signal vectors. Furthermore,
s(x, y) measures their str uctural correlation. These three
terms, l(x, y), c(x, y), and s(x, y), are obtained as
l
x, y
=
2μ
x
μ
y
+ C
1
μ
2
x
+ μ
2
y
+ C
1
x, y
=
2σ
x
σ
y
+ C
2
σ
2
x
+ σ
2
y
+ C
2
c,
s
x, y
=
σ
x,y
+ C
3
σ
x
σ
y
+ C
3
.
(2)
In the above equations, μ
x
and μ
y
are the means of x and y,
σ
2
x
and σ
2
y
are the variances of x and y,andσ
x,y
is the cross-
covariance between x and y. The constants C
1
, C
2
and C
3
are
necessary for avoiding instability when the denominators are
veryclosetozero.Theparametersα>0, β>0andγ>0
determine the relative importance of the three components
in ( 1). As shown in [30], those parameters are set as α
=
β = γ = 1andC
3
= C
2
/2, and formulation of the SSIM is
simplified as follows:
SSIM
x, y
=
2μ
x
μ
y
+ C
1
2σ
x,y
+ C
2
μ
2
x
+ μ
2
y
+ C
1
σ
2
x
+ σ
2
y
+ C
2
. (3)
As shown in (1)–( 3 ), the SSIM index is consistent with
luminance and contrast masking and the correlation.
In [30, 34], the effectiveness of the SSIM index as a quality
measure and its superiority to the MSE and its variants are
presented in detail. Generally, the MSE cannot reflect per-
ceptual distortions, and its value becomes higher for images
altered with some distortions such as mean luminance shift,
EURASIP Journal on Advances in Signal Processing 3
contrast stretch, spatial shift, spatial scaling, and rotation,
yet negligible loss of subjective image quality. Furthermore,
blurring severely deteriorates the image quality, but its MSE
becomes lower than those of the above alternation. On
the other hand, the SSIM index is defined by separately
calculating the three similarities in terms of the luminance,
variance, and structure, which are derived based on the
HVS (human visual system) not accounted for by the MSE.
Therefore, it becomes a better quality measure providing a
solution to the above problem, and this is also confirmed in
[34]. Then we can expect that the use of this similarity for
the reconstruction of missing areas will provide successful
results. The specific effectiveness of the SSIM index for the
reconstruction is discussed in Section 4.
3. Adaptive Missing Texture Reconstruction
Based on SSIM Index
In this section, we present an adaptive SSIM-based missing
texture reconstruction method. In the proposed method, a
patch f (w
×h pixels) including missing areas is clipped from
the target image, and its missing textures are estimated from
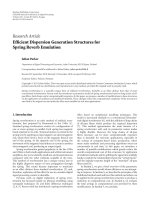
the other known areas. An overview of the proposed method
is shown in Figure 1. For the following explanations, we
denote two areas whose intensities are unknown and known
within the target patch f as Ω and
Ω, respectively. We also
define vectors whose elements are intensities within f and
Ω as x(∈ R
wh
)andy(∈ R
N
Ω
), respectively, where N
Ω
is the
number of pixels within the area
Ω.
In the target image, there are several kinds of textures,
that is, there are many known patches whose textures are
quite different from that of the target patch f .Suchpatches
should not affect the reconstruction of the target patch f .In
order to reconstruct the missing textures within the target
patch f from only the same kinds of textures, we have to
select those textures from the known areas. Therefore, the
proposed method first performs selection of the optimal
known patches utilized for reconstruction of the target
patch f based on the SSIM index. Furthermore, by using
the selected patches, we derive the representation model
optimized for the target patch f in terms of the SSIM index to
reconstruct the missing area Ω. Then the proposed method
can adaptively reconstruct the missing textures from only
the same kinds of known textures based on the perceptually
optimized scheme.
In this section, we first show the SSIM-based algorithm
for selecting the optimal known patches in Section 3.1.The
reconstruction algorithm of the missing textures based on
the SSIM index is shown in Section 3.2.
3.1. SSIM-Based Optimal Texture Selection Algorithm. In
this subsection, we present the SSIM-based optimal texture
selection algorithm. First, we clip known patches f
i
(i =
1, 2, , N) whose size is w×h pixels from the target image in
the same interval. For the following explanation, two vectors
that correspond to x and y of each patch f
i
are denoted as x
i
(∈ R
wh
)andy
i
(∈ R
N
Ω
), respectively. From the clipped patch,
we select M patches that are optimal for reconstruction of
the target patch f . The order of the value M is explained
in Section 4. In the reconstruction algorithm shown in the
following subsection, the target patch f is represented by a
linear combination of the selected known patches in such
a way that the SSIM index in the known area
Ω becomes
maximum. Therefore, we should select M known patches
that provide the optimal linear combination. Note that the
selection of such optimal M known patches is an NP-hard
problem. Thus, we adopt the simplest algorithm that selects
the optimal known patches one by one, and it is similar to
several matching pursuit algorithms [32, 33]. In the rest of
this subsection, the details of the tth (t
= 1, 2, , M)optimal
patch selection are shown.
In the tth iteration, we first define the following vector:
y
(t)
i
=
Y
(t−1)
y
i
⎡
⎣
a
(t−1)
a
i
⎤
⎦
=
Y
(t)
i
a
(t)
i
,(4)
where Y
(t−1)
is an N
Ω
× (t − 1) matrix which contains t − 1
vectors previously selected from y
i
(i = 1, 2, , N)int − 1
iterations. Furthermore,
Y
(t)
i
=
Y
(t−1)
y
i
,
a
(t)
i
=
⎡
⎣
a
(t−1)
a
i
⎤
⎦
∈
R
t
(5)
is a coefficient vector for obtaining y
(t)
i
.Theproposed
method estimates the optimal vector
y
(t)
i
of y
(t)
i
(i =
1, 2, , N) which provides the optimal representation per-
formance based on the SSIM index. Then the best matched
patch f
i
, whose vector y
(t)
i
approximating y has a higher value
of the SSIM index than those of other patches, is selected.
In order to calculate
y
(t)
i
for each patch f
i
,wehaveto
estimate the optimal coefficient vector a
(t)
i
of a
(t)
i
in (4) that
satisfies
y
(t)
i
= Y
(t)
i
a
(t)
i
. (6)
This means we have to solve the following equation:
a
(t)
i
= arg max
a
(t)
i
SSIM
y, y
(t)
i
,(7)
where SSIM(y, y
(t)
i
)isdefinedasfollows:
SSIM
y, y
(t)
i
=
⎛
⎝
2μ
y
μ
y
(t)
i
+ C
1
μ
2
y
+ μ
2
y
(t)
i
+ C
1
⎞
⎠
⎛
⎝
2σ
y,y
(t)
i
+ C
2
σ
2
y
+ σ
2
y
(t)
i
+ C
2
⎞
⎠
.
(8)
In the above equation, μ
y
and μ
y
(t)
i
are the means of y and
y
(t)
i
, σ
2
y
and σ
2
y
(t)
i
are the variances of y and y
(t)
i
,andσ
y,y
(t)
i
is
4 EURASIP Journal on Advances in Signal Processing
Information about Ω and Ω
Selection of the optimal local images
Target local image f
Reconstruction results
SSIM-based missing texture reconstruction (section 3.1)
g
j
( j = 1, 2, , M) (section 3.1)
Clipped known local images f
i
(i = 1, 2, , N)
Figure 1: Outline of the proposed method including a perceptually optimized algorithm.
the cross covariance between y and y
(t)
i
. Furthermore, since
y
(t)
i
is provided in (4), (8) is rewritten as follows:
SSIM
y, y
(t)
i
=
⎡
⎢
⎣
2μ
y
(
1/N
Ω
)
1
Y
(t)
i
a
(t)
i
+ C
1
μ
2
y
+
(
1/N
Ω
)
1
Y
(t)
i
a
(t)
i
2
+ C
1
⎤
⎥
⎦
×
⎡
⎢
⎣
(
2/N
Ω
)
y − μ
y
1
Y
(t)
i
a
(t)
i
−
(
1/N
Ω
)
11
Y
(t)
i
a
(t)
i
+ C
2
σ
2
y
+
(
1/N
Ω
)
Y
(t)
i
a
(t)
i
−
(
1/N
Ω
)
11
Y
(t)
i
a
(t)
i
2
+ C
2
⎤
⎥
⎦
=
⎡
⎢
⎣
2µ
y
µ
Y
(t)
i
a
(t)
i
+ C
1
μ
2
y
+ a
(t)
i
µ
Y
(t)
i
µ
Y
(t)
i
a
(t)
i
+ C
1
⎤
⎥
⎦
×
⎡
⎢
⎢
⎢
⎣
(
2/N
Ω
)
y − μ
y
1
Y
(t)
i
a
(t)
i
− 1µ
Y
(t)
i
a
(t)
i
+ C
2
σ
2
y
+
(
1/N
Ω
)
Y
(t)
i
a
(t)
i
− 1µ
Y
(t)
i
a
(t)
i
2
+ C
2
⎤
⎥
⎥
⎥
⎦
=
S
a
(t)
i
,
(9)
where 1
= [1, 1, ,1]
is an N
Ω
× 1vector,and
µ
Y
(t)
i
=
1
N
Ω
Y
(t)
i
1. (10)
The proposed method calculates the optimal vector
a
(t)
i
in (7) by simply applying the steepest ascend algorithm
to S(a
(t)
i
)in(9). Note that we can calculate the optimal
vector
a
(t)
i
more accurately by using the algorithm shown in
the following subsection. However, in order to reduce the
computation time of the proposed method, we adopt the
steepest ascend algorithm in this subsection. It is well known
that the steepest ascend algorithm cannot necessarily provide
the globally optimal solutions in (7), but this algorithm can
save the computation time compared to the algorithm shown
in the following subsection. The details are shown later. From
the above reason, we utilize this scheme in the proposed
method.
By iterating the above procedures M times, we can select
the optimal M known patches based on the SSIM index and
denote them as g
j
( j = 1, 2, , M). Algorithm 1 shows
the specific procedures of this selection algorithm. Then by
utilizing the obtained known patches, the proposed method
can adaptively provide the optimal subspace for the target
patch f , and accurate reconstruction based on the SSIM
index is also expected in the following subsection. For the
following explanation, we denote two vectors obtained from
g
j
in the same way as x and y as x
j
and y
j
,respectively.
3.2. Texture Reconstr uction Algorithm. In this subsection, we
present the reconstruction algorithm of the missing area Ω
in the target patch f based on the SSIM index. First, we
approximate the known vector y of the target patch f by
utilizing y
j
of the patches g
j
( j = 1, 2, , M) selected in the
previous subsection as follows:
y = Ya, (11)
where Y is an N
Ω
× M matrix whose columns are y
j
( j = 1, 2, , M), and a(∈ R
M
)isacoefficient vector for
representing y. The proposed method estimates the optimal
vector
a as follows:
a = arg max
a∈R
M
SSIM
y, Ya
. (12)
EURASIP Journal on Advances in Signal Processing 5
(i) Initialization is performed as follows: t = 1,
F
={f
1
, f
2
, , f
N
},andG ={}. Furthermore, Y
(t−1)
,anda
(t−1)
are, respectively, set to the empty matrix, and vector.
(ii) For each patch included in the set F, the optimal v alue of the SSIM index maximizing (8)iscalculated.
(iii) The best matched patch, whose maximized SSIM index is larger than those of the other patches in F,
is selected as g
t
. Furthermore, this patch is removed from F and added to G.
(iv) t
← t + 1, and the matrix Y
(t−1)
(∈ R
wh×(t−1)
) is constructed from the vectors of the patches belonging to G.
(v) The procedures (ii)–(iv) are repeated until t
= M.Ift = M, G ={g
1
, g
2
, , g
M
} outputs M optimal known patches.
Algorithm 1: Specific procedures to select M optimal known patches g
j
( j = 1, 2, , M) for the target patch f based on the SSIM index.
In the above equation, SSIM(y, Ya )isdefinedas
SSIM
y, Ya
=
⎡
⎣
2μ
y
((
1/N
Ω
)
1
Ya
)
+ C
1
μ
2
y
+
((
1/N
Ω
)
1
Ya
)
2
+ C
1
⎤
⎦
×
⎡
⎢
⎣
(
2/N
Ω
)
y − μ
y
1
(
Ya
−
(
1/N
Ω
)
11
Ya
)
+ C
2
σ
2
y
+
(
1/N
Ω
)
Ya −
(
1/N
Ω
)
11
Ya
2
+ C
2
⎤
⎥
⎦
=
2μ
y
µ
Y
a + C
1
μ
2
y
+ a
µ
Y
µ
Y
a + C
1
×
⎡
⎢
⎣
(
2/N
Ω
)
y − μ
y
1
Ya − 1µ
Y
a
+ C
2
σ
2
y
+
(
1/N
Ω
)
Ya − 1µ
Y
a
2
+ C
2
⎤
⎥
⎦
(13)
in the same way as (9), where
µ
Y
=
1
N
Ω
Y
1 (14)
is an M
× 1 vector whose elements are the means of y
j
( j =
1, 2, , M)inY.
It should be noted that the criterion SSIM(y, Ya)defined
in (13) is a nonconvex function of a, and it is difficult to
obtain its global optimal solution. Therefore, we introduce
the calculation scheme utilized in [31] into the estimation
of the optimal vector
a. Specifically, the above nonconvex
problem is transformed into a quasiconvex formulation.
First, we note that the first term in (13) is a function only
of µ
Y
a(=ρ). Thus, (13) can be rewritten as follows:
SSIM
y, Ya
=
2μ
y
ρ + C
1
μ
2
y
+ ρ
2
+ C
1
×
⎡
⎣
(
2/N
Ω
)
y − μ
y
1
Ya − ρ1
+ C
2
σ
2
y
+
(
1/N
Ω
)
Ya − ρ1
2
+ C
2
⎤
⎦
=
2μ
y
ρ + C
1
μ
2
y
+ ρ
2
+ C
1
×
⎡
⎢
⎢
⎣
2
y − μ
y
1
Ya +
N
Ω
C
2
− 2ρ
y − μ
y
1
1
a
Y
Ya − 2ρ1
Ya + N
Ω
σ
2
y
+ C
2
+ ρ
2
⎤
⎥
⎥
⎦
=
2μ
y
ρ + C
1
μ
2
y
+ ρ
2
+ C
1
k
2
a +
2
a
Ka − k
1
a +
1
,
(15)
where
K
= Y
Y,
k
1
= 2ρY
1,
k
2
= 2Y
y − μ
y
1
,
1
= N
Ω
σ
2
y
+ C
2
+ ρ
2
,
2
= N
Ω
C
2
− 2ρ
y − μ
y
1
1.
(16)
Then we can simplify the optimization problem by con-
straining µ
Y
a = ρ. Specifically, the optimization problem can
be simplified to find
a
ρ
= arg max
a∈R
M
k
2
a +
2
a
Ka − k
1
a +
1
subject to µ
Y
a = ρ.
(17)
Therefore, the overall problem is to find the highest
SSIM index by searching over a range of ρ. Furthermore,
since the optimization problem in (17) is still nonconvex,
it is converted into a quasiconvex optimization problem as
follows:
a
ρ
= arg max
a∈R
M
k
2
a +
2
a
Ka − k
1
a +
1
subject to µ
Y
a = ρ,
⇐⇒
6 EURASIP Journal on Advances in Signal Processing
(a) (b) (c)
(d) (e) (f)
(g) (h) (i)
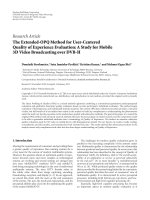
Figure 2: (a) Original image (480 × 359 pixels, 24-bit color levels). (b) Flag image whose white regions correspond to missing areas. (c)
Corrupted image including text regions (8.9% loss), (d) Reconstructed image by the proposed method. (e) Reconstructed image by the
method based on the random selection. (f) Reconstructed image by the method which utilizes the MSE instead of the SSIM index. (g)
Reconstructed image by the conventional method [11]. (h) Reconstructed image by the conventional method [13]. (i) Reconstructed image
by the conventional method [21].
min : τ
subject to
⎡
⎢
⎢
⎣
max :
k
2
a +
2
a
Ka − k
1
a +
1
≤
τ
subject to µ
Y
a = ρ
⎤
⎥
⎥
⎦
,
⇐⇒
min : τ
subject to
⎡
⎣
min:
τ
(
a
Ka − k
1
a +
1
)
−
(
k
2
a +
2
)
≥
0
subject to µ
Y
a = ρ
⎤
⎦
.
(18)
The first equivalence relationship holds since minimizing τ
is the same as finding the least upper bound of (17). The
second equivalence relationship holds since the denominator
in (17) is strictly positive, allowing us to multiply through
and rearrange terms. Then τ becomes a true upper bound if
the problem
⎡
⎣
max
a∈R
M
τ
(
a
Ka − k
1
a +
1
)
−
(
k
2
a +
2
)
subject to µ
Y
a = ρ
⎤
⎦
(19)
has a non-negative optimal value, and the optimal vector
a(ρ)in(17) can be obtained. Specifically, the proposed
method utilizes the following Lagrange multiplier approach:
∇
a
τ
a
Ka − k
1
a +
1
−
k
2
a +
2
+ λ
µ
Y
a − ρ
=
0.
(20)
EURASIP Journal on Advances in Signal Processing 7
(a) (b) (c)
(d) (e) (f)
(g) (h) (i)
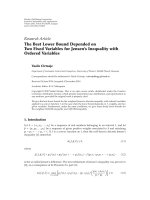
Figure 3: (a) Zoomed portion of Figure 2(a). (b) Zoomed portion of Figure 2(b), (c) Zoomed portion of Figure 2(c), (d) Zoomed portion of
Figure 2(d), (e) Zoomed portion of Figure 2(e), (f) Zoomed portion of Figure 2(f), (g) Zoomed portion of Figure 2(g), (h) Zoomed portion
of Figure 2(h), (i) Zoomed portion of Figure 2(i).
By solving for a and λ,wecanobtain
a
ρ
=
1
2τ
K
+
τk
1
+ k
2
− λ
ρ
µ
Y
,
λ
ρ
=
1
µ
Y
K
+
µ
Y
µ
Y
K
+
(
τk
1
+ k
2
)
− 2τρ
,
(21)
where we denote them as a(ρ)andλ(ρ) since they depend
on ρ. Furthermore, in the above two equations, K
+
is
a Moore-Penrose pseudoinverse matrix of K. Then the
proposed method estimates the optimal value of τ by using
a standard bisection procedure, a nd the optimal vectors
a(ρ)
are calculated for several values of ρ (
= μ
y
− Rδ, , μ
y
−
2δ, μ
y
−δ, μ
y
, μ
y
+δ, μ
y
+2δ, , μ
y
+Rδ) to select a maximizing
(13), where δ is a step size and R determines the search range
of ρ. Algorithm 2 shows the details on the estimation of τ in
the proposed method.
Note that the algorithm for calculating the optimal linear
combination in this subsection provides better solutions
than those in the previous subsection. However, this algo-
rithm needs to perform 2R + 1 iterations to determine the
value of ρ. Furthermore, it also needs the iteration to search
the optimal value of τ as shown in Algorithm 2 . Then since
it is confirmed that the algorithm shown in this subsection
takes more computation time compared to the algorithm
shown in the previous subsection, we perform the selection
of the optimal M known patches g
j
( j = 1,2, , M)as
shown in the previous subsection.
By utilizing the coefficient vector
a, the estimation result
x of the unknown vector x whose elements are the intensities
within f is calculated as follows:
x = Xa, (22)
where X is a matrix whose columns are
x
j
( j = 1, 2, , M).
Finally, from the obtained result
x, the proposed method
outputs the estimated intensities in the missing area Ω.
As described above, we can reconstruct the missing
texture in the target patch. The proposed method clips
patches (w
× h pixels) at the same interval from the upper-
left of the target image in a rasterscanning order. If the
clipped patches contain missing areas, we regard them as
the target patches f and reconstruct them by using the
aboveapproach.Notethateachrestoredpixelhasmultiple
estimation results if the clipping interval is smaller than
the size of the patches. In this case, the proposed method
regards the result maximizing (13) as the final one. The
proposed method does not utilize the already obtained
results for reconstructing other missing areas. Therefore, the
performance of the proposed method does not depend on
the order of the reconstruction, that is, the positions of the
patches including missing areas do not influence the results.
8 EURASIP Journal on Advances in Signal Processing
(i) An initial value of τ (say τ
0
) is determined between. zero to one. Furthermore, U
τ
= 1.0
and L
τ
= τ
0
,whereU
τ
and L
τ
, respectively, represent the upper
limit and the lower limit of τ. In this paper, we set τ
0
= 0.2
(ii) The optimization problem in (19) is solved by using τ.
(iii) Two criteria C
τ
and D
τ
are calculated as
C
τ
= τ(a
Ka − k
1
a +
1
) − (k
2
a +
2
),
D
τ
= U
τ
− L
τ
.
(iv) According to the obtained criteria C
τ
and D
τ
, the following steps are operated:
(a) If C
τ
≥ 0andD
τ
< , the final optimal solution of τ is output, where = 0.05.
(b) If C
τ
≥ 0butD
τ
≥
, τ = (U
τ
+ L
τ
)/2andU
τ
= τ.
(c) Otherwise, τ
= (U
τ
+ L
τ
)/2andL
τ
= τ.
(v) The procedures (ii)–(iv) are iterated.
Algorithm 2: Specific procedures to search the optimal τ in the proposed method.
4. Experimental Results
The performance of the proposed method is shown in this
section. Figure 2(a) is a test texture image (480
× 359 pixels,
24-bit color levels), and from the flag image shown in
Figure 2(b), a corrupted image, which includes text regions
“Grand Canyon” as missing areas, is obtained as shown
in Figure 2(c)(Note that positions of the missing areas are
previously provided in this experiment.) Figure 2(d) shows
the results of reconstruction by the proposed method. In this
experiment, we set the parameters of the proposed method
as follows: w
= 40, h = 30, δ = 5, R = 6, C
1
= (0.01L)
2
,
C
2
= (0.03L)
2
,whereL is the maximum value of intensities,
and the clipping interval of patches is 10 and 8. The size
of patches influences the reconstruction results. If the size
of patches becomes smaller, the representation performance
of their textures becomes better. However, these patches
including missing areas must contain known intensities to
select the optimal M known patches in Sec tion 3.1 and
estimate the vector
a in Section 3.2. Thus, the size of patches
should be determined in such a way that they necessarily
contain several known intensities. In this experiment, we
determine w
= 40 and h = 30 to satisfy the above condition.
Furthermore, the clipping interval is set to about quarter size
of w and h, that is, the horizontal and vertical intervals are,
respectively,setto10and8.Next,δ
= 5andR = 6mean
that the search range of ρ in the proposed method is from
μ
y
− 30 to μ
y
+ 30. From preliminary experiments, ρ = µ
Y
a
tends not to become smaller than μ
y
− 30 or larger than
μ
y
+30.Thus,wesettherangeofρ as shown above. The
parameters C
1
and C
2
are determined in the same way as
[30].
For comparison, Figures 2(e)–2(i), respectively, show the
results obtained by the method which selects M known
patches randomly but reconstructs missing areas in the
same way as Section 3.2, the method which utilizes the
MSE instead of the SSIM index, the exemplar-based texture
reconstruction method [11], the PCA-based texture recon-
struction method [13], and the method based on sparse
representation [21]. In order to verify the effectiveness of
the selection algorithm shown in Section 3.1, we show the
results in Figure 2(e). The method in [11] is one of the
most influential works in the field of the exemplar-based
texture reconstruction, and we utilize this method for the
comparison of the proposed method as shown in Figure 2(g).
Furthermore, since subspaces optimized on the basis of the
MSE criterion are utilized for the reconstruction of missing
textures, the other conventional methods shown in Figures
2(f), 2(h),and2(i) are suitable for verifying the performance
of the proposed method. Particularly, the methods in [13, 21]
are, respectively, representative works using PCA and sparse
representation.
Note that the dimensions of the subspaces utilized in
the proposed method and the conventional methods are
set to the same value 40 (
= M). In the proposed method,
we have to set M to a smaller value than the number of
known pixels within the target patch f . Furthermore, this
should be satisfied for all target patches including missing
areas within the target image. Otherwise, the calculation of
the optimal vector
a in (11)and(12) generally becomes an
underdetermined problem. T his means we have to set M to
asufficiently small value in order to avoid the problem in
(12), being an underdetermined problem. Generally, if M
becomes larger than the number of the known pixels in f ,
some constraints must be introduced as regularization terms
for avoiding the system instability. Furthermore, if there is no
limitation of the cost function utilized for the reconstruction,
some constraints must be also adopted. Several existing
studies for inpainting using a linear combination of patches
adopt some restrictions such as the sum of the linear
coefficients being one [35], and so forth. On the other hand,
our method sets the value of M to a much smaller value
than the number of known pixels within the target patch
f , and the maximum range of the SSIM index is limited to
one. Thus, since the system is not instable in (12), we think
that our method does not have to utilize other restrictions.
Furthermore, it seems that the value of M should be set
to about one-tenth of the dimension of x.Thismeanswe
assume the percentages of the known pixels within the target
patches f are larger than 10%. In the experiments, we set M
to 40, that is, a much smal ler value than the above criterion
to clearly show the difference of the reconstruction perfor-
mance between the proposed method and the conventional
methods.
EURASIP Journal on Advances in Signal Processing 9
(a) (b) (c)
(d) (e) (f)
(g) (h) (i)
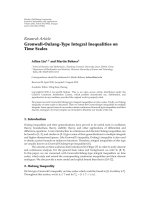
Figure 4: (a) Original image (480 × 360 pixels, 24-bit color levels). (b) Flag image whose white regions correspond to missing areas. (c)
Corrupted image including text regions (10.7% loss). (d) Reconstructed image by the proposed method. (e) Reconstructed image by the
method based on the random selection. (f) Reconstructed image by the method which utilizes the MSE instead of the SSIM index. (g)
Reconstructed image by the conventional method [11]. (h) Reconstructed image by the conventional method [13]. (i) Reconstructed image
by the conventional method [21].
For better subjective evaluation, the enlarged por tions
around the upper left of the images are shown in Figure 3.It
can be seen that the use of the proposed method has achieved
noticeable improvements compared to the conventional
methods. From the results in Figures 3(d) and 3(e), the
effectiveness of the algorithm for selecting the optimal M
known patches in Section 3.1 can be confirmed. Different
experimental results are shown in Figures 4, 5, 6,and
7. Compared to the results obtained by the conventional
methods, it can be seen that various kinds of textures
are accurately restored by using the proposed method.
Therefore, high performance of the proposed method was
verified by the experiments.
In order to confirm the superiority of the SSIM index for
evaluating visual qualities, we show the MSE and the SSIM
index of the reconstruction results in Tables 1 and 2.It
can be seen that our method has achieved improvement
over the conventional methods in the SSIM index. Although
the MSEs of the proposed method tend to become worse
than those of the conventional methods, we can see that the
MSE results cannot correctly reflect the visual quality in the
subjective evaluation. On the other hand, the SSIM index can
represent the visual quality more accurately. Therefore, we
can conclude that the use of the SSIM index as a visual quality
measure is appropriate for texture reconstruction.
In the conventional methods, the subspace estimation
and texture reconstruction schemes are based on the MSE
criterion. However, the MSE optimal algorithms do not
necessarily produce images of high visual quality, and the
reconstruction results may be degraded. Specifically, it is
10 EURASIP Journal on Advances in Signal Processing
Table 1: Performance comparison (MSE) of the proposed method and the conventional methods.
Test image Random Selection MSE-based method Reference [11]Reference[13]Reference[21] Proposed method
Figure 2 155.27 95.97 208.94 174.94 138.11 153.70
Figure 4 170.91 116.11 224.23 167.96 169.26 173.19
Figure 6 123.44 105.96 170.73 110.65 121.73 127.28
(a) (b) (c)
(d) (e) (f)
(g) (h) (i)
Figure 5: (a) Zoomed portion of Figure 4(a). (b) Zoomed portion of Figure 4(b). (c) Zoomed portion of Figure 4(c). (d) Zoomed portion of
Figure 4(d). (e) Zoomed portion of Figure 4(e). (f) Zoomed portion of Figure 4(f). (g) Zoomed portion of Figure 4(g). (h) Zoomed portion
of Figure 4(h). (i) Zoomed portion of Figure 4(i).
well known that most images contain more low-frequency
components than high-frequency components. Thus, mod-
els using the subspaces based on the MSE can only represent
such low-frequency components, and it becomes difficult to
reconstruct the missing high-frequency components of the
missing areas. This means the reconstruction results tend to
be blurred. Then since the representation performance, that
is, the reconstruction performance of each patch, becomes
worse, the color discontinuities at the border of the missing
areas and that of patches also occurs. On the other hand,
the proposed method adopts the SSIM index for obtaining
subspaces and reconstructing missing textures. The basic
formulation of the SSIM index is obtained from the three
terms l(x, y), c(x, y), and s(x, y) as shown in (1). These
terms respectively represent the mean similarity, the variance
similarity, and the structural correlation. The first term
l(x, y) and the third term s(x, y) compare the vector lengths
and ang les, and they separately provide those similarities.
Note that the second term c(x, y) compares the contrast of
the two vectors, that is, it enables the comparison of the
texture roughness. Therefore, this c an be regarded as the
term comparing how much high-frequency components the
target textures contain. This is also pointed out in [34],
and they confirmed that the SSIM index of blurred images
which were perceptually degraded severely became lower.
Then it seems that the proposed method can avoid the
oversmoothness of the reconstruction results by utilizing
the SSIM index including the above useful term. Since
the SSIM index outperforms the MSE as a perceptual
distortion measure, our method can provide the solution
to the conventional problems and realize more accurate
reconstruction.
Finally, we show the computation time of the proposed
method. The experiments shown above were performed on
a personal computer using Intel(R) Core(TM) i7 950 CPU
3.06GHzwith8.0GbytesRAM.Theproposedmethodwas
implemented by using Matlab. The average computation
times to perform the algorithms shown in Sections 3.1 and
3.2 for each target patch are, respectively, 9.99
× 10
2
sec and
2.65
× 10
−2
sec. Thus, from these results, we can see that the
reduction of the computational cost in the optimal patch
selection algorithm of the proposed method is necessary
for practical use. This issue will be addressed in a future
work.
EURASIP Journal on Advances in Signal Processing 11
Table 2: Performance comparison (SSIM) of the proposed method and the conventional methods.
Test image Random Selection MSE-based method Reference [11]Reference[13]Reference[21] Proposed method
Figure 2 0.9250 0.9421 0.9273 0.9257 0.9324 0.9435
Figure 4 0.9069 0.9253 0.9263 0.9134 0.9202 0.9403
Figure 6 0.9046 0.9154 0.9202 0.9137 0.9119 0.9361
(a) (b) (c)
(d) (e) (f)
(g) (h) (i)
Figure 6: (a) Original image (480 × 360 pixels, 24-bit color levels). (b) Flag image whose white regions correspond to missing areas. (c)
Corrupted image including text regions (11.9% loss). (d) Reconstructed image by the proposed method. (e) Reconstructed image by the
method based on the random selection. (f) Reconstructed image by the method which utilizes the MSE instead of the SSIM index. (g)
Reconstructed image by the conventional method [11]. (h) Reconstructed image by the conventional method [13]. (i) Reconstructed image
by the conventional method [21].
5. Conclusions
In this paper, we have presented an adaptive method for
reconstructing missing textures based on the SSIM index.
The proposed method adaptively obtains subspaces utilized
for the reconstruction of missing textures by selecting the
optimal known local textures based on the SSIM index.
Furthermore, missing texture reconstruction maximizing the
SSIM index can be realized by reformulating the nonconvex
problem as a quasi convex problem. Then the proposed
method enables adaptive texture reconstruction based on the
perceptually optimized algorithm. Consequently, impressive
12 EURASIP Journal on Advances in Signal Processing
(a) (b) (c)
(d) (e) (f)
(g) (h) (i)
Figure 7: (a) Zoomed portion of Figure 6(a). (b) Zoomed portion of Figure 6(b). (c) Zoomed portion of Figure 6(c). (d) Zoomed portion of
Figure 6(d). (e) Zoomed portion of Figure 6(e). (f) Zoomed portion of Figure 6(f). (g) Zoomed portion of Figure 6(g). (h) Zoomed portion
of Figure 6(h). (i) Zoomed portion of Figure 6(i).
improvement of the proposed method over previously
reported methods was confirmed.
In the experiments, we manually determine the param-
eters of the proposed method. It is desirable that these
parameters be adaptively determined from the target image.
Thus, we need to complement this determination algorithm.
Extension of the framework to texture reconstruction of
other types of missing imagery data is also needed for various
applications. Finally, we would like to study these ideas for
interpolation in video data. These topics will be the subjects
of subsequent reports.
Acknowledgment
This work was partly supported by Grant-in-Aid for Scien-
tific Research (B) 21300030, Japan Society for the Promotion
of Science (JSPS).
References
[1] M. Bertalmio, L. Vese, G. Sapiro, and S. Osher, “Simultaneous
structure and texture image inpainting,” IEEE Transactions on
Image Processing, vol. 12, no. 8, pp. 882–889, 2003.
[2] S. D. Rane, G. Sapiro, and M. Bertalmio, “Structure and tex-
ture filling-In of missing image blocks in wireless transmission
and compression applications,” IEEE Transactions on Image
Processing, vol. 12, no. 3, pp. 296–303, 2003.
[3] C. Ballester, M. Bertalmio, V. Caselles, G. Sapiro, and J.
Verdera, “Filling-in by joint interpolation of vector fields and
gray levels,” IEEE Transactions on Image Processing, vol. 10, no.
8, pp. 1200–1211, 2001.
[4] T. F. Chan and J. Shen, “Nontexture inpainting by curvature-
driven diffusions,” Journal of Visual Communication and Image
Representation, vol. 12, no. 4, pp. 436–449, 2001.
[5] A. Rares¸, M. J. T. Reinders, and J. Biemond, “Edge-based image
restoration,” IEEE Transactions on Image Processing, vol. 14, no.
10, pp. 1454–1468, 2005.
EURASIP Journal on Advances in Signal Processing 13
[6] A. A. Efros and T. K. Leung, “Texture synthesis by non-
parametric sampling,” in Proceedings of the 1999 7th IEEE
International Conference on Computer Vision (ICCV’99),pp.
1033–1038, September 1999.
[7]A.A.EfrosandW.T.Freeman,“Imagequiltingfortexture
synthesis and transfer,” in Proceedings of the Computer Graph-
ics Annual Conference (SIGGRAPH ’01), pp. 341–346, August
2001.
[8] L Y. Wei and M. Levoy, “Fast texture synthesis using
tree-structured vector quantization,” in Proceedings of the
ACM SIGGRAPH Conference on Computer Graphics (SIG-
GRAPH ’00), K. Akeley, Ed., pp. 479–488, ACM Press / ACM
SIGGRAPH / Addison Wesley Longman, 2000.
[9] I. Drori, D. Cohen-Or, and H. Yeshurun, “Fragment-based
image completion,” in Proceedings of the ACM SIGGRAPH
2003 Papers (SIGGRAPH ’03), pp. 303–312, ACM Press, New
York, NY, USA, 2003.
[10] A. Criminisi, P. P
´
erez, and K. Toyama, “Object removal
by exemplar-based inpainting,” in Proceedings of the IEEE
Computer Society Conference on Computer Vision and Pattern
Recognition, pp. 721–728, June 2003.
[11] A. Criminisi, P. P
´
erez, and K. Toyama, “Region filling and
object removal by exemplar-based image inpainting,” IEEE
Transactions on Image Processing, vol. 13, no. 9, pp. 1200–1212,
2004.
[12] I. B. Fidaner, “A survey on variational image inpainting
texture synthesis and image completion,” ibd
doc/3012627/A-Survey-on-Variatinal-Image-Inpainting-
Texture-Synthesis-and-Image-Completion.
[13] T. Amano and Y. Sato, “Image interpolation using BPLP
method on the eigenspace,” Systems and Computers in Japan,
vol. 38, no. 1, pp. 87–96, 2007.
[14] B. Sch
¨
olkopf, S. Mika, C. J. C. Burges et al., “Input space versus
feature space in kernel-based methods,” IEEE Transactions on
Neural Networks, vol. 10, no. 5, pp. 1000–1017, 1999.
[15] S. Mika, B. Sch
¨
olkoph, A. Smola, K R. M
¨
uller, M. Scholz, and
G. R
¨
atsch, “Kernel PCA and de-noising in feature spaces,” in
Proceedings of the conference on Advances in Neural Information
Processing Systems II, pp. 536–542, 1999.
[16] K. I. Kim, M. O. Franz, and B. Sch
¨
olkopf, “Iterative kernel
principal component analysis for image modeling,” IEEE
Transactions on Pattern Analysis and Machine Intelligence, vol.
27, no. 9, pp. 1351–1366, 2005.
[17] T. Ogawa and M. Haseyama, “POCS-based texture reconstruc-
tion method using clustering scheme by kernel PCA,” IEICE
Transactions on Fundamentals of Electronics, Communications
and Computer Sciences, vol. 90, no. 8, pp. 1519–1527, 2007.
[18] T. Ogawa and M. Haseyama, “Adaptive missing texture
reconstruction method based on kernel canonical correlation
analysis with a new clustering scheme,” IEICE Transactions.
Fundamentals, vol. 92, no. 8, pp. 1950–1960, 2009.
[19] M. Aharon, M. Elad, and A. Bruckstein, “K-SVD: an algorithm
for designing overcomplete dictionaries for sparse representa-
tion,” IEEE Transactions on Signal Processing, vol. 54, no. 11,
pp. 4311–4322, 2006.
[20] M. Elad and M. Aharon, “Image denoising via sparse and
redundant representations over learned dictionaries,” IEEE
Transactions on Image Processing, vol. 15, no. 12, pp. 3736–
3745, 2006.
[21] J. Mairal, M. Elad, and G. Sapiro, “Sparse representation
for color image restoration,” IEEE Transactions on Image
Processing, vol. 17, no. 1, pp. 53–69, 2008.
[22] B. Wohlberg, “Inpainting with sparse linear combinations of
exemplars,” in Proceedings of the IEEE International Conference
on Acoustics, Speech, and Signal Processing (ICASSP ’09),pp.
689–692, April 2009.
[23] B. Shen, W. Hu, Y. Zhang, and Y J. Zhang, “Image inpainting
via sparse representation,” in Proceedings of the IEEE Interna-
tional Conference on Acoustics, Speech, and Signal Processing
(ICASSP ’09), pp. 697–700, April 2009.
[24] B. Girod, “What’s wrong with mean-squared error?” in Digital
Images and Human Vision, A. B. Watson, Ed., pp. 207–220,
MIT Press, Cambridge, Mass, USA, 1993.
[25] M. Miyahara, K. Kotani, and V. R. Algazi, “Objective picture
quality scale (PQS) for image coding,” IEEE Transactions on
Communications, vol. 46, no. 9, pp. 1215–1226, 1998.
[26] N. Damera-Venkata, T. D. Kite, W. S. Geisler, B. L. Evans, and
A. C. Bovik, “Image quality assessment based on a degradation
model,” IEEE Transactions on Image Processing, vol. 9, no. 4, pp.
636–650, 2000.
[27] H. R. Sheikh, A. C. Bovik, and G. de Veciana, “An information
fidelity criterion for image quality assessment using natural
scene statistics,” IEEE Transactions on Image Processing, vol. 14,
no. 12, pp. 2117–2128, 2005.
[28] H. R. Sheikh and A. C. Bovik, “Image information and visual
quality,” IEEE Transactions on Image Processing, vol. 15, no. 2,
pp. 430–444, 2006.
[29] H. R. Sheikh, M. F. Sabir, and A. C. Bovik, “A statistical
evaluation of recent full reference image quality assessment
algorithms,” IEEE Transactions on Image Processing, vol. 15, no.
11, pp. 3440–3451, 2006.
[30] Z. Wang, A. C. Bovik, H. R. Sheikh, and E. P. Simoncelli,
“Image quality assessment: from error visibility to structural
similarity,” IEEE Transactions on Image Processing, vol. 13, no.
4, pp. 600–612, 2004.
[31] S. S. Channappayya, A. C. Bovik, C. Caramanis, and R.
W. Heath Jr., “Design of linear equalizers optimized for
the structural similarity index,” IEEE Transactions on Image
Processing, vol. 17, no. 6, pp. 857–872, 2008.
[32] S. G. Mallat and Z. Zhang, “Matching pursuits with time-
frequency dictionaries,” IEEE Transactions on Signal Process-
ing, vol. 41, no. 12, pp. 3397–3415, 1993.
[33] Y. C. Pati, R. Rezaiifar, and P. S. Krishnaprasad, “Orthogonal
matching pursuit: recursive function approximation with
applications to wavelet decomposition,” in Proceedings of the
27th Asilomar Conference on Signals, Systems & Computers, vol.
1, pp. 40–44, November 1993.
[34] Z. Wang and A. C. Bovik, Modern Image Quality Assessment,
Morgan & Clayp ool, San Rafael, Calif, USA, 2006.
[35] P. Arias, V. Caselles, and G. Sapiro, “A variational framework
for nonlocal image inpainting,” in Proceedings of the Energy
Minimization Methods in Computer Vision and Pattern Recog-
nition (EMMCVPR ’09), pp. 345–358, 2009.