Báo cáo hóa học: " Research Article Validity-Guided Fuzzy Clustering Evaluation for Neural Network-Based Time-Frequency Reassignment" potx
Bạn đang xem bản rút gọn của tài liệu. Xem và tải ngay bản đầy đủ của tài liệu tại đây (1.56 MB, 14 trang )
Hindawi Publishing Corporation
EURASIP Journal on Advances in Signal Processing
Volume 2010, Article ID 636858, 14 pages
doi:10.1155/2010/636858
Research Article
Validity-Guided Fuzzy Clustering Evaluation for Neural
Network-Based Time-Frequency Reassignment
Imran Shafi,1 Jamil Ahmad,1 Syed Ismail Shah,1 Ataul Aziz Ikram,1
Adnan Ahmad Khan,2 and Sajid Bashir3
1 Information
and Computing Department, Iqra University, Islamabad Campus, Sector H-9, Islamabad 44000, Pakistan
Engineering Department, College of Telecommunication Engineering, National University of Sciences and Technology,
Islamabad 44000, Pakistan
3 Computer Engineering Department, Centre for Advanced Studies in Engineering, Islamabad 44000, Pakistan
2 Electrical
Correspondence should be addressed to Imran Shafi, imran.shafi@gmail.com
Received 1 March 2010; Revised 21 May 2010; Accepted 15 July 2010
Academic Editor: Srdjan Stankovic
Copyright © 2010 Imran Shafi et al. This is an open access article distributed under the Creative Commons Attribution License,
which permits unrestricted use, distribution, and reproduction in any medium, provided the original work is properly cited.
This paper describes the validity-guided fuzzy clustering evaluation for optimal training of localized neural networks (LNNs) used
for reassigning time-frequency representations (TFRs). Our experiments show that the validity-guided fuzzy approach ameliorates
the difficulty of choosing correct number of clusters and in conjunction with neural network-based processing technique utilizing
a hybrid approach can effectively reduce the blur in the spectrograms. In the course of every partitioning problem the number of
subsets must be given before the calculation, but it is rarely known apriori, in this case it must be searched also with using validity
measures. Experimental results demonstrate the effectiveness of the approach.
1. Introduction
Clustering is important for pattern recognition, classification, model reduction, and optimization. Cluster analysis
plays a pivotal role in solving practical issues related to image
and signal processing, bioengineering, medical science, and
psychology [1]. The problem of clustering is to partition the
data in a given finite data set into a number of appropriate
relevant groups. The data can be quantitative, qualitative,
or a mixture of both. In classical cluster analysis, these
groups are required to form a partition such that the degree
of the association is strong for the objects falling in a
particular group than to members of other groups. The
term “association” or “similarity” is mathematical similarity,
measured in some well-defined sense [2]. Moreover, finding
out the appropriate number of groups for a particular data
set is also a quantitative task. Different classifications based
on the algorithmic approach of the clustering techniques,
include the partitioning, hierarchical, graph-theoretic, and
objective function-based methods [3].
Localized neural processing is considered important due
to numerous reasons. Firstly it is a well-known fact that
different parts of the human brain are designated to perform
different tasks [4]. The nature of the task imposes certain
structure for the region resulting in a structure-function
correspondence. Also, different regions in the brain compete
to perform a task and the task is assigned to the winning
region. Mimicking the behavior of brain, artificial neural
networks (ANNs) may also be employed based on these
arguments. An image contains structural information with
low and high-frequency contents with a blurred version
losing most of its high-frequency information. The objective
of any deblurring system is to restore this information
by gaining sufficient knowledge about the blur function.
However, information is generally lost at various scales in
different regions, which must be taken into account [5].
For example, the edges and the flat regions are blurred
simultaneously but at the different rate. This favours the idea
of subdividing the data into appropriate groups. A second
reason is the problem of overtraining for the ANN which
causes loss of the generalization ability. If only a single ANN
is used, it may end up memorising the training data and
may adjust its weights to any noise. Yet another reason is
specific to the case of image processing, that is, if an ANN is
2
trained by an entire image containing different distribution
characteristics for data corresponding to different structures
in the image. It may attempt to represent different structures
by finding a common ground between the different data
distributions and thus limits the recognition ability of the
network. This forces one network to learn distant input
patterns, causing training to slow down in attempting to
represent input data that are significantly different [6].
During the last decade there has been spectacular growth
in the volume of research on studying and processing
the signals with time-dependant spectral content. For such
signals we need techniques that can show the variation
in the frequency of the signal over time. Although some
of the methods may not result in a proper distribution,
these techniques are generally known as time-frequency
distributions (TFDs). The TFDs are aimed to obtain the
temporal and spectral information of the nonstationary
signals with high-resolution without any potential interference [7]. These characteristics are necessary for an easy
visual interpretation and a good discrimination between
known patterns for nonstationary signal classification tasks
[8]. They were partly addressed by the development of the
Choi-Williams distribution (CWD) [9], followed by many
other advanced techniques. Concept of scale is also used
by some authors as another time-varying signal analysis
tool rather than frequency, such as the scalogram [10], the
affine smoothed pseudo-Wigner-Ville distribution (WVD)
[11], or the Bertrand distribution [12]. Some TFDs are
proposed to adapt to the signal time-frequency (t-f) changes.
The example of such adaptive TFDs includes the classical
work by Flandrin et al. in the form of the reassigned TFDs
[13], and by Jones et al. in the form of the high-resolution
TFD [14], the signal-adaptive optimal-kernel TFD [15], and
the optimal radially Gaussian kernel TFD [16]. For the
analysis of signals with varying IF, higher-order distributions
are used [17, 18]. There are some newer techniques based
on nonparametric snakes for the reassignment of TFDs
[7], neural networks [19], sparsity constraint of energy
distribution [20], and t-f autoregressive moving-average
spectral estimation [21] to improve the resolution in the tf domain. A comparison of high-resolution TFDs for test
signals can be found in [22]. In order to provide an accurate
IF estimation even when the signal phase varies significantly
within a few signal samples, the distributions with complex
lag argument have been introduced [23–25] and improved
[26, 27].
The neural network-based method fundamentally
involves training and selection of a set of suitably chosen
ANNs that provide the improved TFDs (NTFDs) in the
testing phase [28]. The vectors from the training t-f images
are required to be clustered. The determination of the
optimum cluster number is important due to localized
neural processing for the reasons mentioned earlier. The
goal of this paper is to evaluate fuzzy clustering to achieve
this task automatically based on cluster validity measures
and more efficiently by checking quality of clustering
results. Fuzzy clustering methods allow objects to belong
to several clusters simultaneously, with different degrees of
membership. It is believed that, in many factual situations,
EURASIP Journal on Advances in Signal Processing
fuzzy clustering is more intuitive choice than hard clustering.
It is so because data vectors on the boundaries between two
clusters are assigned membership degrees between 0 and
1 indicating their partial memberships. On the contrary,
the analytic functions defined for hard clustering methods
are not differentiable due to their discrete nature, causing
analytical and algorithmic intractability of algorithms.
A detailed treatment of the subject can be found in the
classical attempt by Bezdek [29], Hopner [2], and Babuska
[30].
The objective of this work is to explore the effectiveness
of the fuzzy clustering for Bayesian regularized neural
network model to obtain high-resolution reassigned TFDs.
No assumption is made about any prior knowledge about the
components present in the signal. The goal of the proposed
neurofuzzy reassignment method is to get a high-resolution
TFD which can provide an easy visual interpretation and
a good discrimination between known patterns for nonstationary signal classification tasks. The rest of the paper is
structured as follows. Section 2 gives a brief review of some
popular related fuzzy clustering algorithms, various scalar
validity measures, and some information theoretic criteria.
We also suggest a modification in an existing instantaneous
concentration measure that can provide TFDs’ performance
in a more efficient manner. Section 3 introduces the method
proposed in this paper, combining fuzzy clustering with
neural networks to achieve high concentration and good
resolution on the t-f plane. This hybrid method enables us
to determine the optimal number of clusters for localized
neural network processing searched using various cluster
validity measures and checking the quality of clustering
results. Section 4 presents the results of applying the
proposed method to both synthetic and real-life signals. The
discussion on the determination of the optimal number of
the cluster using the validity measures is also given in this
section. Finally, Section 5 concludes the paper and discusses
the major contribution.
2. Background
The main potential of clustering is to detect the underlying
structure in data, not only for classification and pattern
recognition, but for model reduction and optimization. For
this reason data vectors are divided into clusters such that
similar vectors belong to the same cluster. The resulting
data partitioning is expected to improve data understanding
by the ANN by avoiding learning distant input patterns.
Fuzzy clustering approaches assign different degrees of
membership to data vectors associating them to several
clusters simultaneously. In real applications there is hardly
a sharp boundary between clusters, and fuzzy clustering is
often better suited for the data. In this way, data on the
boundaries between several clusters are not forced to belong
to one of the clusters.
2.1. Fuzzy Clustering Algorithms. The objective of clustering
is to partition the finite data set Q = [q1 , q2 , . . . , qN ] into c
clusters where 2 ≤ c < N. The value of c is assumed to be
known a priori, or it is a trial value to be validated [29]. The
EURASIP Journal on Advances in Signal Processing
3
structure of the partition matrix Λ = [λik ]:
⎛
⎞
λ1,1 λ1,2 · · · λ1,c
⎜λ
⎟
⎜ 2,1 λ2,2 · · · λ2,c ⎟
Λ=⎜ .
.
. ⎟.
..
⎜ .
.
. ⎟
.
⎝ .
.
. ⎠
λN,1 λN,2 · · · λN,c
(1)
Fuzzy partition allows λik to attain real values in [0, 1]. A N ×
c matrix represents the fuzzy partitions, with the following
conditions:
λik ∈ [0, 1],
c
k=1
0<
1 ≤ i < N, 1 ≤ k < c,
λik = 1,
N
1 ≤ i < N,
λik < N,
i=1
(2)
2.1.2. The Gustafson-Kessel Algorithm. Gustafson and Kessel
extended the standard fuzzy c-means algorithm by employing an adaptive distance norm, in order to detect clusters of
different geometrical shapes in one data set [32, 33]. Each
cluster has its own norm-inducing matrix Ai , which yields
slightly, different inner-product norm:
2
DikAi = qk − vi
T
Ai qk − vi ,
1 ≤ i < c, 1 ≤ k < N.
(5)
Here Ai are used as optimization variables in the c-means
functional, thus allowing each cluster to adapt the distance
norm to the local, topological structure of the data. Let
A = [A1 , A2 , . . . , Ac ] denote a c-tuple of the norm-inducing
matrices. The objective functional of the Gustafson-Kessel
algorithm is defined by
1 ≤ k < c.
c
N
Γ(Q; Λ, V , A) =
i=1 k=1
The fuzzy partitioning space for Q is defined to be the set
⎧
⎨
F f c = ⎩Λ ∈ RN ×c | λik ∈ [0, 1], ∀i, k;
c
⎫
⎬
N
λik = 1, ∀i; 0 <
i=1
k=1
(3)
λik < N, ∀k⎭.
The ith column of Λ contains values of the membership
function of the ith fuzzy subset of Q.
2.1.1. Fuzzy c-Means Algorithm. The most prominent fuzzy
clustering algorithm is the fuzzy c-means, a fuzzification
of K-means hard partitioning method. It is based on
the minimization of an objective function called c-means
functional, defined by [31]
c
N
Γ(Q; Λ, V ) =
(λik )m qk − υi
i=1 k=1
with V = [υ1 , υ2 , . . . , υc ],
2
A,
(4)
n
υi ∈ R ,
where Ai is a set of data vectors in the ith cluster and
V is a vector of cluster prototypes or cluster centers such
i
that vi = ( N=1 qk )/Ni , qk ∈ Ai , is the mean for data
k
vectors over cluster i with Ni being the number of data
vectors in Ai . Here the vector of cluster prototypes have to
2
be computed, and DikA = qk − vi 2 = (qk − vi )T A(qk −
A
vi ) is a squared inner-product distance norm. The c-means
functional given by (4) is a measure of the total variance
of qk from vi . The minimization of (4) is a nonlinear
optimization case that can be solved by various methods like
group coordinate minimization, over-simulated annealing
and genetic algorithms. The fuzzy c-means algorithm solves
it by a simple Picard iteration method through the first-order
conditions for stationary points of (4).The fuzzy c-means
algorithm computes with the standard Euclidean distance
norm, which induces hyperspherical clusters. Hence it can
only detect clusters with the same shape and orientation.
2
(λik )m DikAi .
(6)
It is important to highlight that Γ can be minimized by
simply making Ai less positive definite. This is accomplished
by allowing the matrix Ai to vary with its determinant fixed,
that is, Ai = ρi with ρi being fixed for each cluster.
The expression for Ai can be expanded by use of Lagrange
multiplier method as
Ai = ρi det(Fi )
1/n −1
Fi ,
(7)
where Fi is the fuzzy covariance matrix of the ith cluster
defined by
Fi =
N
m
k=1 (λik )
q k − vi q k − vi
N
m
k=1 (λik )
T
.
(8)
2.2. Validation Measures. Cluster validity measures are used
to confirm whether a given fuzzy partition fits to the data
all. There are various scalar validity measures proposed in
the literature; however, none of them is perfect by oneself.
Therefore, several measures have been used, which are
described below.
2.2.1. Partition Coefficient (PC). It measures the amount of
“overlapping” between cluster, defined as follows [29]:
c
PC(c) =
N
2
1
λi j ,
N i=1 j =1
(9)
where λi j is the membership of data point j in cluster i. The
disadvantage of PC is the lack of direct connection to some
property of the data themselves. The optimal number of the
cluster is at the maximum value.
2.2.2. Classification Entropy (CE). It is similar to the PC that
measures the fuzziness of the cluster partition, defined by
c
CE(c) = −
N
1
λi j log λi j .
N i=1 j =1
(10)
4
EURASIP Journal on Advances in Signal Processing
2.2.3. Partition Index (SC). It is a sum of individual cluster
validity measures normalized through the division by the
fuzzy cardinality of each cluster [3]. A lower value of SC
indicates a better partition, mathematically defined as
c
N
j =1
λi j
i=1
Ni
m
c
k=1
SC(c) =
q j − vi
vk − vi
2
.
2
(11)
2.2.4. Seperation Index (S). On the contrary of above
measure, this index uses a minimum-distance separation for
partition validity, defined as [3]
S(c) =
c
i=1
N
j =1
λi j
2
q j − vi
Nmini,k vk − vi
2
2
(12)
.
2.2.5. Xie and Beni’s Index (XB). It aims to quantify the ratio
of the total variation within clusters and the separation of
clusters defined by [34]
XB(c) =
c
i=1
N
j =1
λi j
2
q j − vi
Nmini, j q j − vi
2
2
.
(13)
A lower value of XB indicates a better partition and the
optimal number of clusters.
2.2.6. Dunn’s Index (DI). This is proposed to identify compact and well-separated clusters and the result of clustering
has to be calculated again and again. Due to this, Dunn’s
index is not very popular because as c and N increase
calculation becomes computationally very expensive. It is
defined as [31]
⎧
⎨
⎧
⎨
minx∈ci ,y∈c j d x, y
DI(c) = min⎩ min ⎩
i∈c
j ∈c,i = j max
/
k∈c maxx,y ∈c d x, y
⎫⎫
⎬⎬
⎭⎭
,
An orderly way is to assume that the “ideal” TFD is the one
producing the Dirac pulse at the IF of an arbitrary frequency
modulated signal; elsewhere the value of the distribution
should be zero [35]. However, this requires well-defined
mathematical representations of various TFDs. Alternatively
for a monocomponent signal, performance of its TFD is
conventionally defined in terms of its energy concentration
about the signal IF. To measure distribution concentration
for monocomponent signals, some quantities in the statistics
were the inspiration for defining measures in the form
of the distribution energy [16], the ratio of distribution
norms [36], and the famous R´ nyi entropy [37]. Some other
e
measures have been based on the definition of duration of
time-limited signals [38] and the combined characteristics of
TFDs [39]. Whereas for multicomponent signals, resolution
is equally important. The good t-f resolution of the signal
components requires a good energy concentration for each of
the components and a good suppression of any undesirable
artifacts. The resolution may be measured by the minimum
frequency separation between the component’s main lobes
for which their magnitudes and bandwidths are still preserved [39]. Although different concentration and resolution
criteria can be found in the literature, but most of them are
related to each other. Therefore, we have compiled a compact
list of measures that are briefly reviewed as follows.
2.3.1. Normalized R´nyi Entropy Measures. The terms
e
entropy, uncertainty, and information are used more or less
interchangeably and is the measure of information for a
given probability density function. Minimizing the entropy
in a TFD is equivalent to maximizing its concentration and
resolution [36].
R´ nyi entropy is a more appropriate way of measuring
e
the t-f uncertainty sidestepping the negativity issue in
Shannon entropy. It is derived from the same set of axioms
as the Shannon entropy [37], given as
(14)
EREα =
where d(x, y) is the dissimilarity function between two
cluster.
2.2.7. Alternative Dunn Index (ADI). Here the dissimilarity
function d(x, y) between two clusters is rated in value from
beneath by the triangular nonequality d(x, y) ≥ |d(y, v j ) −
d(x, v j )| with an aim to simplify the calculation of original
DI. It is defined as
ADI(c) =
⎧
⎨
⎧
⎨ minxi ∈ci , x j ∈c j d y, v j − d x, v j
min⎩ min ⎩
i∈c
j ∈c,i = j
/
maxk∈c maxx,y∈c d x, y
⎫⎫
⎬⎬
,
Qα (n, ω) ;
n
1
1−α
log2
n
n
Qα (n, ω)
,
ω Q(n, ω)
ω
with a ≥ 2.
(15)
where v j is the cluster center of the jth cluster.
2.3. TFDs’ Information Theoretic Criteria. The estimation
of signal information and complexity in the t-f plane is
quite challenging. A criterion for comparison of timefrequency distributions may be defined in various ways [8].
(16)
ω
where α is the order of R´ nyi entropy, which is taken as 3
e
being the smallest integer value to yield a well-defined, useful
information measure for a large class of signals. However,
the R´ nyi entropy measure with α = 3 does not detect zero
e
mean CTs, so normalization either with signal energy or
distribution volume is necessary [37].
By definition R´ nyi entropy normalized by the signal
e
energy is given by
ENREα =
⎭⎭
1
log
1−α 2
(17)
The R´ nyi entropy normalized by the distribution volume is
e
given by
ENREα =
1
1−α
log2
n
n
Qα (n, ω)
,
ω |Q(n, ω)|
ω
with a ≥ 2.
(18)
EURASIP Journal on Advances in Signal Processing
5
If the distribution contains oscillatory values, then summing
them in absolute value means that large CTs will decrease
this measure, indicating smaller concentration due to CTs
appearance.
2.3.2. Ratio of Norms-Based Measure. Another measure of
concentration is defined by dividing the fourth power norm
of TFD Q(n, ω) by its second power norm, given as [37]
ω
|Q(n, ω)|
n
ω
|Q(n, ω)|
.
2 2
(19)
The fourth power in the numerator favors a peaky distribution. To obtain the optimal distribution for a given signal, the
value of this measure should be the maximum.
2.3.3. Stankovic Measure. This is a simple criterion for
objective measurement of TFD concentration that makes use
of the duration of time-limited signals [38]. Its discrete form
is expressed as
β
β
J[Q(n, ω)] ≡ Jβ =
Cn (t) =
Asn (t) Vin (t)
+
.
Amn (t)
fin (t)
(22)
4
n
EJP =
rather than a product. This new measure can give a better
picture of TFDs’ instantaneous concentration performance
even for those having no side lobes. The modified instantaneous concentration measure for each signal component of
an n-component signal z(t) = zn (t) for a given time slice
t = t0 can be defined as
|Q(n, ω)|
n
1/β
(20)
ω
with n ω Q(n, ω) = 1 being the normalized unbiased
energy constraint, and β > 1. The best choice according
to this criterion (optimal distribution with respect to this
measure) is the distribution that produces the minimal value
of J[Q(n, ω)].
2.3.4. Boashash Performance Measures. The characteristics
of TFDs that influence their resolution, such as components concentration and separation and interference terms
minimization, are combined to define separate quantitative
criterion for concentration and resolution [39].
Instantaneous Concentration Measure. For a given time slice
t = t0 of TFD of an n-component signal z(t) = zn (t), the
concentration performance can be quantified by [39]
As (t) Vin (t)
,
cn (t) = n
£
Amn (t) fin (t)
(21)
where cn (t), Vin (t0 ), fin (t0 ), Asn (t0 ), and Amn (t0 ) denote,
£
respectively, the concentration measure, instantaneous bandwidth, the IF, the side lobe magnitude, and the main lobe
magnitude of the nth component at time t = t0 . The
instantaneous concentration performance of a TFD will
improve if it minimizes side lobe magnitude relative to the
main lobe magnitude and main lobe bandwidth about the
signal IFs for each signal component.
A Suggested Modification. To account for the effects of TFD
parameters like instantaneous bandwidth, IF, side lobe magnitude, and the main lobe magnitude more independently,
we suggest a modification in the above mentioned Boashash
concentration measure given by (21). For this two terms,
Asn (t)/Amn (t) and Vin (t)/ fin (t), are combined into a sum,
The good performance of a TFD is characterized by a close
to zero value of this measure.
Normalized Instantaneous Resolution Measure. The normalized instantaneous resolution performance measure Ri is
expressed as [39]
Ri (t) = 1 −
1 As (t) 1 Ax (t)
+
+ (1 − D(t))
3 Am (t) 2 Am (t)
(23)
0 < Ri (t) < 1,
where Am (t) =
Amn (t)/2, As (t) =
Asn (t)/2, and
Ax (t) denote the average magnitude of the components’
main lobes, the average magnitude of the components’ side
lobes, and the CT magnitude of any two adjacent signal
components. D(t) = 1 − Vi (t)/Δ fi (t) is a measure of
the components’ main lobes separation in frequency with
Vin /2 as the components’ main lobes average
Vi (t) =
instantaneous bandwidth, and Δ fi (t) = fin+1 (t) − fin (t) as the
difference between the components’ IFs. The measure D(t)
requires computations for each adjacent pair of components
present in the signal indicated by subscript n. The value of
the measure Ri will be close to one for good performing
TFDs and zero for poor performing ones (TFDs with large
interference terms and components poorly resolved).
3. The Hybrid Neurofuzzy Method
In this paper, we address the concentration and resolution
problem in the t-f plane by combining fuzzy clustering
and localized neural network processing in a nonstationary
setting. The proposed method is composed of two stages
for achieving high concentration and good resolution of the
image in the t-f plane. The first stage is the optimal fuzzy
clustering of vectored image data in the t-f plane. The second
stage deals with the localized neural network processing. A
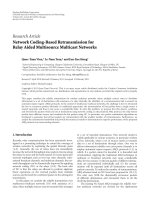
self-explanatory block diagram is depicted in Figure 1.
3.1. Time-Frequency Image Vectoring and Fuzzy Clustering.
The spectrogram and preprocessed WVD of various known
signals constitute the input and target TFDs for the ANN.
The ANN may be used to extract mathematical patterns and
detect trends in the spectrogram and WVD that are too
complex to be noticed by any other technique. The ANN
has an ability to learn based on the data given for training
and performs well on complicated test cases of a similar
nature [4]. We consider a signal containing parallel chirps
and another signal containing a sinusoidal modulated FM
6
EURASIP Journal on Advances in Signal Processing
Spectrogram and pre-processed WignerVille distribution of known signals
(training mode)
Stage 1
Spectrograms of unknown signals
(testing mode)
Fuzzy clustering of
vectored data
Localized neural
networks processing
Stage 2
Resultant t-f images with
high concentration and
good resolution
Figure 1: Block diagram of the proposed hybrid neurofuzzy method.
component. The discrete mathematical forms of the training
signals are as follows.
x1 (n + 1) = exp jω1 (n + 1)n + exp jω2 (n + 1)n ,
x2 (n + 1) = exp
jπ
− jπω(n + 1) n ,
2
(24)
where ω1 (n + 1) = (πn)/4N, ω2 (n + 1) = (π/3 + (πn)/4N),
and ω(n + 1) = 0.1 sin(2π(n/N)). Here N refers to the total
number of sampling points in these signals (N = 3000 for
the training signals).
The WVD of these signals suffers from CTs which inhibit
its use as target [4]. The CTs are eliminated by multiplying
the WVD with the spectrogram of signals. Next, both the
spectrogram and preprocessed WVD is converted to 1 × 3
pixel vectors. This vector size is determined after experimenting with various combinations and ascertaining the effect
on the visual quality of the outcome from the trained ANN
model. Subsequently the arithmetic means of the vectors
from the WVDs are obtained. This is with a view that the
IF can be computed by averaging frequencies at each time
instant; a definition suggested by many researchers [40, 41].
Vectors from the training spectrograms are grouped in an
optimal fashion by the Gustafson-Kessel fuzzy partitioning
validated by various objective measures. These vectors are
paired with the corresponding average values from the target
TFDs for training and subsequent selection of localized
neural networks.
3.2. Localized Neural Network Processing. The selected ANN’s
topology includes 40 hidden units in a single hidden
layer with feed-forward back-propagation neural network
architecture. The hidden layer consists of sigmoid neurons
followed by an output layer of positive linear neurons,
respectively. The selected ANN architecture is trained
by the Bayesian regularized Lavenberg-Marquardt backpropagation (LMB) algorithm. This choice of the training
algorithm and number of hidden neurons and layers are
based on some empirical studies [42]. Multiple layers of
neurons with nonlinear transfer functions allow the network
to learn nonlinear and linear relationships between input
and output vectors. The linear output layer lets the network
produce values outside the range −1 to +1. The LMB
training algorithm is the variation of Newton’s method that
is designed for minimizing sums of squares of nonlinear
functions [4]. The Bayesian framework of David Mackay
smoothes the network response and avoids overtraining.
Also, it helps in determining the optimal regularization
parameters in an automated fashion [28].
3.2.1. Multiple Neural Networks Training and Selecting Localized Neural Networks. The spectrogram and preprocessed
WVD of the two signals are used to train the multiple neural
networks. Fuzzy clustering of the data results in its optimal
partitions for which analysis is performed and discussed in
the next section. The training vectors from the spectrogram
are distributed in different groups by Gustafson-Kessel fuzzy
clustering algorithm. They are paired with target values from
the preprocessed WVD. It is desired that the ANN does
well on data it has not seen before and is not overtrained.
For this, data pairs are grouped into separate training and
validation sets. The error is monitored on the validation set
that does not take part in the training. The training is stopped
whenever the ANN tries to learn the noise in the training set.
Under the Bayesian framework, multiple ANNs are
trained for each cluster using xi as the training vector and
yi as its target value. This is advantageous for two main
reasons. Firstly, the weights are initialized to random values
and may not converge in an optimal fashion. Secondly, an
early stopping to avoid overfitting the data may result in
poorly trained network [43]. The performance parameters
include the mean-square error reached in the last epoch,
maximum number of epochs, performance goal, maximum
validation failures, and the performance gradient. These can
be accessed to find out the most optimally trained ANN
out of multiple ANNs for each cluster. These selected ANNs
for all clusters are termed as the localized neural networks
(LNNs).
EURASIP Journal on Advances in Signal Processing
3.2.2. Localized Neural Networks’ Testing and Data Postprocessing. In the testing phase, the spectrograms of
unknown signals are first converted to vectors of specified
length. These vectors are fuzzy clustered using GustafsonKessel fuzzy clustering algorithm. The test vectors are given
as input to the localized neural networks, and the results are
obtained. The resultant data is postprocessed to constitute
the TFD image. This is achieved by zero padding the resultant
scalar values to form the vectors. Next, these vectors are declustered and placed at the appropriate positions to form
the two-dimensional image matrix by retrieving their known
index values.
4. Results and Discussion
4.1. Cluster Analysis. Using the validity measures described
in Section 2.2, both the hard and fuzzy clustering techniques
can be compared. For this, a synthetic data set is used
to demarcate the index values. However, these experiments
and evaluations are not the proposition of this work and
will be discussed elsewhere. On the score, of the values of
these validity measures for fuzzy clustering the GustafsonKessel clustering has the very best results. The GustafsonKessel fuzzy clustering algorithm forces each cluster to adapt
the distance norm to the local, topological structure of
the data points. It uses the Mahalanobis distance norm.
There are two numerical problems with this algorithm.
When an eigenvalue is zero or when the ratio between
the maximal and the minimal eigenvalue is very large, the
matrix is nearly singular. As a result, the normalization to
a definite volume fails, as the determinant becomes zero.
The problem is solved if the ratio between the maximal and
minimal eigenvalue is kept smaller than some predetermined
threshold. Another problem appears if the clusters are vastly
extended in the direction of the largest eigenvalues. In this
case, the computed covariance matrix cannot estimate the
underlying data distribution, so a scaled identity matrix
can be added to the covariance matrix to resolve the
issue.
In the course of partitioning the data vectors, fuzzy
Gustafson-Kessel algorithm is applied and the optimal
number of subsets is searched with using validity measures
before the localized neural network processing stage. During
this optimization process, all parameters are fixed to the
default values and number of clusters are varied such that
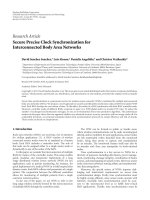
c ∈ [2 14]. The values of the validity measures depending
from the number of the cluster are plotted and embraced in
Table 1. It is important to mention that no single validation
index is perfect and reliable only by itself. The optimal
value can be only detected with the comparison of all the
results. We choose a number of clusters so that adding
another cluster does not add sufficient information. This
means that either marginal gain drops or differences become
insignificant between the values of a validation index. The PC
and CE suffer from drawbacks of their monotonic decrease
with the number of clusters and the lack of direct connection
to the data. On the score of Figures 2(a) and 2(b), the number
of clusters can be only rated to 3. In Figures 2(c), 2(d) and
7
2(e), SC and S hardly decreases at the c = 3 point. The XB
index reaches this local minimum at c = 10. However, the
optimal number of clusters are chosen to 3 based on the fact
that SC and S are more useful, which is confirmed by the
Dunn’s index too in Figure 2(f). The results of ADI are not
validated enough to confirm its reliability.
4.2. Test Cases. There are many advanced techniques proposed in past 15 years attempting to improve the energy
concentration in the t-f domain. The results of neural
network-based approach have been compared to the results
obtained by some traditional as well as recently introduced
high-resolution t-f techniques. The list includes the WVD,
the CWD, the traditional reassignment method [13], the
optimal radially Gaussian kernel method [16], and the t-f
autoregressive moving-average spectral estimation method
[21]. An empirical judgment on TFDs’ performance is
possible by objective assessment made by some objective
criteria discussed in Section 2.3. We have compiled a compact
and meaningful list of objective measures that include
the ratio of norms based measure [36], normalized R´ nyi
e
entropy measure [37], Stankovic measure [38], and Boashash
performance measures [39]. The first two multicomponent
test cases include two synthetic signals. By using synthetic
signals it is verified that the proposed approach produces
more accurate representations. Once it is numerically confirmed that the proposed method works more accurately,
then it is applied to a real-life example.
4.2.1. Synthetic Test Cases. The first synthetic signal contains
two sinusoidal FM components and two chirps intersecting
each other. The second test case contains two significantly
close parallel chirps to evaluate the TFDs’ instantaneous
performance by the measures suggested in [39]. The spectrograms of these signals are shown in Figures 3(a) and 4(a),
respectively, referred to as test image 1 (TI 1) and test image
2 (TI 2). We consider the first synthetic signal under noisy
environment.
The two synthetic signals are used to confirm the
proposed scheme’s performance at the intersection of the
IFs and closely spaced components. This is with a view that
estimation of the IF is rather difficult in these situations.
The first signal is a four-component signal containing two
sinusoidal FM component and two chirps intersecting each
other. Its discrete mathematical form is given as
x1 (n + 1) = sin
jπn
3π
2πn
n + exp
+ 0.1π sin
n
2
N
4N
+ exp j 4π −
πn
n .
4N
(25)
The additive Gaussian noise of variance 0.01 is added to
signal to consider the performance of the algorithm under
noise. The noisy spectrogram of the signal is shown in
Figure 3(a). The frequency separation is low enough and
Classification
entropy (CE)
EURASIP Journal on Advances in Signal Processing
Partition
coefficient (PC)
8
0.97
0.96
0.95
0.94
2
4
6
8
10
12
14
0.14
0.12
0.1
0.08
0.06
0.04
2
4
6
0.6
0.4
0.2
2
4
6
8
10
12
14
4
Xie and Beni
index (XB)
12
14
2.5
1.5
0.5
2
4
6
8
10
12
14
(d)
6
8
10
12
14
Dunn index (DI)
2
10
×10−5
(c)
25
20
15
10
5
0
8
(b)
Separation
index (S)
Partition
index (SC)
(a)
×10−3
2
1.5
1
0.5
0
2
4
6
8
10
12
14
(f)
Alternative Dunn
index (ADI)
(e)
0.1
0.08
0.06
0.04
0.02
0
2
4
6
8
10
12
14
(g)
Figure 2: Values of (a) partition coefficient (PC), (b) classification entropy (CE), (c) partition index (SC), (d) separation index (S), (e) Xie
and Beni’s index (XB), (f) Dunn’s index (D), and (g) alternative Dunn index (ADI) for various clusters.
Table 1: Validity measures’ values for different clusters.
Number of clusters
2
3
4
5
6
7
8
9
10
11
12
13
14
PC
0.9692
0.9549
0.9505
0.9479
0.9466
0.9433
0.9455
0.9444
0.9451
0.9444
0.9476
0.9461
0.9442
Cluster validity measures
CE
SC
S(1.0e−004∗ )
0.0502
0.2436
0.0644
0.0809
0.5518
0.1926
0.0951
0.6579
0.1998
0.1056
0.5530
0.1666
0.1102
0.6968
0.2486
0.1197
0.4960
0.1769
0.1179
0.4736
0.1808
0.1215
0.4446
0.1705
0.1214
0.3962
0.1527
0.1258
0.3976
0.1434
0.1197
0.3560
0.1358
0.1238
0.3847
0.1508
0.1303
0.3493
0.1415
avoids intersection between the two components (sinusoidal
FM and chirp components) in between 100–180 Hz and 825–
900 Hz near 0.7 second.
The TFDs’ instantaneous concentration and resolution
performance are evaluated by Boashash instantaneous performance measures using another test case from [39]. The
authors in [39] have specifically found the modified B
XB
9.2561
12.737
5.7947
5.2100
20.314
5.1746
3.9703
3.4385
3.1424
2.9176
3.8053
2.8575
2.7786
DI
0.0019
0.0003
0.0005
0.0005
0.0003
0.0005
0.0007
0.0007
0.0007
0.0003
0.0005
0.0003
0.0008
ADI
0.0159
0.0947
0.0061
0
0
0
0
0
0
0
0
0
0
distribution (β = 0.01) as the best performing TFD for this
signal at the middle. The signal is defined as:
x2 (n) = cos 2π 0.15t + 0.0004t 2
+ cos 2π 0.2t + 0.0004t 2
The spectrogram of the signal is shown in Figure 4(a).
(26)
EURASIP Journal on Advances in Signal Processing
9
Noisy test spectrogram, variance = 0.01
2
1.5
1.5
Time
2.5
2
Time
2.5
1
1
0.5
0.5
0
0
100
200
300
400 500 600
Frequency (Hz)
700 800
0
900
0
100
200
300
(a)
400 500 600
Frequency (Hz)
700 800
900
(b)
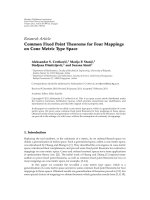
Figure 3: TFDs of a synthetic signal consisting of two sinusoidal FM component and two chirp components. (a) Spectrogram (TI 1) (Hamm,
L = 90) with additive Gaussian noise and (b) NTFD.
100
80
80
Time (s)
120
100
Time (s)
120
60
60
40
40
20
20
0.05
0.1 0.15
0.2
0.25 0.3 0.35 0.4
Frequency (Hz)
0.45
0.5
(a)
0.05
0.1 0.15
0.2
0.25 0.3 0.35 0.4
Frequency (Hz)
0.45
0.5
(b)
Figure 4: TFDs of a signal consisting of two linear FM components with frequencies increasing from 0.15 to 0.25 Hz and 0.2 to 0.3 Hz,
respectively. (a) Spectrogram (TI 2) and (b) NTFD.
The synthetic test TFDs are processed by the proposed
hybrid neurofuzzy method and the results are shown in
Figures 3(b) and 4(b). Significant improvement in concentration and resolution of these signals in t-f domain
can be noticed in these Figures. In order to compare the
performance of TFDs by various methods, we quantify the
quality of TFDs by objective assessment methods. Such
quantitative analysis is presented in Table 2. The results
clearly indicate that the proposed hybrid neurofuzzy method
achieves the highest resolution and concentration amongst
considered methods. The performance deteriorates in the
noisy environment for all the considered high-resolution
methods. However, the proposed neurofuzzy scheme maintains the best performance. The results are expected to
improve further for low SNR values of the signal if the ANN
model is trained with the noisy data of similar type.
Boashash instantaneous concentration and resolution
measures are computationally expensive because they require
calculations at various time instants. To limit the scope, these
measures are computed at the middle of the synthetic signal
and the results are compared to those reported by the authors
in [39]. We take a slice at t = 64 and measure the signal
components’ parameters Am1 (64), Am2 (64), Am (64), As1 (64),
As2 (64), As (64), Vi1 (64), Vi2 (64), Vi (64), fi1 (64), fi2 (64), and
Δ fi (64), as well as the CTs’ magnitude Ax (64). The values
of the normalized instantaneous resolution measure Ri (64)
and modified concentration performance measure Cn (64)
are recorded in Tables 3 and 4, respectively. A TFD having
10
EURASIP Journal on Advances in Signal Processing
Table 2: Objective assessment.
Description
Ratio of norm
based measure
(×10−4 )
Volume
Normalized
R´ nyi entropy
e
measure
Stankovic
measure
(×105 )
Test
TFD
Spec
WVD
CWD
TSE
NTFD
RAM
OKM
TI 1
1.98
3.72
2.13
3.14
21
15
4.33
TI 3
3.81
3.84
2.89
8.13
76
68
8.32
TI 1
15.71
10.43
12.59
13.37
7.20
9.99
11.34
TI 3
12.45
12.02
12.93
13.85
6.21
7.30
11.77
TI 1
12.155
10.367
8.052
17.839
0.143
2.396
9.515
TI 3
0.22
3.30
1.06
2.01
0.00019
0.00129
0.63
In this table, the abbreviations for different methods include the spectrogram (spec), Wigner-Ville distribution (WVD), Choi-Williams distribution (CWD),
t-f autoregressive moving-average spectral estimation method (TSE), neural network-based TFD (NTFD), reassignment method (RAM), and the optimal
radially Gaussian kernel TFD method (OKM).
Table 3: Parameters and the normalized instantaneous resolution performance measure of TFDs for the time instant t = 64.
TFD
(optimal
parameters)
Spectrogram
(Hann, L =
35)
WVD
ZAMD (a = 2)
CWD (σ = 2)
BJD
Modified B
(β = 0.01)
NTFD
Am (64)
As (64)
Ax (64)
Vi (64)
Δ fi (64)
D(64)
R(64)
0.9119
0.0087
0.5527
0.0266
0.0501
0.4691
0.7188
0.9153
0.9146
0.9355
0.9320
0.3365
0.4847
0.0178
0.1222
1
0.4796
0.4415
0.3798
0.0130
0.0214
0.0238
0.0219
0.0574
0.0420
0.0493
0.0488
0.7735
0.4905
0.5172
0.5512
0.6199
0.5661
0.7541
0.7388
0.9676
0.0099
0.0983
0.0185
0.0526
0.5957
0.8449
0.9013
0
0
0.0110
0.0550
0.800
0.9333
the largest positive value (close to 1) of the measure Ri is
the one with the best instantaneous resolution performance.
The NTFD gives the largest value of Ri at time t = 64 in
Table 3 and hence is selected as the best performing TFD of
this signal at t = 64.
On similar lines, we have compared the TFDs’ concentration performance at the middle of signal duration
interval. A TFD is considered to have the best energy
concentration for a given multicomponent signal if, for
each signal component, it yields the smallest instantaneous
bandwidth relative to component IF (Vi (t)/ fi (t)) and the
smallest side lobe magnitude relative to the main lobe
magnitude (As (t)/Am (t)). The results in Table 4 indicate that
the NTFD gives the smallest values of C1,2 (t) at t = 64 and
hence is selected as the best concentrated TFD at time t = 64.
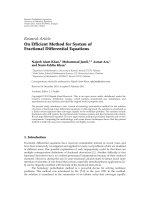
4.2.2. Real-Life Test Case. The bat echolocation chirp sound
provides a perfect real-life multicomponent test case (test
image 3 (TI 3)). Its true invariable nature is only obvious
from the spectrogram shown in Figure 5(a), but, that is,
blurred and difficult to interpret. The results are obtained
using other high-resolution t-f methods that include the
WVD, the traditional reassignment method, the optimal
radially Gaussian kernel method, and the t-f autoregressive
moving-average spectral estimation method. These t-f plots
are shown in Figures 5(b), 5(d), 5(e), and 5(f), respectively,
along with the neural network based reassigned TFD shown
in Figure 5(c).
The t-f autoregressive moving-average estimation models
are shown to be a t-f symmetric reformulation of timevarying autoregressive moving-average models [21]. The
results are achieved for nonstationary random processes
using a Fourier basis. This reformulation is physically
intuitive because it uses time delays and frequency shifts to
model the nonstationary dynamics of a process. The TSE
models are parsimonious for the practically relevant class
of processes with a limited t-f correlation structure. The
simulation result depicted in Figure 5(f) demonstrate the
method’s ability to improve on the WVD (Figure 5(b)) in
terms of resolution and absence of CTs; on the other hand,
the t-f localization of the components deviates slightly from
that in the WVD.
The traditional reassignment method enhances the resolution in time and frequency of the spectrogram. This
is achieved by assigning to each data point a new t-f
coordinate that better reflects the distribution of energy in
EURASIP Journal on Advances in Signal Processing
11
Spectrogram
Wigner-Ville distribution
160
140
120
Time
100
80
60
40
20
50
100
150
200
Frequency
250
300
(b)
(a)
NTFD
Reassigned spectrogram
180
160
140
Time
120
100
80
60
40
20
50
100
150
200
Frequency
250
300
(d)
(c)
TFD obtained by the OKM
TFD obtained by the TSE
175
150
Time
125
100
75
50
25
0
50
100
150
200
250
Frequency
(e)
300
350
400
(f)
Figure 5: TFDs of the multi-component bat echolocation chirp signal by various high-resolution t-f methods.
12
EURASIP Journal on Advances in Signal Processing
Table 4: Parameters and the modified instantaneous concentration performance measure of TFDs for the time instant t = 64.
TFD(optimal
parameters)
Spectrogram
(Hann, L =
35)
WVD
ZAMD(a =
2)
BJD
Modified B
(β = 0.01)
NTFD
As2 (64)
Am1 (64)
Am2 (64)
Vi1 (64)
Vi2 (64)
fi1 (64)
fi2 (64)
C1 (64)
C2 (64)
0.0087
0.0087
1
0.8238
0.03200
0.0200
0.1990
0.2500
0.1695
0.0905
0.3365
0.3365
0.9153
0.9153
0.0130
0.013
0.1980
0.2554
0.4333
0.4185
0.4848
0.4900
1
0.8292
0.0224
0.0204
0.2075
0.2495
0.5927
0.6727
0.0176
0.0179
1
0.8710
0.0300
0.0176
0.205
0.2543
0.1639
0.0898
0.1240
CWD (σ = 2)
As1 (64)
0.1204
1
0.8640
0.0270
0.0168
0.2042
0.2530
0.2562
0.2058
0.0100
0.0098
1
0.9352
0.0190
0.0180
0.200
0.2526
0.1050
0.0817
0
0
0.8846
0.9180
0.0110
0.0110
0.2035
0.2585
0.0541
0.0425
Time slice at n = 150
1
0.9
0.8
0.8
0.7
0.7
Normalized amplitude
0.9
Normalized amplitude
Time slice at n = 310
1
0.6
0.5
0.4
0.3
0.6
0.5
0.4
0.3
0.2
0.2
0.1
0.1
0
0
50
100
150
200
250
300
350
400
Frequency
Spectrogram
TFD through NENNs
(a)
0
0
50
100
150
200
250
300
350
400
Frequency
Spectrogram
TFD through NENNs
(b)
Figure 6: The time slices for the spectrogram (blue) and the NTFD (red) for the bat echolocation chirps signal, at n = 150 (a) and n = 310
(b).
the analyzed signal [13]. It is shown that this method can
be applied advantageously to all the bilinear t-f and timescale representations, and can be easily computed for the
most common ones. The reassigned spectrogram for the bat
echolocation chirps signal is shown in Figure 5(d). It shows
energy concentration but often can diminish accuracy due
to its way of approaching the problem. Also, its performance
deteriorates for low signal-to-noise ratio (SNR) values and it
contains discontinuities. The evaluation by various objective
criteria is presented in Table 2. The analysis indicates that
the results obtained by the hybrid neurofuzzy method are
significantly better than this approach for all the measures.
On the other hand, the optimal radially Gaussian
kernel TFD method proposes a signal-dependent kernel that
changes shape for each signal to offer improved t-f representation for a large class of signals based on quantitative
optimization criteria [16]. The result by this method is
depicted in Figure 5(e). On careful monitoring, it is revealed
that it does not recover all the components, thus losing
some useful information about the signal. Also, the objective
assessment does not point to much significance in achieving
energy concentration along the individual components.
The NTFD for the test case is shown in Figure 5(c), which
presents satisfactory resolution and is highly concentrated
along the individual components. Also, it is more informative as the four components can be clearly identified. For
further analysis, slices of the spectrogram and the NTFD are
taken at the time instants n = 150 and n = 310 (recall that
EURASIP Journal on Advances in Signal Processing
n = 1, 2, . . . , 400). The normalized amplitudes of these slices
are plotted in Figure 6. These instants are chosen because
visually three chirps can be marked at these instants (see
Figure 5(c)). Also, Figure 6 confirms the peaky appearance
of three different frequencies at these instants. There are no
spurious CTs, and the result indicates much better frequency
resolution (i.e., narrower main lobe and no side lobes) in
comparison to all other methods and quadratic distributions.
13
[7]
[8]
5. Conclusions
The fuzzy framework for neural network based technique is found effective for the TFDs’ reassignment using
both synthetic and real-life examples. Experimental results
demonstrate the effectiveness of the hybrid neurofuzzy
approach against some high-resolution t-f methods. This
includes distributions known for their high CTs suppression
and energy concentration in the t-f domain. The resultant
TFDs exhibit high resolution, good concentration, and no
interference terms between the signal components. Also,
they are found to be better at detecting the correct number
of components in a given signal. The performance of
the proposed scheme is satisfactory for signals corrupted
with additive Gaussian noise with small variance whereas
the performance of all other methods deteriorates. These
qualities allow an easy visual interpretation and the reassigned TFDs can be used for subsequent classification
problems. The trade-off is that these reassigned TFDs
do not satisfy some desirable properties such as energy
preservation and marginals. Hence the results may not be
feasible for certain applications, which may have different
preferences and the requirement to the TFDs. However, the
results are better or close to the actual TFD images than
the spectrogram. Furthermore, several TFDs, especially the
adaptive ones like the traditional reassigned TFDs, have
discontinuities [40]. The future work will be to adjust the
discontinuity phenomenon along the individual components
in the reassigned TFDs obtained by the proposed approach.
Another direction may be to train the proposed scheme
with noisy data and check its performance in very low SNR
environment.
[9]
[10]
[11]
[12]
[13]
[14]
[15]
[16]
[17]
[18]
References
[1] J. Hardin and D. M. Rocke, “Outlier detection in the multiple
cluster setting using the minimum covariance determinant
estimator,” Computational Statistics and Data Analysis, vol. 44,
no. 4, pp. 625–638, 2004.
[2] F. Hoppner, F. Klawonn, R. Kruse, and T. Runkler, Fuzzy
Cluster Analysis: Methods for Classification, Data Analysis and
Image Recognition, Wiley, Chichester, UK, 1999.
[3] A. M. Bensaid, L. O. Hall, J. C. Bezdek et al., “Validity-guided
(re)clustering with applications to image segmentation,” IEEE
Transactions on Fuzzy Systems, vol. 4, no. 2, pp. 112–123, 1996.
[4] M. T. Hagan, H. B. Demuth, and M. Beale, Neural Network
Design, Thomson Learning, Boston, Mass, USA, 1996.
[5] R. C. Gonzalez and P. Wintz, Digital Image Processing,
Addison-Wesley, Reading, Mass, USA, 2nd edition, 1987.
[6] A. E. Ruano, Ed., Intelligent Control Systems Using Computational Intelligence Techniques, The IEE Control Series 70,
[19]
[20]
[21]
[22]
Institution of Engineering and Technology, London, UK,
2005.
E. Sejdi´ , U. Ozertem, I. Djurovi´ , and D. Erdogmus, “A new
c
c
approach for the reassignment of time-frequency representations,” in Proceedings of IEEE International Conference on
Acoustics, Speech and Signal Processing (ICASSP ’09), pp. 2997–
3000, Taipei, Taiwan, April 2009.
I. Shafi, J. Ahmad, S. I. Shah, and F. M. Kashif, “Techniques
to obtain good resolution and concentrated time-frequency
distributions: a review,” EURASIP Journal on Advances in
Signal Processing, vol. 2009, Article ID 673539, 43 pages, 2009.
H. Choi and W. J. Williams, “Improved time-frequency
representation of multicomponent signals using exponential
kernels,” IEEE Transactions on Acoustics, Speech, and Signal
Processing, vol. 37, no. 6, pp. 862–871, 1989.
I. Daubechies, “Wavelet transform, time-frequency localization and signal analysis,” IEEE Transactions on Information
Theory, vol. 36, no. 5, pp. 961–1005, 1990.
O. Rioul and P. Flandrin, “Time-scale energy distributions: a
general class extending wavelet transforms,” IEEE Transactions
on Signal Processing, vol. 40, no. 7, pp. 1746–1757, 1992.
J. Bertrand and P. Bertrand, “Time-frequency representations
of broad-band signals,” in Proceedings of the IEEE International
Conference on Acoustics, Speech and Signal Processing (ICASSP
’88), pp. 2196–2199, New York, NY, USA, April 1988.
P. Flandrin, F. Auger, and E. Chassande-Mottin, “Timefrequency reassignment: from principles to algorithms,”
in Applications in Time-Frequency Signal Processing, A.
Papandreou-Suppappola, Ed., chapter 5, pp. 179–203, CRC
Press, Boca Raton, Fla, USA, 2003.
D. L. Jones and T. W. Parks, “A high resolution dataadaptive time-frequency representation,” IEEE Transactions on
Acoustics, Speech, and Signal Processing, vol. 38, no. 12, pp.
2127–2135, 1990.
D. L. Jones and R. G. Baraniuk, “Adaptive optimal-kernel
time-frequency representation,” IEEE Transactions on Signal
Processing, vol. 43, no. 10, pp. 2361–2371, 1995.
R. G. Baraniuk and D. L. Jones, “Signal-dependent timefrequency analysis using a radially Gaussian kernel,” Signal
Processing, vol. 32, no. 3, pp. 263–284, 1993.
B. Barkat and B. Boashash, “Design of higher order polynomial Wigner-Ville distributions,” IEEE Transactions on Signal
Processing, vol. 47, no. 9, pp. 2608–2611, 1999.
G. Viswanath and T. V. Sreenivas, “IF estimation using higher
order TFRs,” Signal Processing, vol. 82, no. 2, pp. 127–132,
2002.
I. Shafi, J. Ahmad, S. I. Shah, and F. M. Kashif, “Computing
deblurred time-frequency distributions using artificial neural
networks,” Circuits, Systems, and Signal Processing, vol. 27, no.
3, pp. 277–294, 2008.
P. Borgnat and P. Flandrin, “Time-frequency localization from
sparsity constraints,” in Proceedings of the IEEE International
Conference on Acoustics, Speech, and Signal Processing (ICASSP
’08), pp. 3785–3788, Las Vegas, Nev, USA, March 2008.
M. Jachan, G. Matz, and F. Hlawatsch, “Time-frequency
ARMA models and parameter estimators for underspread
nonstationary random processes,” IEEE Transactions on Signal
Processing, vol. 55, no. 9, pp. 4366–4381, 2007.
I. Shafi, J. Ahmad, S. I. Shah, A. A. Ikram, A. A. Khan,
and S. Bashir, “High resolution time-frequency methods’
performance analysis,” EURASIP Journal on Advances in Signal
Processing, vol. 2010, Article ID 806043, 7 pages, 2010.
14
[23] S. Stankovi´ and L. Stankovi´ , “Introducing time-frequency
c
c
distribution with a “complex-time” argument,” Electronics
Letters, vol. 32, no. 14, pp. 1265–1267, 1996.
[24] L. Stankovi´ , “Time-frequency distributions with complex
c
argument,” IEEE Transactions on Signal Processing, vol. 50, no.
3, pp. 475–486, 2002.
[25] C. Cornu, S. Stankovi´ , C. Ioana, A. Quinquis, and L.
c
Stankovi´ , “Generalized representation of phase derivatives
c
for regular signals,” IEEE Transactions on Signal Processing, vol.
55, no. 10, pp. 4831–4838, 2007.
ˇ c
[26] S. Stankovi´ , N. Zari´ , I. Orovi´ , and C. Ioana, “General form
c
c
of time-frequency distribution with complex-lag argument,”
Electronics Letters, vol. 44, no. 11, pp. 699–701, 2008.
[27] I. Orovi´ and S. Stankovi´ , “A class of highly concentrated
c
c
time-frequency distributions based on the ambiguity domain
representation and complex-lag moment,” EURASIP Journal
on Advances in Signal Processing, vol. 2009, Article ID 935314,
9 pages, 2009.
[28] I. Shafi, J. Ahmad, S. I. Shah, and F. M. Kashif, “Evolutionary
time-frequency distributions using Bayesian regularised neural network model,” IET Signal Processing, vol. 1, no. 2, pp.
97–106, 2007.
[29] J. C. Bezdek, Pattern Recognition with Fuzzy Objective Function
Algorithms, Kluwer Academic Publishers, Norwell, Mass, USA,
1981.
[30] R. Babuska, Fuzzy Modeling for Control, Kluwer Academic
Publishers, Norwell, Mass, USA, 1998.
[31] J. C. Bezdek and J. C. Dunn, “Optimal fuzzy partitions: a
heuristic for estimating the parameters in a mixture of normal
distributions,” IEEE Transactions on Computers, vol. 24, no. 8,
pp. 835–840, 1975.
[32] D. E. Gustafson and W. C. Kessel, “Fuzzy clustering with
a fuzzy covariance matrix,” in Proceedings of the 17th IEEE
Conference on Decision and Control, pp. 761–766, San Diego,
Calif, USA, January 1979.
[33] R. Babuˇka, P. J. van der Veen, and U. Kaymak, “Improved
s
covariance estimation for Gustafson-Kessel clustering,” in
Proceedings of the IEEE International Conference on Fuzzy
Systems, vol. 2, pp. 1081–1085, Honolulu, Hawaii, USA, May
2002.
[34] X. L. Xie and G. Beni, “A validity measure for fuzzy clustering,”
IEEE Transactions on Pattern Analysis and Machine Intelligence,
vol. 13, no. 8, pp. 841–847, 1991.
[35] L. Stankovic and S. Stankovic, “Analysis of instantaneous
frequency representation using time-frequency distributionsgeneralized Wigner distribution,” IEEE Transactions on Signal
Processing, vol. 43, no. 2, pp. 549–552, 1995.
[36] D. L. Jones and T. W. Parks, “A resolution comparison of
several time-frequency representations,” IEEE Transactions on
Signal Processing, vol. 40, no. 2, pp. 413–420, 1992.
[37] T. Sang and W. J. Williams, “Renyi information and signaldependent optimal kernel design,” in Proceedings of the IEEE
International Conference on Acoustics, Speech, and Signal
Processing (ICASSP ’95), pp. 997–1000, Detroit, Mich, USA,
May 1995.
[38] L. Stankovic, “Measure of some time-frequency distributions
concentration,” Signal Processing, vol. 81, no. 3, pp. 621–631,
2001.
[39] B. Boashash and V. Sucic, “Resolution measure criteria for
the objective assessment of the performance of quadratic
time-frequency distributions,” IEEE Transactions on Signal
Processing, vol. 51, no. 5, pp. 1253–1263, 2003.
EURASIP Journal on Advances in Signal Processing
[40] L. Cohen, Time-Frequency Analysis: Theory and Applications,
Prentice-Hall, Upper Saddle River, NJ, USA, 1995.
[41] B. Boashash, Ed., Time-Frequency Signal Analysis and Processing, Elsevier Science, London, UK, 2003.
[42] I. Shafi, J. Ahmad, S. I. Shah, and F. M. Kashif, “Impact
of varying neurons and hidden layers in neural network
architecture for a time frequency application,” in Proceedings
of the 10th IEEE International Multitopic Conference, pp. 188–
193, Islamabad, Pakistan, 2006.
[43] S. I. Shah, I. Shafi, J. Ahmad, and F. M. Kashif, “Multiple neural
networks over clustered data (MNCD) to obtain instantaneous frequencies (IFs),” in Proceedings of the International
Conference on Information and Emerging Technologies (ICIET
’07), pp. 2–7, Karachi, Pakistan, July 2007.