Advances in Solid-State Lasers: Development and Applicationsduration and in the end limits Part 2 docx
Bạn đang xem bản rút gọn của tài liệu. Xem và tải ngay bản đầy đủ của tài liệu tại đây (1.51 MB, 40 trang )
Advances in Solid-State Lasers: Development and Applications
32
incident x-ray energy (I
0
), and the other was 310-mm long with Ar-100% gas for transmitted
x-ray energy (I). The EXAFS data of the Bi L
III
edge (13426.5 eV) were collected between
12926 and 14526 eV with 481 energy points. Data analysis was carried out on UWXAFS. The
back-scattering amplitude and the phase shift were theoretically calculated using FEFF 8.2
code. The Debye-Waller factor was estimated by the Debye code implemented in FEFF 8.2
based on Raman spectroscopy results(Narang, Patel et al. 1994).
3.3 Luminescent intensity
0
50
100
150
200
250
300
350
400
0 0.5 1 1.5 2 2.5 3 3.5
A1-A5
C1
Fluorescence intensity [a.u.]
Bi2O3 concentration [mol%]
0.335
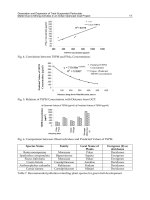
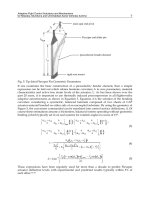
Fig. 5. Dependence of luminescent intensity (LMI) on Bi
2
O
3
concentration detected at 1120-
nm luminescence with 500-nm excitation.
The dependence of luminescent intensity (LMI) on Bi
2
O
3
concentration is illustrated in Fig.
5. The measured samples were A-series (A1~A5) and C1. The excitation and detection
wavelengths of the luminescence were at 500 and 1120 nm, respectively. The luminescent
intensity nonlinearly increased with increased Bi
2
O
3
concentration. At a 1.0 mol% of Bi
2
O
3
concentration, the luminescent intensity from A4, which includes 2.3 mol% of Al
2
O
3
, is three
orders of magnitude larger than that of C1 without Al
2
O
3
. Based on these results, we
conclude the following:
1. Al
2
O
3
additive can remarkably increase to generate a Bi luminescent center.
2. The generation of a Bi luminescent center has a nonlinear relation for Bi
2
O
3
concentration.
3.4
27
Al-NMR spectra
27
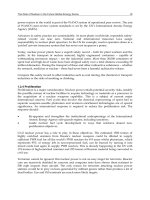
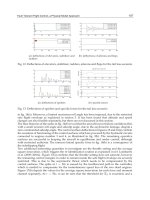
The Al-NMR spectra in BiSG are shown in Fig. 6(Fujimoto & Nakatsuka 2006).
27
Al
chemical shifts were measured relative to Al(H
2
O)
6
3+
. The measured samples were A-series,
New Infrared Luminescence from Bi-doped Glasses
33
C2, and α-Al
2
O
3
. α-Al
2
O
3
with a 6-fold coordinated state of corundum structure was used as
a standard sample, and a peak exists at 15 ppm. The peaks at 70 and –40 ppm (marked by
asterisks) were derived from spinning sidebands. The peaks of
27
Al-NMR from A1 to A3
only exist at 15 ppm and are the same as α-Al
2
O
3
. The A4 peak is still dominated by the 15
ppm peak, but a peak around 50 ppm begins to emerge, and then a peak of 56.4 ppm
becomes dominant in A5 (Fig. 6(b)).
0
50
100
150
200
250
-100-50050100
Intensity [a.u.]
Chemical shift [ppm]
α-Al
2O3
A1
A2
A3
A4
A5
C2
**
*
*
*
*
*
*
*
*
*
*
(a)
-10
0
10
20
30
40
-100-50050100
Intensity [a.u.]
Chemical shift [ppm]
A1-A3, C2, α-Al
2O3
A4
A5×0.3
(b)
Fig. 6.
27
Al-NMR spectra of A1–A5, C2, and α-Al
2
O
3
: (a) whole view of spectra, and (b)
expanded view of spectra in intensity scale
Sample A4, which includes Al
2
O
3
of 2.3 mol%, has a weak 50 ppm peak in the
27
Al-NMR
spectrum, while sample C2, which has the same amount of Al
2
O
3
without Bi
2
O
3
, shows no
signal around 50 ppm (Fig. 6(b)), suggesting that the Bi ion affects ACS over a 1.0 mol% of
Bi
2
O
3
concentration. On the other hand, since the C2 spectrum is dominated by a peak at 15
ppm, the aluminum ions in the silica glass naturally configure the 6-fold coordinated state of
the corundum structure up to 2.3 mol% of Al
2
O
3
without Bi
2
O
3
. This is also supported by the
work of Mysen et al., who concluded the aluminum ions in silica glass work as a network
modifier rather than a network former up to a 6.1 mol% Al
2
O
3
concentration in the
measurement of Raman spectra(Mysen, Virgo et al. 1980). The Al corundum structure
dominates ACS at lower Bi concentration up to 0.5 mol%, so the Al corundum structure
clearly has certain important roles for the generation of the Bi luminescent center in BiSG.
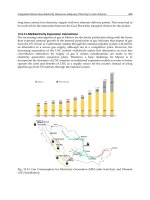
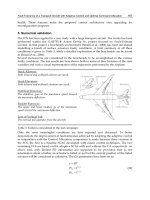
3.5 XRD measurements
The XRD data of the BiSG samples were measured to check for existing crystallizations,
including undissolved alumina, mullite, or crystbalite because crystallization influences the
27
Al-NMR spectra. The measured samples are A-series. Fig. 7 shows the XRD data on
Advances in Solid-State Lasers: Development and Applications
34
samples A4, α-Al
2
O
3
(alumina), and pure silica with a range between 10 and 80° in 2θ.
Sample A4 is substituted for the other BiSG ones because these XRD patterns are almost the
same. The peaks due to any kind of crystallization are not recognized in Fig. 7, especially
undissolved alumina, where there is only a halo pattern. We previously confirmed an XRD
pattern on a Nd
2
O
3
(3 wt%; 0.55 mol%)-SiO
2
(97 wt%; 99.45 mol%) system that included
undissolved 0.55 mol% of Nd
2
O
3
at best(Fujimoto & Nakatsuka 1997). 7.0 mol% of alumina
(at maximum in this experiment) is probably an adequate quantity for XRD detection if the
quantity is changed to undissolved alumina or other crystals in the sample. Therefore, it is
concluded that all our samples are in the amorphous phase.
0
1000
2000
3000
4000
5000
6000
10 20 30 40 50 60 70 80
Intensity [a.u.]
2θ [degree]
α-Al
2O3
Pure silica
A4
Fig. 7. XRD patterns on α-Al
2
O
3
(alumina), sample A4 and pure silica with range between
10° and 80° in 2θ
3.6 ESR measurements
The presence of unpaired electrons in BiSG was verified by ESR signal. The measured
sample was B2 and B3. There was no ESR signal due to the unpaired electrons for both B2
and B3, even at liquid N
2
temperature. The same phenomena without signals were also
reported on Bi-doped multi-component glasses(Peng, Wang et al. 2005; Peng, Wu et al.
2008). According to Hund’s rule, the valence states of bismuth ions without unpaired
electrons should be Bi
3+
(~5d
10
6s
2
) or Bi
5+
(~5d
10
)(Ohkura, Fujimoto et al. 2007).
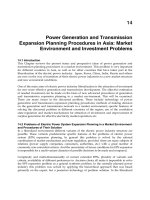
3.7 XPS measurements
3.7.1 Analysis on chemical shift
The results of the XPS measurements are shown in Fig. 8. The measured samples were A4,
A5, and three standards, NaBiO
3
, Bi
2
O
3
, and Bi-metal. The main Bi(4f
5/2
, 4f
7/2
) peaks of Bi
2
O
3
exist at 163.7 and 158.4 eV, respectively. Bi-metal was treated with 3-minute etching by Ar-
beam in a vacuum chamber (1.0×10
-7
Torr) to eliminate the oxidized Bi-metal surface before
the measurement. Even after the treatment, weak residual peaks were found due to Bi
2
O
3
.
The main Bi(4f
5/2
, 4f
7/2
) peaks of the Bi-metal exist at 162.4 and 157.1 eV, respectively. These
Bi
2
O
3
and Bi-metal peaks well agree with those previously reported(Wagner 1990; Saffarini
New Infrared Luminescence from Bi-doped Glasses
35
& Saiter 2000), and the chemical shifts of Bi
2
O
3
and Bi-metal are very stable in the XPS
measurement. NaBiO
3
is often used as a standard of the penta-valent state of Bi, but in our
experiment, the main Bi(4f
5/2
, 4f
7/2
) peaks of NaBiO
3
were obtained at 163.8 and 158.5 eV
corresponding to the Bi
2
O
3
ones, and the second Bi(4f
5/2
, 4f
7/2
) peaks exist at higher bonding
energy at 165.9 and 160.6 eV, respectively. The peaks of both BiSGs, that is, A4 and A5, are
located at almost the same position at the second NaBiO
3
peaks. After arranging the
chemical shifts for the measured samples, the order of the bonding energy is as follows:
[lower bonding energy] Bi metal (Bi
0
) -> Bi
2
O
3
(Bi
3+
), first peaks of NaBiO
3
(Bi
3+
) -> second
peaks of NaBiO
3
(Bi
5+
) = BiSG (A4, A5) [higher bonding energy]
In general, the valence state of the target ion becomes higher with increased bonding
energy(Wagner 1990), and the same tendency is observed in my measurement. Therefore, Bi
ions of the penta-valent state exist in BiSG.
156158160162164166168
0
1000
2000
3000
4000
5000
6000
Intensity [a.u.]
Bonding energy [eV]
A4
A5
NaBiO
3
Bi2O3
Bi metal
Fig. 8. XPS peaks of Bi(4f
5/2
, 4f
7/2
) on A4, A5, NaBiO
3
, Bi
2
O
3
, and Bi-metal. In observation
order of binding energy, [lower bonding energy] Bi metal (Bi
0
) -> Bi
2
O
3
(Bi
3+
), first peaks of
NaBiO
3
(Bi
3+
) -> second peaks of NaBiO
3
(Bi
5+
) = BiSG (A4, A5) [higher bonding energy].
The peak positions of NaBiO
3
, however, seem unstable. The previously reported Bi(4f
5/2
,
4f
7/2
) peaks(Kulkarni, Vijayakrishnan et al. 1990) were 164.1 and 158.7 eV, respectively, and
they showed single peaks with almost the same binding energy of the Bi
2
O
3
ones. In fact,
although we measured the XPS data on the NaBiO
3
several times, the ratio of the main
peaks corresponding to Bi
2
O
3
to the second peaks was unstable. Therefore, we put the most
probable XPS data of NaBiO
3
in Fig. 8.
Kumada et al.(Kumada, Takahashi et al. 1996; Kumada, Kinomura et al. 1999) reported that
NaBiO
3
and LiBiO
3
are synthesized at 120-200°C and that the Bi
5+
state is changed to a Bi
3+
state over 400°C; similar unstability may occur for the Bi
5+
state in NaBiO
3
. The standard
Advances in Solid-State Lasers: Development and Applications
36
material of NaBiO
3
was identified as NaBiO
3
•2H
2
O by XRD in Kumada’s experiment. They
also reported that Na ions in the A-site (A
+
B
5+
O
3
) tend to be exchanged for Sr
2+
or Ba
2+
ions
in NaBiO
3
•nH
2
O, and then the redistributed Bi ions in the A-site take the Bi
3+
state(Kumada,
Kinomura et al. 1999). Although they neglected to mention the redistribution of Bi ions in
NaBiO
3
themselves, a similar phenomenon may occur for NaBiO
3
in their experiment.
3.7.2 Analysis on peak separation
By precisely observing the peak positions and the line widths, we recognized that the A4
peaks were slightly shifted to higher bonding energy than A5 and that the line widths of A4
and A5 were wider than the standards. Since the A4 and A5 peaks are composed of two or
more peaks, we separated them with a Gaussian fitting curve to examine the origin of the
peak shift. In this procedure, we make the following assumptions:
1. If such Bi ionic states as Bi
0
or Bi
3+
are considered identical, the line widths of Bi(4f
5/2
,
4f
7/2
) are also identical.
2. The line widths of Bi 4f
5/2
and Bi 4f
7/2
are the same.
3. The ratio of Bi 4f
5/2
to Bi 4f
7/2
is constant for different ionic states in a sample. This ratio
is theoretically calculated as Bi
4
f
5/2
/Bi
4
f
7/2
=l/(l+1)=3/4(Seah 1983).
The results are shown in Table 3. The peak separation results show five peak positions for
all Bi 4f
5/2
and Bi 4f
7/2
peaks that are normalized at 100. No. 5 corresponds to Bi
0
, No. 4 to
Bi
3+
, and No. 1 to Bi
5+
. Nos. 2 and 3 are the intermediate states between numbers 1 and 4,
and these states have intermediate coordination states rather than intermediate valence
states such as Bi
4+
due to the ESR measurements. These results show that all the Bi ions in
BiSG are not the penta-valent state, and therefore the Bi valence states were mixed states of
Bi
3+
with Bi
5+
. This mixed valence state of Bi
3+
and Bi
5+
is also supported by EXAFS analysis
Bi 4f
5/2
(Bi 4f
7/2
)
Sample
1 2 3 4 5
Peak [eV] 166.0(160.6) 164.9(159.5)
FWHM [eV] 1.7 1.7
A4
Height 100.0 64.6
Peak [eV] 166.2(160.8) 165.1(159.8)
FWHM [eV] 1.9 1.9
A5
Height 50.6 100.0
Peak [eV] 165.9(160.6) 164.6(159.3) 163.8(158.5)
FWHM [eV] 1.8 1.4 1.4
NaBiO
3
Height 38.6 35.0 100.0
Peak [eV] 164.7(159.4) 163.7(158.4)
FWHM [eV] 1.4 1.4
α-Bi
2
O
3
Height 19.9 100.0
Peak [eV] 164.6(159.3) 163.4(158.1) 162.4(157.1)
FWHM [eV] 1.4 1.4 1.1
Bi metal
Height 22.4 22.4 100.0
Table 3. Peak separation results on Bi(4f
5/2
, 4f
7/2
) of A4, A5, NaBiO
3
, α-Bi
2
O
3
, and Bi-metal.
Peak position, FWHM, and normalized peak height are listed. Peak-heights are normalized
at 100.
New Infrared Luminescence from Bi-doped Glasses
37
in the next section. The peak height ratio of Nos. 1 and 2 is counterchanged for A4 and A5
due to the existence ratio of Bi
3+
and Bi
5+
. Thus, the peaks of A4 are slightly shifted due to
higher bonding energy than A5.
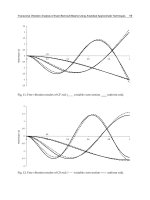
3.8 Bi-O distance from EXAFS
Figure 9 shows the radial structure functions (RSF) to which the EXAFS oscillations were
Fourier-transformed. The measured samples were A-series (A2~A5) and the two standards
of α-Bi
2
O
3
and NaBiO
3
. The peak shown in about 1.0 Å is derived from the XANES region
because it is too short for any Bi-O distance. Therefore, it is a ghost peak, and we conclude
that the largest peak around 1.6-1.7 Å (the first relevant peak) corresponds to the first
neighboring Bi-O bond. α-Bi
2
O
3
and NaBiO
3
have the second peak at 3.5 and 3.2 Å,
respectively. Since the BiSG ones have no secondary peak, the local environment of the Bi
ion does not have any periodical structure; that is, BiSG should be an amorphous phase.
These results are supported by the XRD data in Section 3.5. The RSF shows that all the BiSG
peaks are about 0.1 Å shorter than α-Bi
2
O
3
. The NaBiO
3
peak is also shifted to a shorter
position, but the line width is wider than that of any of the BiSG ones. Since RSF |F(r)|
includes a phase shift, the radial distance in RSF shifted a shorter range than the actual Bi-O
distance. To determine the length of the first neighboring Bi-O, the RSF of α-Bi
2
O
3
and the
BiSG samples were analyzed by the curve-fitting method in r-space with FEFF 8.2. In this
curve-fitting calculation, we only took two coordination spheres due to the parameter
number limitation in FEFF 8.2.
-8
-6
-4
-2
0
2
4
6
8
01234
Magnitude of the FT [a.u.]
R [Å]
α-Bi
2O3
A2
A3
A4
A5
NaBiO3
Fig. 9. Radial structure functions (RSF) of A-series (A2~A5), α-Bi
2
O
3
and NaBiO
3
The fitting results of the BiSG samples, α-Bi
2
O
3
and NaBiO
3
, are listed in Table 4. We
assumed amplitude reduction factor S
0
2
= 0.9(Manzini, Lottici et al. 1998) and absorption
Advances in Solid-State Lasers: Development and Applications
38
edge energy E
0
= 13426.5 eV. The fitting range was selected from 1.2 to 2.1 Å in RSF (Fig. 9).
The Bi-O distances of the first and second coordination spheres for BiSG were calculated as
about 2.1 and 2.3 Å, respectively; on the other hand, the Bi-O distances for α-Bi
2
O
3
were 2.2
and 2.4 Å, respectively. The Bi-O distance of 2.1 Å in BiSG is in good agreement with the
previously reported Bi
5+
-O distance in LiBi(5+)O
3
(Kumada, Takahashi et al. 1996) and
Bi
2
(3+,5+)O
4
(Kumada, Kinomura et al. 1995). Therefore, the existence of the Bi
5+
state is also
indicated from the Bi-O distance in BiSG, and the first coordination sphere corresponds to
the Bi
5+
-O distance. The second coordination sphere of 2.3Å corresponds to the Bi
3+
-O
distance(Ohkura, Fujimoto et al. 2007). Therefore, the EXAFS curve-fitting results also show
that the mixed valence state of the Bi ions exists in BiSG as Bi
3+
and Bi
5+
.
The Bi-O distance of the first coordination sphere in the A-series is slightly shifted to a
longer range with increased Bi
2
O
3
concentration in Table 4. The ratio of Bi
3+
to Bi
5+
increases
with increased Bi
2
O
3
concentration, and the change of the Bi
3+
to Bi
5+
ratio can also explain
the non-linear increment of LMI. NaBiO
3
is a well-known material as a standard for penta-
valent state Bi ions. The first coordination state distance of NaBiO
3
is longer than the
expected value of the Bi
5+
-O distance. This valence state of Bi ions in NaBiO
3
is also the
mixed state of Bi
3+
and Bi
5+
. These phenomena are also supported by the peak separation
data of XPS.
First coordination sphere Second coordination sphere
Samples
N
1
R
1
σ
1
2
(Å
2
)
N
2
R
2
σ
2
2
(Å
2
)
R-
factor(%)
α-Bi
2
O
3
2.01 2.18 3.91E-03 0.74 2.40 4.07E-03 8.82
NaBiO
3
7.15 2.13 3.89E-03 3.12 2.38 4.06E-03 0.89
A2 2.19 2.08 3.89E-03 1.11 2.32 4.06E-03 1.65
A3 2.05 2.08 3.89E-03 1.33 2.31 4.06E-03 2.50
A4 1.81 2.11 3.89E-03 1.05 2.31 4.06E-03 2.84
A5 1.86 2.13 3.89E-03 0.99 2.33 4.06E-03 3.04
Table 4. FEFF fitting results providing two coordination spheres. Fitting results of A-series
(A2~A5), α-Bi
2
O
3
, and NaBiO
3
are listed.
3.9 Discussion (local structure of luminescent center)
In the previous section, several physical phenomena were observed in BiSG, especially
regarding the local structure of the distinctive luminescent center. Now we consider the
structural configuration on the Bi luminescent center.
First, the roles of the Al
2
O
3
additive can be understood by luminescent intensity
measurement. Based on Fig. 5, the luminescent intensity of A4, which includes 2.3 mol% of
Al
2
O
3
, is three orders of magnitude larger than that of C1 without Al
2
O
3
; clearly, the Al
2
O
3
additive remarkably increases the generation of the Bi luminescent center. Second, Al
2
O
3
assists the Bi ions to enter the silica glass network because C1 has no glassy wetting. This
tendency is also supported by the phase diagram of the Bi
2
O
3
-Al
2
O
3
-SiO
2
glass system,
because the glassy phase is likely achieved at the Al
2
O
3
-rich composition. Therefore,
aluminum ions have two roles in BiSG:
New Infrared Luminescence from Bi-doped Glasses
39
1. They assist the configuration of the distinctive luminescent center of Bi ions with a
coupling effect that denotes that an aluminum ion behaves like a “generator” of the
luminescent center.
2. They increase compatibility with the silica network.
These aluminum ion roles imply that both the Bi and Al atoms should be close together in
BiSG. Based on the above discussion, the image view between Bi and Al ions in BiSG is
illustrated in Fig. 10(a). Peng et al.(Peng, Qiu et al. 2005) reported that Ta ions also work as a
“generator.” Although aluminum is not the only element that behaves as a generator, the
aluminum ion accepts its important role in the Bi
2
O
3
-Al
2
O
3
-SiO
2
glass system.
Fig. 10. Image view on local structure of infrared Bi luminescent center in BiSG: (a) image
view determined by PDG (phase diagram) and LMI, (b) by
27
Al-NMR, (c) by ESR, (d) by
XPS, EXAFS, (e) local structure of infrared Bi luminescent center.
Advances in Solid-State Lasers: Development and Applications
40
Next, the aluminum cordination state (ACS) should be close to the Bi ion in BiSG, as seen
from the
27
Al-NMR results. Since the relation between ACS and the chemical shift in the
27
Al-NMR measurement has been well studied(Laussac, Enjalbert et al. 1983), ACS is
determined by a chemical shift in comparison between the standard materials and the target
samples. In the case of BiSG, ACS is dominated by the α-Al
2
O
3
corundum structure at lower
Bi
2
O
3
concentration up to 0.5 mol%. Al ions with corundum structure are crucial to generate
a distinctive luminescent center, and the Al coordination state located near Bi should be a 6-
fold corundum structure. Based on the above discussion, the image view between Bi and Al
is illustrated in Fig. 10(b).
Next, information on the valence states of the Bi ions in BiSG is given by ESR measurements.
Of course, it’s not only for Bi ions, but since no signal exists for the unpaired electrons in the
whole BiSG, the valence states of Bi ions without unpaired electrons are Bi
3+
or Bi
5+
. These
results show Bi
3+
or Bi
5+
ions close to the 6-fold coordination state of the Al ions. Based on
the above discussion, the image view between Bi and Al is illustrated in Fig. 10(c).
Three types of coordination states of Bi
3+
exist, including 5-, 6-, and 8-fold; on the other
hand, only 6-fold coordination exists for Bi
5+
(Shannon 1976). Since BiSG is an oxide material,
it is estimated that the neighboring ions of the Bi ion are oxygen. Although the ionic radius
of O
2-
has few differences with the coordination number, variation exists between 1.35 and
1.42 Å. If the coordination number of O
2-
is 4, Bi
3+
(5)-O
2-
(4), Bi
3+
(6)-O
2-
(4), and Bi
5+
(6)-O
2-
(4)
are calculated to be 2.34, 2.41, and 2.12 Å, respectively(Shannon 1976). The Bi-O distances in
typical crystals including Bi
3+
or Bi
5+
, such as LiBiO
3
(Kumada, Takahashi et al. 1996) or
Bi
2
O
4
(Kumada, Kinomura et al. 1995), show that the Bi
5+
-O distance is 2.1 Å. This value
agrees well with the 2.1 Å of the first coordination sphere for A4 and A5. But the Bi
3+
-O
distance varies from 2.15 to 3.26 Å in α-Bi
2
O
3
(Harwig 1978) or Bi
2
O
4
(Kumada, Kinomura et
al. 1995). Therefore, the EXAFS data show that the Bi
5+
ionic state exists in BiSG, and this is
also supported by the XPS data. The previously reported Bi
3+
spectroscopic properties are
quite different in luminescent and absorption spectra and lifetime. It is concluded that the Bi
valence state of the Bi luminescent center is Bi
5+
, not Bi
3+
. Therefore, the luminescent center
model of Bi
5+
with 6-fold coordination is expected to be close to Al
3+
with 6-fold
coordination of the corundum structure (Fig. 10(d)). Since the neighboring atom is oxygen,
the local structure of the distinctive bismuth luminescent center is expected (Fig. 10(e)).
4. Applications
After the discovery of a new infrared luminescent bismuth center, several research groups
started to study its applications, such as optical amplification(Fujimoto & Nakatsuka 2003;
Seo, Fujimoto et al. 2006; Seo, Fujimoto et al. 2006; Ren, Wu et al. 2007; Ren, Dong et al. 2007;
Ren, Qiao et al. 2007; Seo, Lim et al. 2007), waveguide inscription(Psaila, Thomson et al.
2006), or laser oscillation(Dianov, Dvoyrin et al. 2005; Dianov, Shubin et al. 2007;
Razdobreev, Bigot et al. 2007; Rulkov, Ferin et al. 2007; Truong, Bigot et al. 2008) using Bi
luminescent materials.
With respects to device applications, optical fibers with Bi luminescent center in the core
material are very curious. Optical amplification around 1.3 µm with Bi-doped multi-
component glass fiber was achieved by Seo et al.(Seo, Fujimoto et al. 2006), and this is useful
for metro area network optical amplifiers. Laser oscillation with Bi-doped optical fiber was
firstly demonstrated by Dianov’s group in 2005(Dianov, Dvoyrin et al. 2005), then the
possibility of Bi-doped fiber is actively developed, now the oscillation power has achieved
New Infrared Luminescence from Bi-doped Glasses
41
at 15 W at 1160 nm(Bufetov & Dianov 2009). It is known that the 570 – 590 nm band is very
promising for ophthalmology and dermatology applications, thus the second harmonic of Bi
fiber laser can be used in medical use. And the broad luminescence in near infrared region is
also useful for a light source of optical coherence tomography.
5. Conclusions
In this chapter, we introduce the basic properties of BiSG and the analyzed local structure of
Bi luminescent center. Several instrumental analyses, such as spectroscopic properties
(SPCT), LMI, NMR, XRD, ESR, XPS, and EXAFS were advanced on a Bi
2
O
3
-Al
2
O
3
-SiO
2
glass
system. The roles and the structure of the Al ions and the valence state of the luminescent Bi
ions were examined.
The following are the roles and the structure of the Al ions: 1) to assist the configuration of
the distinctive luminescent center of Bi ions with a coupling effect, which means that the
aluminum ion behaves like a “generator” of the luminescent center; 2) to increase
compatibility with the silica network; 3) to be a 6-fold corundum structure. The valence state
exmination of Bi ions in BiSG reveals the following: 1) Bi
3+
or Bi
5+
; 2) a mixed state of Bi
3+
and Bi
5+
; 3) Bi
5+
for the distinctive Bi luminescent center. Therefore, the distinctive bismuth
luminescent center model was investigated with a 6-fold coordination state of Bi
5+
that is
combined with the 6-fold corundum structure of Al
3+
through an oxygen ion (Fig. 10(e)).
These results will bridge to verify the energy diagram and the mechanism of Bi luminescent
center.
In the last place, this new infrared luminescent material, Bi-doped silica glass, which attains
sensational progress in the past decade will continue to give us curious possibilities in the
field of the optical science.
6. Acknowledgement
The EXAFS measurement in this work was performed under the approval of the Photon
Factory Program Advisory Committee (Proposal No. 2006G123).
7. References
M. J. Weber and R. R. Monchamp (1973). Luminescence of Bi4Ge3O12 : Spectral and decay
properties. J. Appl. Phys., Vol.44, 5495-5499.
S. Parke and R. S. Webb (1973). Optical Properties of Thallium, Lead and Bismuth in Oxide
Glasses. Journal of Physics and Chemistry of Solids, Vol.34, No.1, 85-95.
R. D. Shannon (1976). Revised Effective Ionic-Radii and Systematic Studies of Interatomic
Distances in Halides and Chalcogenides. Acta Crystallographica Section A, Vol.32,
No.Sep1, 751-767.
H. A. Harwig (1978). Structure of Bismuthsesquioxide - Alpha,Beta,Gamma and Delta-
Phase. Zeitschrift Fur Anorganische Und Allgemeine Chemie, Vol.444, No.Sep, 151-166.
B. O. Mysen, D. Virgo, et al. (1980). Relations between the Anionic Structure and Viscosity of
Silicate Melts - a Raman-Spectroscopic Study. American Mineralogist, Vol.65, No.7-8,
690-710.
Advances in Solid-State Lasers: Development and Applications
42
A. C. van der Steen, J. J. A. van Hesteren, et al. (1981). Luminescence of the Bi-3+ Ion in
Compounds LiLnO2 and NaLnO2 (Ln=Sc, Y, La, Gd, Lu). Journal of the
Electrochemical Society, Vol.128, No.6, 1327-1333.
D. B. a. M. P. Seah (1983). Practical surface analysis : by auger and X-ray photo-electron
spectroscopy. New York, Wiley.
J. P. Laussac, R. Enjalbert, et al. (1983). Tetracoordinated, Penta-Coordinated and
Hexacoordinated Aluminum - Nmr and X-Ray-Diffraction Studies of the
Complexes of Ethylenediamine with Aluminum Isopropoxide and Its Fluoro
Analogs. Journal of Coordination Chemistry, Vol.12, No.3, 133-143.
C. D. Wagner (1990). Auger and x-ray photoelectron spectroscopy. New York, John Wiley.
G. U. Kulkarni, V. Vijayakrishnan, et al. (1990). State of Bismuth in BaBiO3 and BaBi1-
xPbxO3 - Bi 4f Photoemission and Bi L3 Absorption Spectroscopic Studies. Applied
Physics Letters, Vol.57, No.17, 1823-1824.
H. Scholze (1991). Glass : nature, structure, and properties. New York, Springer-Verlag.
S. N. Narang, N. D. Patel, et al. (1994). Infrared and Raman Spectral Studies and Normal-
Modes of Alpha-Bi2O3. Journal of Molecular Structure, Vol.327, No.2-3, 221-235.
N. Kumada, N. Kinomura, et al. (1995). Crystal-Structure of Bi2O4 with Beta-Sb2O4-Type
Structure. Journal of Solid State Chemistry, Vol.116, No.2, 281-285.
N. Sugimoto, H. Kanbara, et al. (1996). Ultrafast response of third-order optical nonlinearity
in glasses containing Bi2O3. Optics Letters, Vol.21, No.20, 1637-1639.
N. Kumada, N. Takahashi, et al. (1996). Preparation and crystal structure of a new lithium
bismuth oxide: LiBiO3. Journal of Solid State Chemistry, Vol.126, No.1, 121-126.
Y. Fujimoto and M. Nakatsuka (1997). A novel method for uniform dispersion of the rare
earth ions in SiO2 glass using zeolite X. Journal of Non-Crystalline Solids, Vol.215,
No.2-3, 182-191.
I. Manzini, P. P. Lottici, et al. (1998). EXAFS at the BiLIII edge in Bi4Ge3O12 and in
xBi(2)O(3)-(100-x)GeO2 glasses. Journal of Non-Crystalline Solids, Vol.224, No.1, 23-
30.
N. Kumada, N. Kinomura, et al. (1999). Ion-exchange reaction of Na+ in NaBiO3 center dot
nH(2)O with Sr2+ and Ba2+. Solid State Ionics, Vol.122, No.1-4, 183-189.
PDF#30-1161 (2000). Powder diffraction file : alphabetical indexes for experimental patterns
: inorganic phases : sets 1-50. Newtown Square, Pa. , ICDD, International Center for
Diffraction Data.
G. Saffarini and J. M. Saiter (2000). X-ray photoelectron spectroscopic measurements on
glassy Ge20S80-xBix (x=0,16). Materials Letters, Vol.46, No.6, 327-331.
Y. Fujimoto and M. Nakatsuka (2001). Infrared luminescence from bismuth-doped silica
glass. Japanese Journal of Applied Physics Part 2-Letters, Vol.40, No.3B, L279-L281.
Y. Fujimoto and M. Nakatsuka (2003). Optical amplification in bismuth-doped silica glass.
Applied Physics Letters, Vol.82, No.19, 3325-3326.
M. Y. Peng, J. R. Qiu, et al. (2004). Bismuth- and aluminum-codoped germanium oxide
glasses for super-broadband optical amplification. Optics Letters, Vol.29, No.17,
1998-2000.
M. Y. Peng, X. G. Meng, et al. (2005). GeO2 : Bi, M (M = Ga, B) Glasses with Super-Wide
Infrared Luminescence. Chemical Physics Letters, Vol.403, No.4-6, 410-414.
M. Y. Peng, J. R. Qiu, et al. (2005). Broadband infrared luminescence from Li2O-Al2O3-ZnO-
SiO2 glasses doped with Bi2O3. Optics Express, Vol.13, No.18, 6892-6898.
New Infrared Luminescence from Bi-doped Glasses
43
M. Y. Peng, J. R. Qiu, et al. (2005). Superbroadband 1310 nm emission from bismuth and
tantalum codoped germanium oxide glasses. Optics Letters, Vol.30, No.18, 2433-
2435.
E. M. Dianov, V. V. Dvoyrin, et al. (2005). CW bismuth fibre laser. Quantum Electronics,
Vol.35, No.12, 1083-1084.
X. G. Meng, J. R. Qiu, et al. (2005). Infrared broadband emission of bismuth-doped barium-
aluminum-borate glasses. Optics Express, Vol.13, No.5, 1635-1642.
X. G. Meng, J. R. Qiu, et al. (2005). Near infrared broadband emission of bismuth-doped
aluminophosphate glass. Optics Express, Vol.13, No.5, 1628-1634.
M. Y. Peng, C. Wang, et al. (2005). Investigations on bismuth and aluminum co-doped
germanium oxide glasses for ultra-broadband optical amplification. Journal of Non-
Crystalline Solids, Vol.351, No.30-32, 2388-2393.
Y. Fujimoto and M. Nakatsuka (2006). Al-27 NMR structural study on aluminum
coordination state in bismuth doped silica glass. Journal of Non-Crystalline Solids,
Vol.352, No.21-22, 2254-2258.
Y. S. Seo, Y. Fujimoto, et al. (2006). Optical amplification in a bismuth-doped silica glass at
1300 nm telecommunications window. Optics Communications, Vol.266, No.1, 169-
171.
Y. S. Seo, Y. Fujimoto, et al. (2006). Simultaneous amplification at two wavelengths near 1300
nm in a 6.5-cm-long bismuth-doped silica glass. Ieee Photonics Technology Letters,
Vol.18, No.17-20, 1901-1903.
X. J. Wang and H. P. Xia (2006). Infrared superbroadband emission of Bi ion doped
germanium-aluminum-sodium glass. Optics Communications, Vol.268, No.1, 75-78.
T. Suzuki and Y. Ohishi (2006). Ultrabroadband near-infrared emission from Bi-doped Li2O-
Al2O3-SiO2 glass. Applied Physics Letters, Vol.88, No.19, 191912.
H. P. Xia and X. J. Wang (2006). Near infrared broadband emission from Bi5+-doped Al2O3-
GeO2-X (X=Na2O,BaO,Y2O3) glasses. Applied Physics Letters, Vol.89, No.5, 051917.
N. D. Psaila, R. R. Thomson, et al. (2006). Femtosecond laser inscription of optical
waveguides in bismuth ion doped glass. Optics Express, Vol.14, No.22, 10452-10459.
V. V. Dvoyrin, V. M. Mashinsky, et al. (2006). Bismuth-doped-glass optical fibers - a new
active medium for lasers and amplifiers. Optics Letters, Vol.31, No.20, 2966-2968.
T J. J. Ren, L. Y. Yang, et al. (2006). Effect of various alkaline-earth metal oxides on the
broadband infrared luminescence from bismuth-doped silicate glasses. Solid State
Communications, Vol.140, No.1, 38-41.
T. Ohkura, Y. Fujimoto, et al. (2007). Local structures of bismuth ion in bismuth-doped silica
glasses analyzed using bi L-III x-ray absorption fine structure. Journal of the
American Ceramic Society, Vol.90, No.11, 3596-3600.
Y. Fujimoto, Y. Hirata, et al. (2007). Effect of GeO2 additive on fluorescence intensity
enhancement in bismuth-doped silica glass. Journal of Materials Research, Vol.22,
No.3, 565-568.
E. M. Dianov, A. V. Shubin, et al. (2007). High-power cw bismuth-fiber lasers. Journal of the
Optical Society of America B-Optical Physics, Vol.24, No.8, 1749-1755.
T. Murata and T. Mouri (2007). Matrix effect on absorption and infrared fluorescence
properties of Bi ions in oxide glasses. Journal of Non-Crystalline Solids, Vol.353,
No.24-25, 2403-2407.
Advances in Solid-State Lasers: Development and Applications
44
M. Y. Peng, D. P. Chen, et al. (2007). Bismuth-doped zinc aluminosilicate glasses and glass-
ceramics with ultra-broadband infrared luminescence. Optical Materials, Vol.29,
No.5, 556-561.
I. Razdobreev, L. Bigot, et al. (2007). Efficient all-fiber bismuth-doped laser. Applied Physics
Letters, Vol.90, No.3,
J. Ren, B. Wu, et al. (2007). Broadband optical amplification near 1300 nm in bismuth-doped
germanate glass. Applied Physics B-Lasers and Optics, Vol.88, No.3, 363-366.
J. J. Ren, H. F. Dong, et al. (2007). Ultrabroadband infrared luminescence and optical
amplification in bismuth-doped germanosilicate glass. Ieee Photonics Technology
Letters, Vol.19, No.17-20, 1395-1397.
J. J. Ren, Y. B. Qiao, et al. (2007). Optical amplification near 1300 nm in bismuth-doped
strontium germanate glass. Journal of the Optical Society of America B-Optical Physics,
Vol.24, No.10, 2597-2600.
J. J. Ren, J. R. Qiu, et al. (2007). Infrared luminescence properties of bismuth-doped barium
silicate glasses. Journal of Materials Research, Vol.22, No.7, 1954-1958.
J. J. Ren, J. R. Qiu, et al. (2007). Ultrabroad infrared luminescence from Bi-doped
aluminogermanate glasses. Solid State Communications, Vol.141, No.10, 559-562.
J. J. Ren, J. R. Qiu, et al. (2007). Ultrabroad infrared luminescences from Bi-doped alkaline
earth metal germanate glasses. Journal of Materials Research, Vol.22, No.6, 1574-1578.
A. B. Rulkov, A. A. Ferin, et al. (2007). Narrow-line, 1178nm CW bismuth-doped fiber laser
with 6.4W output for direct frequency doubling. Optics Express, Vol.15, No.9, 5473-
5476.
Y. S. Seo, C. Lim, et al. (2007). Bismuth-doped silica glass as a new laser material. Journal of
the Korean Physical Society, Vol.51, No.1, 364-367.
G. Yang, D. P. Chen, et al. (2007). Effects of melting temperature on the broadband infrared
luminescence of bi-doped and Bi/Dy co-doped chalcohalide glasses. Journal of the
American Ceramic Society, Vol.90, No.11, 3670-3672.
S. F. Zhou, G. F. Feng, et al. (2007). Broadband near-infrared emission from Bi-doped
aluminosilicate glasses. Journal of Materials Research, Vol.22, No.6, 1435-1438.
Y. Arai, T. Suzuki, et al. (2007). Ultrabroadband near-infrared emission from a colorless
bismuth-doped glass. Applied Physics Letters, Vol.90, No.26, 261110.
V. G. Truong, L. Bigot, et al. (2008). Study of thermal stability and luminescence quenching
properties of bismuth-doped silicate glasses for fiber laser applications. Applied
Physics Letters, Vol.92, No.4, 041908.
J. J. Ren, G. P. Dong, et al. (2008). Inhomogeneous broadening, luminescence origin and
optical amplification in bismuth-doped glass. Journal of Physical Chemistry A,
Vol.112, No.14, 3036-3039.
J. R. Qiu, M. Y. Peng, et al. (2008). Novel Bi-doped glasses for broadband optical
amplification. Journal of Non-Crystalline Solids, Vol.354, No.12-13, 1235-1239.
M. Y. Peng, B. T. Wu, et al. (2008). Bismuth-activated luminescent materials for broadband
optical amplifier in WDM system. Journal of Non-Crystalline Solids, Vol.354, No.12-
13, 1221-1225.
I. A. Bufetov and E. M. Dianov (2009). Bi-doped fiber lasers.
Laser Physics Letters, Vol.6, No.7,
487-504.
3
Faraday Isolators
for High Average Power Lasers
Efim Khazanov
Institute of Applied Physics of the Russian Academy of Science, N. Novgorod
Russia
1. Introduction
The average power of solid-state and fiber lasers has considerably increased during the last
ten years. The 10 kW power is not record-breaking any longer, and a topical problem
nowadays is to create lasers with a power of 100 kW. Therefore, the study of thermal effects
caused by absorption of laser radiation in the bulk of optical elements becomes ever more
important. The Faraday isolator (FI) strongly depends on these effects because its magneto-
optical elements (MOEs) are relatively long and its absorption α
0
is 10
−
3
…10
−
2
сm
−
1
, see
Table 1. As a result, heat release power is at least tenths of percent of transmitted laser
power P
0
.
V
1.06 μm
dГ
dV
V
1
κ
α
0
ξ
α
T
|Q|
dn/dT P
rad/T/m 10
-3 /
K W/K/m 10
-3
/cm 10
-7/
K 10
-7/
К 10
-6/
К 10
-6/
К
TGG 39
1; 2
35
3-5
36
6
40
7
3.5
8
4.4±0.1
9
4.5±0.5
10
5.3±0.5
11
7.4
5; 12-15
2
15
1-6
14
4.8
13
1.4-4.2
16
2.5
17
1.6
18
2.2
16
2.25
13
94
15
67-72
9
40
5
17
13
*
)
20
15
19
13
18-21
9
17
13
*
)
MOС101 8.7
1; 2; 19
4
19
1
1
; 2.3
19
1
MOC105 17
1
; 18
2; 19
5
19
0.51
20
2.3
19
1 82
21
6
20
0.6
21
MOC04 21
1; 2; 19
0.74
20
1
1
; 2.3
19
1 49
21
9
20
8.7
21
MOC10 28
2; 19
; 26
1
0.68
20
2
1
; 4.6
19
1 56
21
8.5
20
8.5
21
FR–5 21
1; 4
3.4
22
0.84
15
3
1
; 10
15
1 47
15
9
20
7.5
15
Table 1. Property of magneto-optical materials. MOC 10 is analog of М-24 (Kigre, USA).
*
)
assuming κ=5W/Km;
1
(Zarubina & Petrovsky, 1992),
2
(Zarubina et al., 1997),
3
(Chen et al., 1998),
4
(Jiang et al.,
1992),
5
(Kaminskii et al., 2005),
6
(Yasuhara et al., 2007),
7
(Raja et al., 1995),
8
(Barnes & Petway,
1992),
9
(Ivanov et al., 2009),
10
(Slack & Oliver, 1971),
11
(Chen et al., 1999),
12
(Wynands et al.,
1992),
13
(Khazanov et al., 2004),
14
(Mueller et al., 2002),
15
(Mansell et al., 2001),
16
(Khazanov
et al., 2002a),
17
(Mukhin et al., 2009),
18
(VIRGO-Collaboration, 2008),
19
(Malshakov et al.,
1997),
20
(Andreev et al., 2000a),
21
(Zarubina, 2000),
22
(Davis & Bunch, 1984).
Advances in Solid-State Lasers: Development and Applications
46
At P
0
=100 W (and higher) this gives rise to polarization distortions deteriorating the
isolation degree, and phase distortions – aberrations. Many applications require a
combination of high average power, high isolation degree, and small aberrations. Below we
shall demonstrate that although the methods well known for laser amplifiers can be used for
analyzing thermal effects in FI, yet one has to take into account specific features imposed by
the magnetic field (the Faraday effect). We shall overview theoretical and experimental
results of investigations of thermal effects in FIs and methods for their compensation and
suppression. Note that all the results reported below are valid not only for cw lasers but for
pulse lasers with high repetition rate as well.
Unlike FI, a Faraday mirror proposed in (Giuliani & Ristori, 1980) is used not for optical
isolation, but for compensation of birefringence in laser amplifiers (Carr & Hanna, 1985),
oscillators (Giuliani & Ristori, 1980), regenerative amplifiers (Denman & Libby, 1999) and
fiber optics as well (Gelikonov et al., 1987). Despite the great similarity between the Faraday
mirror and FI, there are two primary differences between them. First, the isolation in FI is
governed only by the depolarization in the second pass, whereas in the Faraday mirror the
polarization distortions are accumulated during both the passes. Second, the radiation that
is incident on the MOE in FI is linearly polarized, whereas the radiation that is incident on
the Faraday mirror has already been depolarized. We shall consider only FI; a Faraday
mirror for high power lasers is studied in (Khazanov, 2001; Khazanov et al., 2002b;
Khazanov, 2004).
In the absence of thermal effects in the MOE after the first pass (from left to right), a beam
retains its horizontal polarization (Fig. 1, 2) and passes through polarizer 4, while during the
return pass (from right to left), the polarization is altered to vertical and the beam is
reflected by polarizer 1.
Fig. 1. Traditional design of a Faraday isolator. 1,4 – polarizers; 2 – λ/2 plate; 3 – MOE.
Fig. 2. Cross-section of magneto-optical crystal: r, φ are polar coordinates; θ is angle of
inclination of the crystallographic axis; Ψ is angle of inclination of eigen polarization of
thermally induced birefringence.
C
−
C
+
D
−
1
2
3
4
magnetic field
out
p
ut
depolarization
B
–
A
−
out
p
ut
A
+
B
+
D
+
θ
φ
π/4
Ψ
x
y
crystallographic axis
thermall
y
induced birefrin
g
ence axis
r
R
Е(С
–
)
Е(В
–
)
Е(С
+
)=Е(А
–
)=Е(А
+
)
π
/8
λ
/2 plate axis
Е(В
+
)
Faraday Isolators for High Average Power Lasers
47
The light absorption in MOE generates a temperature distribution that is nonuniform over a
transverse cross section. This leads to three physical mechanisms affecting the laser
radiation: i) wave front distortions (thermal lens) caused by the temperature dependence of
the refraction index; ii) nonuniform distribution of the angle of polarization rotation because
of the temperature dependence of the Verdet constant and thermal expansion of the MOE;
and iii) simultaneous appearance not only of the circular birefringence (Faraday effect), but
also of the linear birefringence caused by mechanical strains due to the temperature gradient
(photoelastic effect).
The first mechanism (Zarubina et al., 1997) does not induce any polarization changes in laser
radiation and hence does not affect the isolation degree. The latter two mechanisms do alter
the polarization state of radiation. The temperature dependence of the Verdet constant and
thermal expansion lead to changes of the phase shift between eigen polarizations which
remain circular (Wynands et al., 1992). The photoelastic effect not only changes the phase
shift between eigen polarizations, but also alters the eigen polarizations themselves, which
become elliptical (Khazanov, 1999; Khazanov et al., 1999). In section 2 we discuss the
influence of all thermal effects on FI parameters and determine the figure of merit of
magneto-optical materials for high average power lasers.
Thermal effects in FI may be compensated by some additional optical elements or
suppressed (reduced) by choosing optimal FI parameters or geometries. Section 3 is devoted
to compensation of thermal lens (by means of an ordinary negative lens or a negative
thermal lens) and compensation of depolarization (by means of crystalline quartz placed
inside a telescope or by means of replacing one 45
0
MOE by two 22.5
0
MOEs and a λ/2 plate
or a 67.5
0
polarization rotator between them).
In section 4 we discuss the methods of thermal effects suppression: cooling FI to liquid
nitrogen temperature, shortening MOE using a strong magnetic field, employing several
thin discs cooled through optical surfaces, and using slabs and rectangular beams.
2. Thermal effects in Faraday isolators
2.1 Jones matrix of thermally loaded magneto-optical element
A non-uniformly heated MOE is a polarization phase plate that has simultaneously two
types of birefringence: circular due to the Faraday effect, and linear due to the photoelastic
effect. The circular birefringence is completely described by a phase shift between circular
eigen polarizations δ
с
; the polarization rotation angle is δ
с
/2=VBL, where B is magnetic field,
V and L are Verdet constant and length of MOE. Linear birefringence is described by a
phase shift between linear eigen polarizations δ
1
and an inclination angle Ψ of eigen
polarization relative to the x axis (Fig. 2). Such a polarization phase plate is described by the
Jones matrix (Tabor & Chen, 1969)
()
[]
()
⎟
⎟
⎟
⎟
⎠
⎞
⎜
⎜
⎜
⎜
⎝
⎛
Ψ+Ψ−
Ψ−−Ψ−
−=Ψ
2
2
2
22
2
2
0
0
coscotsin
sincoscot
sin)()(exp)exp(,,
δ
δδ
δ
δ
δ
δ
δ
δ
δ
δ
δ
δδ
δ
δδ
llc
lcl
lc
ii
ii
PTrTikLikLnF
,
(1)
where
3
0
11 12
1
()
41
T
n
dn
Ppp
dT
ν
α
ν
+
=− ⋅ +
−
(2)
Advances in Solid-State Lasers: Development and Applications
48
is a thermo-optical constant of MOE,
222
cl
δδδ
+= , and n
0
, ν, α
Т
, p
i,j
are “cold” refractive
index, Poisson’s ratio, thermal expansion coefficient, and photoelastic coefficients,
respectively, k=2π/λ, λ is wavelength in vacuum. Here and further we assume that the
temperature Т is uniform along the direction of beam propagation z. The second exponential
factor in (1) has no influence upon polarization distortions and is an isotropic thermal lens.
A contribution to this lens is made by the temperature dependence of the refraction index
and “isotropic” part of the photoelastic effect (see two corresponding terms in (2)). We also
assume that the contribution of thermal expansion is negligibly small in comparison with
the temperature dependence of the refractive index; and magnetic field B (and hence δ
с
)
does not depend on the longitudinal coordinate z. The case when B depends on z was
considered in (Khazanov et al., 1999).
For rod geometry δ
l
and Ψ are defined by the formulas (Soms & Tarasov, 1979):
()
⎟
⎟
⎟
⎠
⎞
⎜
⎜
⎜
⎝
⎛
=
∫
dr
dr
dT
r
r
L
r
l
0
2
2
1
4
ϕ
λ
πδ
(3)
)tan()tan(
θ
ϕ
ξ
θ
2222
−
=
−
Ψ
,
(4)
where
()
() ()
[]
[]
⎪
⎩
⎪
⎨
⎧
+
−+−
=
111321
0012222
222
for
for
q
/)(
sincos
ξ
θϕξθϕ
ϕ
(5)
)(
1211
3
0
1
1
4
1
pp
n
dT
dL
L
Q −⋅
−
+
⎟
⎠
⎞
⎜
⎝
⎛
=
ν
ν
(6)
1211
44
2
pp
p
−
=
ξ
.
(7)
Parameter of optical anisotropy ξ shows the difference of the cubic crystal from glass (for all
glasses ξ=1). It can be seen from (3-7) that expressions for δ
1
and Ψ for the [111] crystal
orientation can be obtained from the corresponding expressions for the [001] orientation by
making a formal substitution:
ξ → 1, Q → Q(1+2ξ)/3 (for the transition [001] → [111]). (8)
Further we shall give all results only for the [001] orientation, having in mind that the
corresponding formulas for the [111] orientation can be obtained by substituting (8).
Arbitrary crystal orientation is analyzed in (Khazanov et al., 2002a).
For the Gaussian beam with radius r
0
and power P
0
one may substitute the solution of the
heat conduction equation
r
rrP
dr
dT
)/exp(
2
0
2
0
1
2
−−
⋅−=
πκ
α
(9)
Faraday Isolators for High Average Power Lasers
49
into (3):
(
)
)(sin)(cos
exp
),(
θϕξθϕϕδ
2222
1
222
−+−
−−+
=
u
uu
pu
l
,
(10)
where
0
0
P
Q
L
p
κ
α
λ
=
,
(11)
u=r
2
/r
0
2
, α
о
and κ are absorption and thermal conductivity. Dimensionless parameter p
physically means normalized laser power. Assuming for a TGG crystal L/λ=20000,
α
0
=1.5⋅10
−
3
cm
−
1
, Q=17⋅10
−
7
K
−
1
, and κ=5W/Km we obtain p=1 when P
0
=1kW.
Formula for δ
с
follows from the Faraday effect, taking into account the temperature
dependence of the Verdet constant and thermal expansion:
()
⎥
⎥
⎦
⎤
⎢
⎢
⎣
⎡
⎟
⎟
⎠
⎞
⎜
⎜
⎝
⎛
−
⎟
⎠
⎞
⎜
⎝
⎛
++=
*
)()( rTrT
dT
dV
V
r
Tcoc
αδδ
1
1
,
(12)
where δ
со
is a doubled angle of polarization rotation at r=r* ; and r* can be chosen such as to
minimize depolarization, see below. Thus, Jones matrix of MOE is determined by (1) with
(4, 10, 12).
2.2 Polarization distortions (depolarization)
Let us calculate the depolarization ratio of the beam after the second pass through the FI
(Fig.
1). In the absence of thermal effects, the beam at a point C
−
is vertically polarized and is
reflected by polarizer 1. Because of the thermal effects there occurs depolarized radiation,
which, being horizontally polarized at a point С
−
, passes through polarizer 1. The local
depolarization ratio Γ(r,φ) is
()
2
2
0 C
Er /, xE
C
=Γ
ϕ
,
(13)
where
E
С
is the complex amplitude of the field at point С
−
. Of major interest is the integral
depolarization γ (the isolation degree of the FI is 1/γ) that is a fraction of horizontally
polarized radiation power at point С
−
:
∫∫∫∫∫∫
∞
∞
∞
⎟
⎟
⎠
⎞
⎜
⎜
⎝
⎛
−
Γ==
π
π
π
ϕ
π
ϕϕγ
2
00
2
0
2
2
2
00
2
2
00
2
0
0
1
rdr
r
r
d
r
rdrEdrdrd
CC
expxE .
(14)
Here we assume that the FI aperture is such that aperture losses can be neglected, i.e. the
integration in (14) over a polar radius r can be extended to infinity; and the beam at a point
A
−
has Gaussian shape and horizontal polarization:
(
)
2
0
2
0
2rrconstA /exp)( −=
−
xE .
(15)
Knowing Jones matrices of all elements, the field at points С
−
can be easily found:
Advances in Solid-State Lasers: Development and Applications
50
E
(С
−
)
= L
2
(3π/8)F(δ
с
=π/2, δ
l
)E(А
−
), (16)
where L
2
( β
L
) is the matrix of a λ/2 plate with an angle of inclination of the optical axis β
L
:
⎟
⎠
⎞
⎜
⎝
⎛
−
=
LL
LL
L
β2cosβ2sin
β2sinβ2cos
)(β
2
L .
(17)
Substituting (1, 15, 17) into (16), and the result into (13, 14) yields Γ and γ. Let us consider
the case when the linear birefringence is small
δ
l
<<1 (18)
and changes of the polarization rotation angle are small too, i.e. (δ
c
(r)–δ
co
)<<δ
co
. In this case
from (13) accurate to within terms of order
4
l
δ
and )(
0
2
ccl
δδδ
− we obtain
2
2
2
2
424
2
2
⎟
⎠
⎞
⎜
⎝
⎛
−+
⎟
⎠
⎞
⎜
⎝
⎛
−Ψ=Γ
π
δ
π
π
δ
cl
sin
.
(19)
The substitution of (4, 10, 12) into (19), and the subsequent substitution of the result into (14)
yield
()() ()()
durTrTu
dT
dV
V
A
p
T
2
0
2
2
22
2
1
2
1
16
2
4
11 *expcos)( −−⋅
⎟
⎠
⎞
⎜
⎝
⎛
+
⎟
⎟
⎠
⎞
⎜
⎜
⎝
⎛
+
⎟
⎟
⎠
⎞
⎜
⎜
⎝
⎛
⎟
⎠
⎞
⎜
⎝
⎛
−−+=
∫
∞
α
π
θ
π
ξ
π
γ
,
(20)
where A
i
are given in Table 2. By rotating the MOE around z axis, i.e. by varying angle θ,
one can minimize the first term in (20). By differentiating (20) over r* and equating the
derivative to zero, we obtain for the optimal value r
opt
≈0.918r
0
. In practice, when choosing
the value of the magnetic field or length of the MOE, one should secure rotation of
polarization by an angle π/4 at point r=0.918r
0
, see (12). As a result of these two
optimizations we obtain
2
2
00
3
2
2
1
1
16
⎟
⎠
⎞
⎜
⎝
⎛
+
⎟
⎠
⎞
⎜
⎝
⎛
+=
T
dT
dV
V
P
Ap
A
α
κ
α
π
γ
min
.
(21)
Thus, depolarization (19, 20, 21) is an arithmetic sum of contributions of two effects: the
photoelastic effect (the first term) and temperature dependence of Verdet constant (the
second term). Note that both terms in (20, 21) are independent of the beam radius r
0
and are
proportional to the square of laser power Р
0
. Expression (21) allows us to compare the
impacts of these effects. Assuming L/λ≅20000 and taking into account data in Table 1 one
can show that the photoelastic effect is dominating. This fact found numerous experimental
evidences. The most illustrative one is the transverse distribution of Г(r, ϕ). If temperature
dependence of the Verdet constant is neglected, Г(r,ϕ) according to (4, 19) has the form of a
cross, and the axes of this cross (directions where Г=0) are rotated relative to the х, y axes by
an angle π/8. This completely conforms to the experimental data, see Fig. 3.
Faraday Isolators for High Average Power Lasers
51
m 1 2 8 ∞
010
σσ
/)( =mA
1 0.56 0.48 1/2
∫
∞
⋅=
0
2
3
0
1
1
)exp(
)(
)(
m
m
u
duuh
mA
σ
0.137 0.111 0.087 1/12
∫
∞
⋅=
0
4
5
0
2
1
)exp(
)(
)(
m
m
u
duuh
mA
σ
0.042 0.0265 0.0145 1/80
2
0
4
0
0
2
3
0
3
11
⎥
⎥
⎦
⎤
⎢
⎢
⎣
⎡
−⋅=
∫∫
∞∞
du
u
uf
du
u
uf
mA
m
m
m
m
)exp(
)(
)exp(
)(
)(
σσ
0.268 0.158 0.092 1/12
2
0
1
0
2
102
4
0
2
1
34
1
1
⎥
⎥
⎦
⎤
⎢
⎢
⎣
⎡
−
−
−=
∫
∞
du
u
u
uf
mAmA
m
m
)(
)exp(
)(
)()(
σ
σ
σσσσ
σ
0.0177 0.0021
10
−
5
0
()
()
2
0
3
02
15
1
⎟
⎟
⎟
⎠
⎞
⎜
⎜
⎜
⎝
⎛
−=
∫
∞
du
u
uuh
mAmA
m
m
exp
)(
)(
σσ
0.012 0.0017
10
−
5
0
∫
∞
=
0
2
2
0
2
6
du
uu
uw
m
mA
m
m
)exp(
)(
)(
σ
0.046 0.054 0.028 0
∫
∞
=
0
4
4
0
4
7
du
uu
uw
m
mA
m
m
)exp(
)(
)(
σ
0.0031 0.0076 0.0082 0
∫∫
=
uz
m
m
y
dy
dz
u
h
00
1
)exp(
z
dz
y
dy
f
uz
m
m
∫∫
⎟
⎟
⎟
⎠
⎞
⎜
⎜
⎜
⎝
⎛
=
00
)exp(
∫
=
u
m
m
m
z
dzz
w
0
)exp(
∫
∞
=
0
)exp(
)(
m
k
k
y
dyy
m
σ
Table 2. Values A
0-7
for different m. A
i
≡A
i
(m=1).
Fig. 3. Theoretical (a) and experimental (b) (Khazanov et al., 2000) intensity distributions of
depolarized beam.
In addition, experiments on depolarization compensation (see sections 3.2, 3.3) also
confirmed domination of the photoelastic effect. Further we shall assume that γ is given by
22
1
πγ
/pA=
.
(22)
a
b
Advances in Solid-State Lasers: Development and Applications
52
Thermal effects influence not only depolarization γ, but also power losses during the
forward pass γ
1
, i.e. losses caused by the reflection of depolarized radiation from polarizer 4
(Fig.1). Considering only the photoelastic effect, by analogy with γ an expression for γ
1
at
θ=θ
opt
may be found (Khazanov, 2000):
222
11
πξγ
/pA=
.
(23)
Deriving (23) we neglected average over cross-section decrease of V due to average heating
of MOE (Khazanov et al., 1999). An increase of the laser power from 0 to 400 W decreased
the angle of rotation by 2 degrees (Mukhin et al., 2009), which corresponded to a negligible
in practice value γ
1
≈0.1%. However, when FI is placed in vacuum, the average temperature
(and hence γ
1
) increases much higher (VIRGO-Collaboration, 2008). In this case good
thermal contact of MOE with magnets housing and/or thermal stabilization of the MOE by
the Peltier element should be implemented to keep γ
1
negligible.
2.3 Amplitude and phase distortions
The depolarization ratio γ and power losses during the first pass γ
1
are generally the main
but not the only parameters of the FI. The output radiation
E
out
has also spatial (amplitude
and phase) distortions. Depending on particular FI applications, the output beam may be a
beam at point D
+
, a beam at point D
−
, or both (Fig. 1). Below we shall assume the first, most
frequently used case. For quantitative description of the spatial distortions we shall use
⎟
⎟
⎟
⎠
⎞
⎜
⎜
⎜
⎝
⎛
⋅−=
∫∫∫∫∫∫
∞∞∞ 2π
00
2
ref
2π
00
2
out
2
*
refouts
rdrEdrdrEdrdrEEd
ϕϕϕγ
π
2
00
1 ,
(24)
i.e. the difference from unity of the overlapping integral of E
out
and the reference field E
ref
that is the field in the absence of thermal effects. To determine analytical expressions for γ
s
we shall apply the formalism of the Jones polarization matrices as above. In case of weak
polarization distortions (18) and weak phase distortions, i.e. kL(n(r)−n(0))<<1, we obtain
ias
γ
γ
γ
+
=
,
(25)
where
2
1
2
πγ
/Ap
a
=
4
3
2
/Ap
ii
=
γ
(26)
0
0
P
P
L
p
i
κ
α
λ
=
.
(27)
Values of all γ are summarized in Table 3. Let us discuss the results obtained. First of all, it is
important to note that γ
s
(as well as γ and γ
1
) does not depend on r
0
and is proportional to
the square of P
0
. Two physical effects contribute to γ
s
: isotropic thermal lens (γ
i
) and
anisotropic distortions (γ
a
) due to depolarization. The latter contribution is attributed to the
distortions non-uniformity over the cross-section resulting in appearance of amplitude and
phase distortions in the beam after propagation through the polarizer (e.g., Maltese cross,
astigmatism). Taking into account polarization losses at the first pass γ
1
, the total power loss
in spatial and polarization mode after the first pass through the FI is γ
total
=γ
1
+γ
a
+γ
i
.
Faraday Isolators for High Average Power Lasers
53
Traditional FI
Fig. 1
FI with λ/2
Fig. 9a
FI with 67.5
0
rotator
Fig. 9b
depolarization ratio γ
(isolation degree is 1/γ)
2
1
2
π
/Ap
(
)
222
4
2
4
8
ab
A
p −
ξ
π
ξ>1.3
⎟
⎠
⎞
⎜
⎝
⎛
++
42
4
2
2
4
3
2
1
6
ξξ
π
Aa
p
polarization
losses γ
1
22
1
2
πξ
/Ap
(
)
1
2
2
2
2
1
2
+
⎟
⎠
⎞
⎜
⎝
⎛
−
ξ
π
π
Ap
ξ>1.3
(
)
2
1
2
22
π
/−Ap
anisotropic
losses γ
а
2
1
2
π
/Ap
)(
4
0 p
(
)
22
1
2
22
πξ
/−Ap
no
thermal lens
compensation
isotropic
losses γ
i
4
3
2
/Ap
i
4
3
2
/Ap
i
4
3
2
/Ap
i
γ
1TC
γ
1
γ
1
γ
1
γ
аTC
γ
a
γ
a
γ
a
telescope
compensation
γ
iTC
4
4
2
/Ap
i
4
4
2
/Ap
i
4
4
2
/Ap
i
γ
1AC
8
2
11
/
CG
pA+
γ
8
2
11
/
CG
pA+
γ
8
2
11
/
CG
pA+
γ
γ
аAC
CGCG
pp
A
p
A
8
8
1
2
1
1
π
ξ
γ
++
adaptive
compensation
γ
iAC
0 0 0
Table 3. Depolarization and power losses after the first pass through FI.
Note that the parameter p
i
(27) is analogous to the parameter p (11) accurate within
replacement of thermo-optical constants: Q (6) characterizing anisotropic distortions by P (2)
characterizing isotropic distortions. Isotropic losses γ
i
are determined only by parameter p
i
,
while p determines isolation degree 1/γ as well as losses γ
a
and γ
i
induced by anisotropy of
the photoelastic effect.
Since the temperature distribution is not parabolic the thermal lens is aberrational. Such a
lens can be represented as a sum of a parabolic lens with focus F and an aberrator that does
not introduce any geometrical divergence. Using the method of moments an expression for
F can be obtained (Poteomkin & Khazanov, 2005):
2
0
0
2
kr
p
A
F
i
= ,
(28)
where A
0
is given in Table 2.
2.4 The influence of beam shape
Above we have discussed thermal distortions of a Gaussian beam. Since a laser beam
induces (being a heat source) and simultaneously reads distortions, the value of self-action
may depend significantly on the transverse distribution of the intensity. The results
obtained can be generalized for an arbitrary axially symmetric beam (Khazanov et al.,
2002b), including a super-Gaussian beam with power P
0
and intensity
()
1
0
2
0
2
0
2
0
−
∞
⎟
⎟
⎟
⎠
⎞
⎜
⎜
⎜
⎝
⎛
−⋅
⎟
⎟
⎠
⎞
⎜
⎜
⎝
⎛
−=
∫
dyyr
r
r
PrI
m
m
m
)exp(exp
π
.
(29)
Advances in Solid-State Lasers: Development and Applications
54
At m=1 the beam is Gaussian, and at m=∞ the beam turns into a flat-top one. Repeating the
procedure described in sections 2.2, 2.3 for the laser beam (29) instead of (15), one can show
that expressions for the depolarization ratio γ (19-22), for losses in polarization γ
1
(23), and
spatial γ
s
(25-26) mode during the first pass, and for F (28) are valid at any m, if A
i
are
replaced by А
i
(m), expressions for which are given in Table 2. All equations below are for a
Gaussian beam, but they are valid for a super-Gaussian beam after this replacement.
Note that with increasing m the value of A
1,3
(m)
decreases. This means that a flat-top beam
is optimal for decreasing the influence of all thermal effects, whereas a Gaussian beam has
the strongest self-action.
2.5 Selection of magneto-optical medium
In high-power lasers, magneto-optical materials are chosen taking into account specific
features of different nonlinear effects. As a result, figures of merit were introduced: the
larger the figure of merit, the better the medium. From the point of view of power losses due
to absorption, such a figure of merit is the V/α
0
ratio (Robinson, 1964). From the point of
view of self-focusing in pulse lasers, this is parameter VW
cr
(Zarubina et al., 1997) for
thermal self-focusing and VP
cr
(Malshakov et al., 1997) for electronic Kerr self-focusing.
As has been shown in sections 2.2 and 2.3, all thermal effects are determined by p
i
and p.
Taking into account that L
∼
1/V we obtain figures of merit μ
i
and μ:
P
V
i
0
α
κ
μ
=
,
Q
V
0
α
κ
μ
=
.
(30)
According to (22, 8) the [001] orientation is better than [111]. In (Khazanov et al., 2002b) it
was shown that [001] is the best orientation.
The absorption coefficient α
0
at 1064nm wavelength in TGG can vary by several times from
sample to sample, see Table 1, where values of V and κ are also included. The most likely
value of κ lies in the range 4-5W/Km. Direct measurements of ξ, P and Q were not done
because of difficulty in measuring the photoelastic coefficients p
ij
. The results of
measurements by means of techniques based on thermal effects are shown in Table 1.
As can be seen from expressions (30), and from Table 1, the TGG crystal has a considerable
advantage over all glasses due to its high thermal conductivity. At the same time both Q and
P can be effectively controlled in glasses by changing their content. For instance, among
laser glasses there is a quartz neodymium glass having Q=0.2⋅10
−
7
K
−
1
(Demskaya &
Prokhorova, 1983). If a magneto-optical glass with such a Q were created, its figure of merit
μ would be better than in TGG.
Two other terbium garnets have V 35% higher than TGG: TAG (Ganschow et al., 1999;
Rubinstein et al., 1964; Geho et al., 2005) and TSAG (Yoshikawa et al., 2002). Verdet
constants of LiTb(MoO
4
)
2
(Guo et al., 2009) and NaTb(WO
4
)
2
(Liu et al., 2008) are even
higher. However, the figures of merit μ
i
and μ of all these crystals are unknown up to now.
Besides, their diameters are a few mm only.
The greatest disadvantage of TGG is also a relatively small aperture (<30mm), whereas
glasses can have a diameter as large as 300 mm. In (Khazanov, 2003; Khazanov, 2004) we
proposed to use TGG polycrystalline ceramics in FIs. The first samples of TGG ceramics
were made by Dr. A.Ikesue (Japan) in 2003, see Fig. 4, and the first experimental study was
done in (Yasuhara et al., 2007). Also, ceramics may be made of other garnets and oxides:
Faraday Isolators for High Average Power Lasers
55
TAG or TSAG (high V and κ) and highly (up to 20%) Nd-doped YAG, Y
2
O
5
, Sc
2
O
5
, Lu
2
O
5
(low α
0
and high κ). We forecast that the use of FIs in lasers with high average power will
expand considerably within the next few years due to the emergence of ceramics. In (Kagan
& Khazanov, 2004) we studied specificity of thermal effects in magneto-optical ceramics and
showed that figures of merit for ceramics are the same as for a single crystal with [111]-
orientation.
Fig. 4. A photograph of the first TGG ceramics samples made by A.Ikesue (Japan) in 2003.
3. Compensation of thermal effects in Faraday Isolators
3.1 Compensation of thermal lens in Faraday Isolators
The temperature distribution in the MOE and, consequently, the distribution of phase of an
aberrated laser beam are almost parabolic. Therefore, a great portion of the phase distortions
can be compensated by means of an ordinary lens or a telescope (Khazanov, 2000) shown by
a dashed line in Fig. 5. Hereinafter we shall call this method “telescopic compensation” and
indicate corresponding losses by subscript “TC”.
In (Mansell et al., 2001; Mueller et al., 2002) an adaptive method (subscript “AC”) for
compensating the thermal lens was suggested and experimentally studied. A compensating
glass was placed before polarizer 1 (dotted line in Fig. 5). Parameters of the compensating
glass were chosen so that the thermal lens had the same focus as in FI but opposite (typically
negative) sign. In (Mueller et al., 2002) it was shown numerically that the influence of
diffraction can be insignificant. In this case the isotropic losses were totally compensated:
γ
iAC
=0.
Fig. 5. Power losses during first propagation through FI. 1,4 – polarizers; 2 – λ/2 plate; 3 –
MOE, 5 – compensating glass, 6 – compensating lens or telescope.
The adaptive approach has two certain advantages over the telescopic one: there is no need
in adjustment when laser power is changed, and the accuracy of compensation is higher.
However, a considerable disadvantage of the adaptive method is that the photoelastic effect
1
2
3
4
В
losses to higher spatial modes γ
s
=γ
i
+γ
a
E
in
isotropic thermal lens γ
i
(dn/dT + photoelastic effect)
E=const
⋅
E
in
|const|
2
=
1
−
γ
s
anisotropic distortion γ
a
(photoelastic effect)
depolarization in
compensating glass
depolarization
in MOE
+
γ
1
=
5
6