Frontiers in Guided Wave Optics and Optoelectronics Part 2 docx
Bạn đang xem bản rút gọn của tài liệu. Xem và tải ngay bản đầy đủ của tài liệu tại đây (2.61 MB, 40 trang )
Application Specific Optical Fibers
25
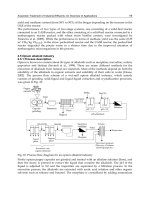
Fig. 21. a) Optical micrograph of the cross section of a solid core Bragg fiber fabricated
through MCVD technology; b) Nonlinear spectral broadening in 3 cm of this Bragg fiber
showing the input spectrum and for 19 kW, 59 kW, and 82 kW of launched peak powers
from an optical parametric amplifier (OPA). OPA was tuned to 1067 nm and FWHM of the
launched pulse was 120 fs (After Bookey et al, 2009; ©2009 OSA).
6. Conclusion
In this chapter we have attempted to provide a unified summary description of the most
important propagation characteristics of an optical fiber followed by discussion on several
variety of special fibers for realizing fiber amplifiers, dispersion compensating fibers,
microstructured optical fibers, and so on. Even though huge progress has been made on
development of optical fibers for telecom application, a need for developing special fibers,
not necessarily for telecom alone, has arisen. This chapter was an effort to describe some of
these special fibers. Detailed discussions are given on our own work related to inherently
gain-flattened EDFA, DCFs of large mode effective area, index-guided MOF and Bragg
fibers for realizing dispersion compensation, for metro network centric applications, and for
generating super continuum light.
7. Acknowledgement
The author acknowledges many interesting discussions and exchange of ideas in the course
of gathering cumulative knowledge in this field with his colleagues Ajoy Ghatak, M. R.
Shenoy, K. Thyagarajan, and Ravi Varshney. He is also grateful to his graduate students
namely, Sonali Dasgupta, B. Nagaraju, and Kamna Pande, for many fruitful discussions
during their thesis work, which led to several publications with them on specialty fibers,
which are referred to in this chapter. Manu Mehta carried out and executed many of the
design calculations as part of her M.Tech. Dissertation at our Institute on application specific
index guided holey fiber structures, which were based on use of the CUDOS software, made
available to us by B. Eggleton and Boris Kuhlmey from University of Sydney. This work
was partially supported by our ongoing Indo-UK collaboration project on Application
Specific Microstructured Optical Fibers under the UKIERI scheme sponsored by the UK
Government and the Indo-French Network collaboration project on Specialty Optical Fibers
and Amplifiers sponsored by DST (Govt. of India) and French Ministry of Research.
Frontiers in Guided Wave Optics and Optoelectronics
26
8. References
Agrawal, G. P. (2007), Nonlinear Fiber Optics, Fourth edition, Academic Press, San Diego.
Agrawal, G. P. (2006a), Fiber optic Raman amplifiers in Guided Wave Optical Components and
Devices: basics, Technology, and Applications, B. P. Pal (Ed.), pp. 1-25, Elsevier
Academic Press, Burlington & San Diego.
Argyros, A., Eijkelenborg, M. V., Large, M. and Basset, I. (2006), Hollow core microstructure
polymer optical fiber, Opt. Lett., Vol. 31, pp. 172-174.
Auguste, J. L., Jindal, R., Blondy, J. M., Clapeau, M., Marcou, J., Dussardier, B., Monnom, G.,
Ostrowsky, D. B., Pal, B. P. and Thyagarajan K. (2000), -1800 ps/(nm.km) chromatic
dispersion at 1.55 μm in a dual-core fiber, Electron. Lett. Vol. 36, pp. 1689-1691.
Birks, T. A., Knight, J. C., and Russel, P. St. J. (1997), Endlessly single-mode photonic crystal
fiber, Opt. Lett., Vol. 22, pp. 961-963.
Birks, T. A., Wadsworth W. A., and Russel, P. St. J. (2000) Supercontinuum generation in
tapered fibers, Opt. Lett. Vol. 25, pp. 1415-1417.
Bookey H. T., Dasgupta, S., Bezawada, N., Pal, B. P., Sysoliatin, A., McCarthy, J. E.,
Salganskii, M., Khopin, V., and Kar, A. K. (2009), Experimental demonstration of
spectral broadening in an all-silica Bragg fiber, Opt. Exp. Vol. 17, pp. 17130-17135.
Brechet, F., Roy, P., Marcou, J. and Pagnoux, D. (2000), Single-mode propagation in to
depressed-core-index photonic bandgap fiber designed for zero-dispersion
propagation at short wavelength, Electron. Lett., Vol. 36, pp. 514-515.
Bromage, J. (2004), Raman amplification for fiber communication systems, IEEE J. lightwave
Tech., Vol. 22, pp. 79-93.
Cox, F.M., Argyros, A. and Large, M .C. J. (2006), Liquid-filled hollow core microstructured
polymer optical fiber, Opt. Exp., Vol. 14, pp. 4135-4140.
Dasgupta, S., Pal, B. P. and Shenoy, M. R. (2005), Design of dispersion compensating Bragg
fiber with ultrahigh figure of merit, Opt. Lett., Vol. 30, pp. 1917-1919.
Dasgupta, S. (2006), Personal Communication.
Dasgupta, S., Pal, B. P. and Shenoy, M. R. (2006), Photonic bandgap guided Bragg fibers in
Guided Wave Optical Components and Devices: basics, Technology, and Applications, B. P.
Pal (Ed.), pp. 1-25, Elsevier Academic Press, Burlington & San Diego.
Dasgupta, S., Pal, B. P. and Shenoy, M. R. (2007), Nonlinear spectral broadening in solid core
Bragg fibers, IEEE J. Lightwave Tech., Vol. 25, pp. 2475-2481.
Doran, N. J. and Blow, K. J. (1983), Cylindrical Bragg fibers: a design and feasibility study
for optical communications, IEEE J. Lightwave Tech., Vol. LT-1, pp. 588-590.
Ebendorff-Heidepriem, H., Petropoulos, P., Asimakis, S., Finazzi, V., Moore, R. C.,
Frampton, K., Koizumi, F., Richardson, D. J. and Monro, T. M. (2004), Bismuth glass
holey fibers with high nonlinearity, Opt. Exp., Vol. 12, pp. 5082-5087.
Ghatak, A. and Thyagarajan, K. (1998), Introduction to Fiber Optics, Cambridge University
Press, Cambridge.
John, S. (1987), Strong localization of photons in certain disordered dielectric superlattices,
Phys. Rev. Letts., Vol. 58, pp. 2486-2489.
Johnson, S. G., Ibanescu, M., Skorobogatiy, Weisberg, O., Engeness, T. D., Solgacic, M.,
Jacobs, S. A. and Joannopoulos, J. D. (2001), Low loss asymptotically single-mode
propagation in large core omniguide fibers, Opt. Exp., Vol. 9, pp. 748-779.
Kartapoulos, S. K. (2000),
Introduction to DWDM Technologies, SPIE Press, Bellingham,
Washington & IEEE Press, Piscataway, NJ.
Kashyap, R. (1999), Fiber Bragg Gratings, Academic Press, San Diego.
Application Specific Optical Fibers
27
Katagiri, T., Matsuura, Y. and Miyagi, M. (2004), Photonic bandgap fiber with a silica core
and multiplayer dielectric cladding, Opt. Lett., Vol. 29, pp. 557-559.
Kim, H. S., Yun, S. H., Kim, H. K., Park, N., and Kim, B. Y. (1998), Actively gain-flattened
erbium-doped fiber amplifier over 35 nm by using all-fiber acousto-optic tunable
filters, IEEE Photon. Tech. Lett., Vol. 10, pp. 790-792
Knight, J. C., Birks, T. A., Russel, P. St. J., and Atkin, D. M. (1996), All-silica single-mode
optical fiber with photonic crystal cladding, Opt. Lett., Vol. 21, pp. 1547- 1549.
Kuhlmey, B. T., White, T. P., Renversez, G., Maystre, D., Botten, L. C., de Sterke, C. M., and
McPhedran, R. C., 2002, Multipole method for microstructured optical fibers,.II.
Formulation, J. Opt. Soc. Am. B, Vol.19, pp. 2331-2340.
Kumar, N., Shenoy, M.R., Pal, B.P. (2005), A standard fiber-based loop mirror as a gain-
flattening filter for erbium-doped fiber amplifiers, IEEE Photon. Tech. Lett., Vol. 17,
pp. 2056-2058.
Li, S., Chiang, K. S., Gambling, W. A. (2001), Gain flattening of an erbium-dped fiber
amplifier using a high-birefringence loop mirror, IEEE Photon. Technol. Lett., Vol. 13,
pp. 942-944.
Li, T. (1995), The impact of optical amplifiers on long-distance lightwave communications,
Proc. IEEE, Vol. 81, pp. 1568-1579.
Mehta, M. (2009), M.Tech. (Optoelectronics and Optical Communication) dissertation Studies
on Microstructured Optical Fibers, IIT Delhi.
Mears, R.J., Reekie, L., Poole, S. B. and Payne, D. N. (1986), Low-threshold tunable cw and
Q-switched fiber laser operating at 1.55 μm, Electron. Lett., Vol. 22, pp. 159-160.
Mears, R. J., Reekie, L., Jauncy, I. M. and Payne, D. N., (1987), Low-noise fiber amplifier
operating at 1.54 μm, Electron. Lett., Vol. 23, pp. 1026-1027.
Miya, T., Terunume, Y., Hosaka, T. and Miyashita, T. (1979), An ultimate low-loss single-
mode fiber at 1.55 μm, Electron. Lett., Vol. 5, pp. 106-108.
Monro, T. M. (2006), Microstructured Optical fibers in Guided Wave Optical Components and
Devices: basics, Technology, and Applications], B. P. Pal (Ed.), pp. 1-25 Elsevier
Academic Press, Burlington & San Diego.
Nagaraju, B., Paul, M. C., Pal, M., Pal, A., Varsheny, R. K., Pal, B. P., Bhadra, S. K., Monnom,
G. and Bernard, D. (2009), Design and fabrication of an intrinsically gain flattened
Erbium doped fiber amplifier, Opt. Comm., Vol. 282, pp. 2335-2338.
Okuno, T., Onishi, M., Kashiwada, T., Ishikawa, S. and Nishimura, M. (1999), Silica-based
functional fibers with enhanced nonlinearity and confinement loss trade-offs, IEEE
J. Select. Top. Quantum Electron., Vol. 5, pp. 1385-1391.
Pal, B. P. (1995), Optical transmission in Perspective in Optoelectronics, S. S. Jha (Ed.), pp. 195-
297, World Scientific, Singapore.
Pal, B. P. (2006), Optical fibers for broadband lightwave communication: evolutionary
trends in designs in Guided Wave Optical Components and Devices: basics, Technology,
and Applications, B. P. Pal (Ed.), pp. 1-25, Elsevier Academic Press, Burlington & San
Diego.
Pal, B. P. and Pande, K. (2002), Optimization of a dual-core dispersion slope compensating
fiber for DWDM transmission in the 1480-1610 nm band through G.652 single-
mode fibers, Opt. Comm., Vol. 201, pp. 335-344.
Pal, B. P., Dasgupta, S. and Shenoy, M. R. (2005), Bragg fiber designs for transparent metro
networks, Opt. Exp., Vol. 13, pp. 621-626.
Pal, B.P., Dasgupta, S. and Shenoy, M. R. (2006), Supercontinuum generation in a Bragg
fiber: a novel proposal, Optoelectron. Letts., Vol. 5, pp. 342-344.
Frontiers in Guided Wave Optics and Optoelectronics
28
Pan, J.Y., Ali, M. A., Elrefaie, A. F., and Wagner, R. E. (1995), Multi-wavelength fiber
amplifier cascades with equalization employing Mach-Zehnder optical filter, IEEE
Photon. Technol. Lett., Vol. 7, pp. 1501-1503.
Pande, K. and Pal, B. P. (2003), Design optimization of a dual-core dispersion compensating
fiber with high figure of merit and a large mode effective area for dense
wavelength division multiplexed transmission through standard G.655 fibers, App.
Opt., Vol. 42, pp. 3785-3791.
Payne, D. N. and Gambling, W. A. (1975), Zero material dispersion in optical fibers, Electron.
Lett., Vol. 11, pp. 176-178.
Pone, P., Dubois, C., Guo, N., Gao, Y., Dupuis, A., Boismenu, F., Lacroix, S. and
Skorobogatiy, M. (2006), Drawing of the hollow all-polymer Bragg fibers, Opt. Exp.,
Vol. 14, pp. 5838-5852.
Ramachandran, S. (Ed.) (2007), Fiber-based Dispersion Compensation, Springer-Verlag, Berlin.
Ramachandran, S. (2006), Dispersion-tailored higher order mode fibers for in-fiber photonic
devices in Guided Wave Optical Components and Devices: Basics, Technology, and
Applications], B. P. Pal (Ed.), pp. 291-310, Elsevier Academic Press, Burlington & San
Diego.
Ryan, J. (2002), Fiber considerations for metropolitan networks, Alcatel Telecom. Rev., Vol. 1,
pp. 52-56.
Skorobogatiy, M. (2005), Efficient ant-guiding of TE and TM polarizations in low index core
waveguides without the need of omnidirectional refelector, Opt. Lett., Vol. 30, pp.
2991-2993.
Sun, Y, Sulhoff, J. W., Srivastava, A., Zysking, J. L., Srasser, T. A., Pedrazzani, J. R., Wolf, C.,
Zhou, J., Judkins, J. B., Espindola, R. P., and Vengsarkar, A. M. (1997), 80 nm ultra
wideband erbium doped silica fiber amplifier, Electron. Lett., Vol. 33, pp. 1965-1967.
Srivastava, A. and Sun, Y. (2006), Erbium-doped fiber amplifiers for dynamic optical
networks in Guided Wave Optical Components and Devices: Basics, Technology, and
Applications], B. P. Pal (Ed.), pp. 181-204, Elsevier Academic Press, Burlington & San
Diego.
Thyagarajan, K., Diggavi, S., Taneja, A. and Ghatak, A. K. (1991), A simple numerical
technique for the analysis of cylindrically symmetric refractive index profile optical
fiber, Appl. Opt., Vol. 30, pp. 3877-3879.
Thyagarajan, K. and Pal, B. P. (2007), Modeling dispersion in optical fibers: applications to
dispersion tailoring and dispersion compensation in Optical Fiber Communication
Reports, Ramachandran, S. (Ed.), Vol. 4, pp. 173–213, Springer-Verlag, Berlin.
Urquhart, W. P. and Laybourn, P. J. (1985), Effective core area for stimulated Raman
scattering in single-mode optical fibers, Proc. Inst. Elect. Eng., Vol. 132, pp. 201–204.
Xu, Y., Yariv, A., Fleming, J. G. and Lin S. Y. (2003), Asymptotic analysis of silicon based
Bragg fibers, Opt. Exp., Vol. 11, pp. 1039-1049.
Varshney, R. K., Nagaraju, B., Singh, A., Pal, B. P., and Kar, A. K. (2007), Design and
Realization of an All-Fiber Broadband Tunable Gain Equalization Filter for DWDM
Signals, Opt. Exp., Vol. 15, pp. 13519-13530.
Vengsarkar, A. M., Lemaire, P.J., Judkins, J. B., Bhatia, V., Erdogan, T., Sipe, J. E. (1996),
Long period fiber gratings as band rejection filters,
IEEE J. Lightwave Tech., Vol. 14,
pp. 58-65.
Yablonovitch, E. (1987), Inhibited spontaneous emission in solid-state physics and
electronics, Phys. Rev. Letts., Vol. 58, pp. 2059-2062.
Yeh, P., Yariv, A. and Marom, E. (1978), Theory of Bragg fiber, J. Opt. Soc. Am., Vol. 68, pp.
1196-1201.
2
Nonlinear Properties
of Chalcogenide Glass Fibers
Jas S. Sanghera, L. Brandon Shaw,
C. M. Florea, P. Pureza, V. Q. Nguyen,
F. Kung, Dan Gibson and I. D. Aggarwal
Naval Research Laboratory
USA
1. Introduction
Chalcogenide glasses are based on the chalcogen elements S, Se and Te with the addition of
other elements such as Ge, As and Sb to form of stable glasses (Borisova, 1981). Due to their
large IR transparency, fibers fabricated from these glasses are ideal for transmission of high
power IR light. Several applications of chalcogenide fibers for IR transmission have been
documented (Sanghera et al., 2005a). Also of interest is the high nonlinearity of these glass
compositions. The high χ
(3)
nonlinearities of chalcogenide glasses make them excellent
candidates for applications such as all optical processing, Raman amplification, parametric
amplifiers and supercontinuum generation.
2. Glass preparation
Chalcogenide glasses are melted directly in quartz ampoules using chemicals purified via
distillation/sublimation (Sanghera et al., 1994a). Typical melt temperatures range from
600
o
C to 900
o
C, depending upon composition. The liquids are quenched and the glass rods
annealed at temperatures around the appropriate softening temperatures. The optical fibers
are obtained by the double crucible (DC) process (Sanghera et al., 1995). The DC process
enables adjustments to be made in the core/clad diameter ratio during fiber drawing by
independent pressure control above each melt. Therefore both multimode and single mode
fibers can be drawn with relatively few processing steps.
3. Fiber properties
Figure 1 compares the losses routinely obtained for a couple of chalcogenide glasses along
with the lowest (“champion”) losses reported in the literature (Sanghera et al., 1994b;
Churbanov, 1992). Depending upon composition, the sulfide, selenide and telluride based
fibers transmit between about 0.8-7 μm, 1-10 μm, and 2-12 μm, respectively. Therefore, the
practical applications dictate the type of fiber to be used. As-S fibers loss routinely achieved
is about 0.1-0.2 dB/m in fiber lengths of about 500 meters. Losses for As-Se fibers typically
range from 0.5 to 1 dB/m in the near IR around 1.5 µm.
Frontiers in Guided Wave Optics and Optoelectronics
30
Wavelength (µm)
0123456789101112
Loss (dB/km)
10
1
10
2
10
3
10
4
(a)
(b)
(c)
(d)
Fig. 1. Transmission loss spectra of (a) lowest loss sulfide fiber, (b) typical sulfide fiber, (c)
lowest loss telluride fiber, and (d) typical telluride fiber.
4. Nonlinear properties
It is well established that the values of χ
(3
)
for chalcogenide glasses are about two orders of
magnitude larger than silica (Nasu et al, 1989; Richardson et al, 1998). More recently, glasses
have been reported with non-linearities approaching 1000 times silica (Lenz et al., 2000;
Harbold et al., 2002). These large nonlinearities would allow small compact low power
devices for telecommunications. The subpicosecond response of these nonlinearities is ideal
for high data rate telecommunication devices.
For efficient nonlinear devices utilizing the optical Kerr effect, the nonlinearity must be high
and the nonlinear absorption must be low. A figure of merit FOM = n
2
/(βλ) can be defined
as a useful metric to determine optimum compositions, where n
2
is the nonlinear index and
β is the nonlinear absorption. For isotropic medium, one and two photon resonant processes
dominate the third-order susceptibility. For frequencies approximately half of the material
resonance, two photon processes resonantly enhance the nonlinear index n
2
. Normally,
however, the two photon resonance enhancement is accompanied by two photon absorption
which competes with the nonlinear index n
2
. In the case of amorphous materials such as
chalcogenide glass, an exponential Urbach tail exists and its absorption edge extends below
the half gap. This edge leads to two photon absorption (TPA) below the half gap and thus n
2
may increase faster than TPA absorption in this region. Consequently, the best performance
in terms of nonlinear index strength vs. TPA (FOM) will occur just below the gap. Figure 2
shows the bandgap of the As-S-Se system vs. Se concentration.
Here, the bandgap is defined at the point of 10
3
cm
-1
absorption. In the graph, Se content of 0
at. % corresponds to pure As
40
S
60
while Se content of 60 at. % corresponds to pure As
40
Se
60
.
The bandgap of the glass system decreases with Se content. For operation at 1.55 µm (0.8
eV), we would expect an optimum composition of As
40
Se
60
where E
g
/hν ~ 0.45. This is borne
out by experimental data.
Spectrally resolved two beam coupling measurements of As-S-Se system have been
performed to determine the magnitude of the nonlinear index n
2
and the two photon
Nonlinear Properties of Chalcogenide Glass Fibers
31
Se content (at%)
0 10203040506070
Band Gap (eV)
1.7
1.8
1.9
2.0
2.1
2.2
2.3
2.4
Fig. 2. Bandgap of As-S-Se glass system (defined at the point of 10
3
cm
-1
absorption).
absorption coefficient. Details of these measurements can be found in (Harbold et al., 2002).
Figure 3 shows the results of these measurements. Values for As-S were found to be ~220
times higher than for silica at 1.55 µm and increased with Se substitution of S to a value of
~930 times higher than silica for As-Se. Likewise, two photon absorption also increases with
increasing Se content. This data can be used to calculate the FOM for the As-Se system
(Figure 4). As expected, the glasses with the largest FOM for operation at 1550 nm occurs for
E
g
/hν at ~0.45 which is the As-Se composition (Slusher et al., 2004).
Normalized Photon Energy (hυ/E
gap
)
0.30 0.35 0.40 0.45 0.50 0.55 0.60
n
2
/ (n
2
silica)
200
400
600
800
1000
1200
1400
TPA (cm/GW)
0
1
2
3
1550 nm
1250 nm
[Se]
Normalized Photon Energy (hυ/E
gap
)
0.30 0.35 0.40 0.45 0.50 0.55 0.60
n
2
/ (n
2
silica)
200
400
600
800
1000
1200
1400
TPA (cm/GW)
0
1
2
3
1550 nm
1250 nm
[Se]
Fig. 3. n
2
and TPA absorption of As-S-Se glass system.
High speed optical processing has been demonstrated by exploiting these high
nonlinearities in chalcogenide glass fiber and waveguides. Earlier work on all optical
switching in chalcogenide fiber was performed by Asboe (Asobe et. al. 1993) who
demonstrated switching of an 80-GHz pulse train in a 2 meter length of As
2
S
3
based fiber
using an optical kerr shutter configuration. More recently, 640 Gb/s demultiplexing has
been demonstrated in a 5 cm long chalcogenide rib waveguide on silicon by utilizing FWM
(Galili et. al. 2009). 40 Gb/s all optical wavelength conversion has also been demonstrated
in chalcogenide tapered fibers (Pelusi, et. al. 2008). Here, a CW laser at the conversion
wavelength was modulated by XPM with the co-propagating 40 Gb/s signal.
Frontiers in Guided Wave Optics and Optoelectronics
32
Normalized Photon Energy (hυ/Egap)
0.30 0.35 0.40 0.45 0.50 0.55 0.60
FOM
1
10
1550 nm
1250 nm
Normalized Photon Energy (hυ/Egap)
0.30 0.35 0.40 0.45 0.50 0.55 0.60
FOM
1
10
1550 nm
1250 nm
Fig. 4. FOM for As-S-Se glass system.
5. Raman amplification
Figure 5 shows the normalized Raman spectra of As
40
S
60
, As
40
Se
60
, and silica. As
40
Se
60
glass
has a much narrower Raman line (~60 cm
-1
) than silica glass (~250 cm
-1
). In addition, the
Raman shift for As
40
Se
60
glass is much smaller (~240 cm
-1
) than the Raman shift of silica
glass (~440 cm
-1
) due to the heavier atoms present in the chalcogenide glass. Previous
studies have looked at stimulated Raman scattering in As
40
S
60
glass, a very similar glass
system to As
40
Se
60
(Asobe et al., 1995). These studies found the Raman gain coefficient of
As
40
S
60
to be almost two orders of magnitude higher than that of silica. It was also found
that this enhancement in the Raman gain roughly corresponded to the enhancement in the
nonlinear index, n
2
. Consequently, one might expect to see an even larger Raman gain
coefficient in As
40
Se
60
since the selenide glass has shown an even larger nonlinearity and
also a narrower Raman spectrum.
0
0.2
0.4
0.6
0.8
1
1.2
0 100 200 300 400 500 600 700 800
Raman Shift (cm
-1
)
Raman Intensity (normalized)
Silica glass
Δν
~ 250 cm
-1
As-S
Δν
~85 cm
-1
As-Se
Δν
~60cm
-1
Fig. 5. Raman spectra of As
2
S
3
and As
2
Se
3
glass. Silica glass is shown for reference.
Nonlinear Properties of Chalcogenide Glass Fibers
33
Raman amplification at 1.55 µm has been demonstrated in small core As-Se fiber (Thielen et
al., 2003a). The results of the Raman amplification experiment are shown in shown in Figure
6. Over ~23 dB of gain was achieved in a 1.1-meter length of fiber pumped by a nanosecond
pulse of ~10.8 W peak power at 1.50 µm. The peak of the Raman gain was shifted by ~230
cm
-1
to 1.56 µm. The Raman gain coefficient was estimated to be ~300 times silica in this
experiment. More recent measurements of the Raman gain coefficient show a value of about
780x greater than that of silica (Slusher et al. 2004).
0
0.2
0.4
0.6
0.8
1
1.2
1.4
1.6
1470 1490 1510 1530 1550 1570 1590 1610 1630
Wavelength (nm)
Signal (V)
0
0.002
0.004
0.006
0.008
0.01
0.012
Signal (V)
~230 cm
-1
Signal with pump
Pump w/o signal
Signal only
Pump
Fig. 6. Raman amplification in As-Se fiber. Shown is amplifier output with signal and no
pump, pump and no signal (showing background stimulated Raman scattering (SRS)
resulting from pump), and amplified signal with pump.
The large Raman gain coefficient of chalcogenide glass coupled with its large IR
transparency show promise for lasers and amplifiers in the near and mid-IR. The potential
for Raman lasers and amplifiers can be assessed by defining a figure of merit (FOM). The
expression for single pass gain, G
A
, in a Raman fiber laser is given by [1]:
0
exp
Reff
A
eff
gPL
G
A
⎛⎞
=
⎜⎟
⎜⎟
⎝⎠
(1)
Where g
R
is the Raman gain coefficient, P
0
is the pump power, A
eff
is the fiber effective area
and L
eff
is the fiber effective length. The fiber effective length is given by
()
11
1
L
eff
Le
α
α
α
−⋅
=
−≈
(2)
Where
α
is the fiber loss. For long lengths, L
eff
is approx 1/
α
. From these equations, the gain
is proportional to exp (-g
R
/
α
) for long fiber lengths. Thus, the value g
R
/
α
can be used as a
rough FOM for Raman amplification. Table 1 compares the performance of an As-Se Raman
fiber laser or amplifier operating at 4 µm to a silica Raman fiber laser or amplifier operating
in the telecommunications band at 1.5 µm. Here, the Raman gain coefficient of As-Se, g
R
,
which is measured to be 780x silica at 1.5 µm is extrapolated to it value in the mid-IR since
Frontiers in Guided Wave Optics and Optoelectronics
34
the Raman gain coefficient scales inversely with wavelength. α is the fiber loss. For silica, a
loss of 0.2 to 0.3 dB/km is typical of telecommunication grade fiber. For As-Se, two losses
are given. The loss of 200 dB/km is typical of “champion losses” achieved at NRL for As-Se
fiber while the loss of 3 dB/km is theoretical loss for As-Se fiber (Devyatykh et al., 1992).
For the loss of 200 dB/km, g
R
/
α
for an As-Se fiber Raman amplifier operating at 4 µm is
about 0.38 compared to 1.1 for a silica fiber Raman amplifier. For the theoretical loss of 3
dB/km, g
R
/
α
for As-Se fiber operating at 4 µm is 23 times that of silica fiber operating at
1.5-µm.
237.5 x 10
-6
3
0.345 x 10
-4
200
1.7 x 10
-10
4As-Se Fiber
1.1~6 x 10
-7
0.2-0.30.65 x 10
-12
1.5Silica Fiber
FOM
( 10
-6
W
-1
)
α (cm
-1
)
Loss
(dB/km)
g
R
(cm/W)
λ
(µm)
237.5 x 10
-6
3
0.345 x 10
-4
200
1.7 x 10
-10
4As-Se Fiber
1.1~6 x 10
-7
0.2-0.30.65 x 10
-12
1.5Silica Fiber
FOM
( 10
-6
W
-1
)
α (cm
-1
)
Loss
(dB/km)
g
R
(cm/W)
λ
(µm)
Table 1. Figure of merit for Raman amplification in As-Se fiber at 4-µm compared Raman
amplification in silica fiber at 1.5-µm. The loss value of 200 dB/km (a) for As-Se is typical of
a “champion” loss value. The loss value of 3 dB/km (b) is theoretical loss.
A Raman laser has been demonstrated in As-Se fiber by Jackson (Jackson et. al. 2000). They
generated 0.64 W of first Stokes at 2062 nm with a slope efficiency of 66% under 2051 nm
pumping in a 1 meter length 6 µm core, 0.19 NA fiber. Reflection off the endface of the fiber
(~22% at normal incidence) was used for feedback at the output end of the fiber while a
broadband Au-coated mirror was used as a back reflector. Note that the braodband nature
of the cavity reflectors allowed the Raman laser to oscillate on a number of vibrations. The
line at 2062 nm was attributed to interlayer vibrations of As
2
Se
3
. Raman output at 2102 from
bond bending vibrations and at 2166 nm for bond stretching vibrations were also observed.
Stimulated Raman scattering (SRS) has been observed in the mid- IR. Figure 7 shows the
SRS in a ~ 1m length of As-Se fiber under CW CO laser pumping at ~ 5.4 µm. The SRS is
seen at ~ 6.1 µm. Raman laser operating in the wavelength range of from 6.1 to 6.4 µm
would have applications in laser surgery. These wavelengths correspond to amide bands in
0
0.05
0.1
0.15
0.2
0.25
0.3
0.35
0.4
0.45
5000 5200 5400 5600 5800 6000 6200 6400 6600 6800 7000
Wavelength (nm)
Signal (V)
0
0.001
0.002
0.003
0.004
0.005
0.006
0.007
0.008
0.009
0.01
Signal (V)
CO
Pump Laser
Raman Signal
Fig. 7. SRS signal observed at 6.1 µm under ~5.4 µm CO laser pumping.
Nonlinear Properties of Chalcogenide Glass Fibers
35
tissues and studies have shown that ablation of soft tissue is possible at these wavelengths
with minimal collateral damage, thus accelerating healing (Edwards et al. 1994). Modeling
of a Raman laser operating at 6.45 µm under CO laser pumping at 5.59 µm has shown high
slope efficiencies and moderate threshold power operation is possible (Thielen et al. 2003b).
6. Supercontinuum generation
Supercontinuum generation has been demonstrated between 2 to 3 µm in small core sulfide
and selenide fibers as well as photonic crystal selenide fibers (PCF) (Shaw et al., 2005). The 1
meter length of fibers were pumped with a Ti:sapphire pumped OPA laser at a wavelength
of 2.5 µm using 100 fs pulses and 100 pJ/pulse. The outputs from the fibers are shown in
figure 8. The sulfide and selenide fibers were 7 µm core diameter, while the PCF fiber had a
10 µm core diameter. In all cases, pumping was in the normal dispersion region of the fibers
and much of the broadening can be attributed to self phase modulation (SPM) with some
broadening to the red due to Raman (Hu et. al., 2008).
Fig. 8. Supercontinuum generation in small core chalcogenide fibers. The insert shows the
cross-sectional view of the selenide PCF fiber.
By using chalcogenide glass PCF, the dispersion of the fiber by can controlled and the zero
dispersion wavelength can be shifted to the near-IR making it feasible to pump in the
anomalous dispersion region of the fiber with conventional near-IR fiber laser pumps.
Modeling has shown that very broad supercontinuum bandwidths can be generated with
properly designed chalcogenide PCF fiber and proper pump (Hu et. al. 2009)
7. Poling of chalcogenide glass
Isotropic materials such as glasses lack a center of inversion symmetry and thus have no
second order nonlinear susceptibility (χ
(2)
) they should not exhibit second harmonic
generation (SHG) (Dianov et al., 1989). However, undoped and Pr-doped GaLaS glasses
have exhibited SHG (De Aruajo et al., 1996) through optical pumping. This SHG may be due
to crystallization or the effect of frozen-in electric fields. The latter arises from the
relationship χ
(2)
= E
dc
χ
(3)
, where E
dc
is the frozen-in electric field (Dianov et al., 1989). Electric
0.01
0.1
1
3600
3400
320030002800
2600240022002000
Wavelength (nm)
AsSe
AsS
Laser
Sulfide fiber
PCF
selenide
fiber
Selenide
fiber
Laser
Normalized Power
()
Frontiers in Guided Wave Optics and Optoelectronics
36
Fig. 9. (a) Modeled supercontinuum spectrum in As-S Photonic crystal fiber with Λ = 3 µm
under 2 µm, 500 fs, 1 kW peak power pumping. (b) The central wavelength of the soliton
with the largest power (dashed curve) and the ratio of the power generated between 3 µm
and 5 µm to the total input power as a function of the pitch at the end of the tapered PCF
(solid curve) (Hu, et. al. 2009)
poling has been successfully used to produce SHG in silica based fiber systems (Kazansky et
al., 1997). It is not unreasonable to expect similar results in chalcogenide fibers.
Since χ
(3)
is about 2 to 3 orders of magnitude larger in chalcogenides compared with silica,
we expect larger SHG efficiencies in electrically poled chalcogenide glasses. However, the
question arises as to whether the electric fields can be frozen-in for chalcogenide glasses.
Second harmonic generation has been observed at 780 nm using electrically poled arsenic
sulfide glass when pumping a 1 mm thick arsenic sulfide glass disk at 1560 nm as shown in
Figure 10. The sample was electrically poled at 100
o
C for 5 hours under nitrogen gas
atmosphere. At the present time the magnitude appears comparable to silica glass but the
mechanism is unknown.
0
0.02
0.04
0.06
0.08
0.1
0.12
0.14
0.16
0.18
765 770 775 780 785 790 795
Wavelength (nm)
Signal (V)
Pump laser : Mirage OPO
λ = 1.56 µm
pulsewidth = 5 ns
Rep Rate = 10 Hz
0
0.02
0.04
0.06
0.08
0.1
0.12
0.14
0.16
0.18
765 770 775 780 785 790 795
Wavelength (nm)
Signal (V)
Pump laser : Mirage OPO
λ = 1.56 µm
pulsewidth = 5 ns
Rep Rate = 10 Hz
Fig. 10. Second harmonic generation in poled As-S glass. Glass was pumped at 1.56 µm.
Shown is the 780 nm SHG signal.
Nonlinear Properties of Chalcogenide Glass Fibers
37
8. Brillouin scattering
In order to estimate the Brillouin gain coefficient, the threshold power of the stimulated
Brillouin scattering (SBS) process can be measured using the experimental setup detailed in
Fig. 11. The threshold power is easily determined by measuring the amount or monitoring
the spectrum of the reflected light using a high-resolution optical spectrum analyzer (OSA)
as sampled by the circulator. The fibers can be coated with liquid gallium on 10-cm lengths
on each end to eliminate the radiation leaking into the cladding. In the example provided,
the fiber ends were not anti-reflection coated and hence cavity effects were significant due to
the high refractive index of the fiber. The losses in the fiber and in the coupling optics are all
taken into account when estimating the amount of pump launched into the core. A 45%
coupling efficiency was estimated in the As
2
S
3
case, and 37% in the As
2
Se
3
case. These values
can be optimized and hence the SBS threshold power can be reduced, which is desired trend
from a system design perspective.
Fig. 11. Experimental setup used for SBS threshold measurements.
The spectral changes of the backward wave propagating through the chalcogenide fiber, as
sampled by the circulator, are shown in Fig. 12 for the As
2
S
3
fiber, and in Fig. 13 for the
As
2
Se
3
fiber, respectively. The cavity effects reduced the accuracy of the threshold
measurement as indicated in the captions. Nevertheless, the threshold is easily identified by
the significant jump in the peak of the Brillouin-shifted signal monitored on the OSA.
Additionally, clamping of the pump output power was observed, once the threshold was
reached, since most of the pump power wastransfered to the Stokes wave (Ruffin, 2004).
The numerical aperture (NA) of a fiber determines the mode-field diameter and hence the
effective area of the fundamental mode, with direct implications on the threshold power
estimation for the SBS process. It also determines the number of modes supported by the
fiber at a given wavelength, λ. The V-number for a step-index fiber is a function of NA as
given in Eq. 3, where d is the core diameter:
πd
VNA
λ
=
(3)
A value of V=2.405, or lower, indicates single mode behavior. The V-number for the As
2
S
3
fiber used was ~2.8 During the experiments, the mode field pattern was monitored by
imaging the output on a Vidicon camera to make sure only the fundamental mode was
launched. Using the NA and V-number values, the Mode Field Diameter (MFD), d
1/e
2
, for
the fundamental mode will be given by Eq. 4 and is listed in Table 2:
Frontiers in Guided Wave Optics and Optoelectronics
38
-70
-60
-50
-40
-30
-20
-10
0
21 mW
23 mW
1548.25 1548.35 1548.45 1548.55 1548.65 1548.75
-70
-60
-50
-40
-30
-20
-10
0
27 mW
30 mW
Fig. 12. Typical spectra of the reflected light sampled by the circulator for different launched
pump powers into the As
2
S
3
fiber core. Fiber length was 10.0 m. Estimated SBS threshold:
(27 ± 3) mW. Tick labels shown only on one plot for clarity.
-70
-60
-50
-40
-30
-20
-10
0
80 mW
112 mW
1548.25 1548.35 1548.45 1548.55 1548.65 1548.75
-70
-60
-50
-40
-30
-20
-10
0
119 mW
133 mW
Fig. 13. Typical spectra of the reflected light sampled by the circulator for different launched
pump powers into the As
2
Se
3
fiber core. Fiber length was 5.0 m. Estimated SBS threshold:
(127 ± 7) mW. Tick labels shown only on one plot for clarity.
Wavelength (nm)
Wavelength (nm)
Nonlinear Properties of Chalcogenide Glass Fibers
39
2
1.5 6
1/e
1.619 2.879
dd(0.65 )
VV
=× + +
(4)
The propagation loss is also an important parameter as it defines the effective interaction
length for the Brillouin scattering process. The values reported in Table 2 represent
relatively low losses for both singlemode fibers at 1.56 µm. However, it should be possible to
lower the losses even further by improved fiber drawing and glass fabrication processes.
Fiber
Core
dia.
[µm]
Clad
dia.
[µm]
Core
Refractive
Index
NA
V-
number
d
1/e2
MFD
[µm]
(calculated)
Loss
[dB.m
-1
]
As
2
S
3
4.2 142.0 2.45 0.33 2.8 4.2 0.57
As
2
Se
3
6.5 175.0 2.81 0.14 1.8 9.0 0.90
Table 2. Chalcogenide fiber parameters (at wavelength of 1.56 µm).
From the experimentally determined threshold power values (Pth) shown in figures 12 and
13, one can estimate the Brillouin gain coefficient (g
B
) using Eq. 5 (Song et al, 2006; Ippen
and Stolen, 1972):
eff
th
eff B
A
P21
Lgk
≅
(5)
In the Eq. 5, k is a constant which reflects whether the polarization is maintained constant
throughout the interaction (k = 1) or not (k = 0.5, our case). Also, the Aeff and Leff are the
effective area of the fundamental mode, and the effective interaction length, respectively.
These are given by Eq. 6 and Eq. 7, where L is the fiber length, α is the propagation loss, and
the mode-field diameter is determined by Eq. 3 above.
2
2
1/e
eff
πd
A
4
=
(6)
()
αL
eff
1
L1e
α
−
=−
(7)
Using Eqs. 5-7, the parameters from Table 3, and the fiber lengths and pump threshold values
indicated in Fig. 11 and Fig. 12, The Brillouin coefficient is estimated to be (3.9 ± 0.4) x 10
-9
m.W
-1
for the As
2
S
3
and (6.75 ± 0.35) x 10
-9
m.W
-1
for As
2
Se
3
. The value for the As
2
Se
3
is close to
the only other previously published result for this composition (Song et al, 2006). The value for
the As
2
S
3
fiber, although lower than the one for As
2
Se
3
, is still two orders of magnitude higher
than that for fused silica ( ~4.4 x 10
-11
m.W
-1
) (Song et al, 2006; Ogusu et al., 2004).
9. Slow light
The slow-light technique based on stimulated Brillouin scattering (SBS) in optical fibers has
attracted interest as it allows a very simple and robust implementation of tunable optical
pulse delays, using mostly standard telecom components. Especially important are non-
silica-based fibers with higher nonlinearity since these require lower powers and shorter
lengths for practical implementations.
Frontiers in Guided Wave Optics and Optoelectronics
40
To date, there have been reports of slow-light generation in Bi-oxide high-nonlinearity fiber
(Jáuregui, C. et al., 2006), telluride fiber (Abedin, K., 2008) and of very efficient slow and fast
light generation in As
2
Se
3
chalcogenide fiber (Song, K. et al., 2006). Additionally, the SBS
process has been studied in As
2
S
3
glass fibers (Florea et al., 2006). The very large Brillouin
gain coefficient presents the chalcogenide fibers as alternatives to silica fiber for slow-light
applications. A figure of merit (FOM) has been proposed (Song et al., 2006) in order to
quantify the usefulness of a given fiber for slow-light based applications. The Brillouin gain
is considered a positive factor while the length, the refractive index, and the power are
considered as negative factors impacting the response time and the onset of additional
nonlinear effects in the system. The FOM (Song et al., 2006) requires knowledge of the actual
Brillouin gain which has to be measured, and takes into account the effective length not the
total length of fiber. One can re-write the FOM such as to reduce it to the primary quantities
describing the fiber (effective area, length and propagation loss, refractive index, and
Brillouin gain coefficient expressed in dB):
p
Beff
eff
pp
P
10 log(exp(g k L ))
Gain[dB] A
FOM
PnL PnL
×
≡=
(8)
The FOM can be further reduced to:
Beff
eff
gkL
FOM 4.34
nA L
=
(9)
It is important to keep in mind that this FOM essentially determines what length and power
are needed in a system to achieve a certain gain, and hence a certain time delay. The FOM as
defined above in Eq. 9 tends to be a quantity which obscures the physical meaning
contained in Eq. 8. Actually, the theoretical gain (G
th
), expressed in dB, as given by Eq 10,
could be used instead to compare different fibers, if one considers a standard fiber length of
1 m and a standard pump power of 1 mW. Then, the theoretical gain is given by Eq. 10:
Beff
L1m
th
eff
gk 1mW L
G [dB] 4.34
A
=
××
=
(10)
One can use this last, fairly simple expression to compare the most representative fibers
considered so far: silica (Song et al., 2005; Ruffin et al., 2005), high-nonlinearity bismuth fiber
(Jáuregui et al., 2006; Lee et al. 2005), As
2
Se
3
fiber (Song et al., 2006), along with the results
reported here. The comparison is provided in Table 3, with all the data reported for
experiments without polarization control (k=0.5). Also included is the FOM as defined
above for completion. One can easily notice the significant increase in the theoretical gain
(or FOM) for the As
2
S
3
fiber due to its smaller core, lower loss and slightly reduced
refractive index.
A typical experimental setup for slow light demonstration using chalcogenide fiber is
detailed in Figure 14. The components contained within the dashed contour lines were only
employed for the delay measurements. The output of a DFB laser (at 1548 nm) was split in
two components, one which will serve as a pump while the other will serve as a counter-
propagating signal.
Nonlinear Properties of Chalcogenide Glass Fibers
41
Silica [a] Bi-HNL [b] As
2
Se
3
[c] As
2
Se
3
As
2
S
3
N 1.47 2.22 2.81 2.81 2.45
Aeff [m
2
] 6.78x10
-11
0.3x10
-11
3.94x10
-11
6.31x10
-11
1.39x10
-11
loss [dB.m
-1
] 0.001 0.91 0.84 0.90 0.57
L [m] 2.0 2.0 5.0 5.0 10.0
Leff [m] 2.0 1.63 3.23 3.1 5.6
g
B
[m.W
-1
] 4.40x10
-11
6.43 x10
-11
6.10x10
-9
6.75x10
-9
3.90x10
-9
G
th
[dB] 0.076 0.003 1.084 0.719 3.398
FOM [dB.W
-1
.m
-1
] 1 17 77 51 139
[a] Song et al.,2005; Ruffin et al., 2005 ; [b] Jáuregui et al., 2006 ; [c] Song et al., 2006
Table 3. Comparison of figure of merit for slow-light based applications at 1.56 µm.
Fig. 14. Experimental setup used for gain and delay (dashed contour line) measurements.
Abbreviations: LD – laser diode, EOM – electro-optical modulator, FBG – fiber Bragg grating
filter, EDFA – Er-doped fiber amplifier, VOA – variable optical attenuator, fPD – fast
photodiode, Amp – electrical amplifier.
The signal component is frequency shifted by a certain amount (f
m
) such as to match the
Brillouin shift. Using a LiNbO
3
modulator and a signal generator one can generate two side-
bands which are then separated by using a fiber Bragg grating (FBG) filter. The center
frequency is suppressed through DC biasing. For the gain measurements, the signal is
coupled into the chalcogenide fiber and the output is monitored with an OSA. For the delay
measurements, the signal, prior to being coupled into the fiber, is modulated (sine wave at
25 MHz) with a LiNbO
3
modulator and a DS345 signal generator. The output is then passed
through a variable optical attenuator (VOA) and detected with a fast photodiode and an
amplifier on an oscilloscope. The VOA allowed us to control the signal on the detector such
Frontiers in Guided Wave Optics and Optoelectronics
42
that we maintained the same signal (as low as possible) throughout the gain measurement
to avoid any electronics-induced time response.
The pump is amplified with a standard EDFA and passed through a circulator before being
coupled into the chalcogenide fiber, counter-propagating with the signal. The circulator
allows us the signal to be picked off and sent to the detector.
The in-house drawn fiber used in this work was similar to the one used in previous work
(Florea et al., 2006) but this time the fiber was cabled and both ends were antireflection
coated. The fiber had a core of 5.2
μm diameter and a clad of 150 μm diameter, while the loss
at 1550 nm was measured to be 0.138 m
-1
(0.6 dB.m
-1
). The effective area of the fundamental
mode was measured and the critical power, P
th
, for a 10-m length of fiber was determined,
directly from the variation, with pump power, of the counter-propagating signal generated
through Brillouin scattering. This was done in order to check the previous estimate of the g
B
coefficient (Florea et al., 2006), which was obtained by rather qualitatively analyzing the
spectral changes of signal. By using A
eff
and P
cr
to determine g
B
as detailed below, this
approach follows the method used in previous work (Song et al., 2006; Abedin, 2006)
although a more exact analysis was proposed elsewhere (Ogusu, 2002).
The effective area (A
eff
) was measured by imaging the fiber output on a vidicon camera
using an appropriate microscope objective. A
eff
was measured directly rather than use a
theoretical estimate (Song et al., 2006) due to the fact that the fiber had a very high NA
(greater than 0.30) making it possible for a second, higher order mode to contribute to the
fundamental mode field. The measuring system was calibrated by also imaging a patch of
SMF28 fiber with well known mode-field diameter (MFD) of 10.4 ± 0.8 μm at 1550 nm. The
MFD for the chalcogenide fiber was thus determined to be 5.2
± 0.4 μm.
The critical power was measured by monitoring the intensity of the Brillouin scattered
signal versus the launched, counter-propagating pump power. A more precise analysis is
usually performed in silica fibers (Ruffin et al., 2005). The coupling efficiency was estimated
from fiber throughput measurements. The reflected signal was collected using a circulator,
and the values of the Brillouin peak were read directly from the optical spectrum analyzer
(OSA). Several measurements were made which yielded an average P
th
of 29 ± 6 mW, which
is close to the previously reported value (Florea et al., 2006) of 27
± 3 mW. A typical data set
is shown in Figure 15.
0 102030405060
0.0
0.2
0.4
0.6
0.8
1.0
1.2
1.4
signal [a.u.]
launched power [mW]
Fig. 15. Brillouin scattered signal in As
2
S
3
fiber versus launched pump power.
Nonlinear Properties of Chalcogenide Glass Fibers
43
Using Equation 7, in which
α is the fiber loss and L is the fiber length, an estimate of the
effective fiber length (L
eff
) can be obtained, giving a value of 5.4 m. Finally, one can use these
values for A
eff
, P
th
, and L
eff
, to estimate the Brillouin scattering coefficient using Equation 5,
where k = 0.5, in this case. Using proper error analysis, the Brillouin scattering coefficient
was determined to be (5.7 ± 2.0) x 10
-9
m.W
-1
for the As
2
S
3
fiber.
7.90 7.92 7.94 7.96 7.98 8.00 8.02
0.0
0.2
0.4
0.6
0.8
1.0
nomr. signal [a.u.]
frequency [GHz]
31 MHz FWHM
(Lorentzian fit)
Fig. 16. Typical linewidth of the Brillouin signal at low pump power.
Additionally, the linewidth of the Brillouin signal was measured using a small probe (~ 8
μW) launched counter-propagating through the fiber. The Brillouin shift was identified to be
7.96 GHz while the linewidth of the Brillouin shift was found to be 31 MHz with typical
data being represented in Figure 16. The linewidth was measured at low pump powers.
Linewidth narrowing was observed for higher powers with linewidths as small as 19 MHz
being recorded.
Gain and delay measurements using a small signal (~ 8
μW) have been performed in the
chalcogenide fiber. For the gain measurement, the signal peak values were read from the
OSA for different pump powers. For the delay measurement, the relative shift of the sine
wave was read from the oscilloscope. Typical set of traces is shown in Figure 17.
Fig. 17. Typical waveforms showing the delay for different pump powers.
Frontiers in Guided Wave Optics and Optoelectronics
44
The observable gain and delay were limited by the damage threshold of the AR coating,
which unfortunately was lower than the threshold for the bare As
2
S
3
glass. A slow variation
of the amplified signal was observed which perhaps was due to the lack of polarization
control in the setup. The overall results are represented in Figure 18.
0 5 10 15 20 25
0
5
10
15
20
25
30
35
40
1.57 dB/mW
gain [dB]
launched power [mW]
(a)
0 5 10 15 20 25 30 35 40
0
5
10
15
20
25
30
0.67 ns / mW
delay [ns]
launched power [mW]
(b)
Fig. 18. (a) Gain and (b) pulse delay measurements in 10-m long As
2
S
3
fiber at 1548 nm.
The slope of gain-versus-power is twice as large as the best previously reported result
(Abedin, 2008). This was expected based on the analysis of the figure of merit (FOM) for the
SBS process in these fibers (Song et al., 2006; Florea et al., 2006). However, the gain slope
falls short of the theoretical estimate. Using the undepleted pump approximation, the small-
signal gain is given theoretically by Equation 11:
B
eff
th
eff
gkL
G [dB] 4.34 P
A
×
×
=
× (11)
Nonlinear Properties of Chalcogenide Glass Fibers
45
Using the experimentally determined values for the involved parameters along with the
associated uncertainties, Equation 11 gives us a slope in the range [1.8 … 5.0] dB.mW
-1
.
Inhomogenities in the fiber core diameter which we have noticed, the potential presence of a
second mode and the pump depletion approximation can be viewed as factors contributing
to the discrepancy.
The same factors can also influence the delay data. Once again one can predict theoretically
how much the peak of the signal pulse would be delayed (Δt) assuming an undepleted
pump. The group velocity (given by v
g
= c/n
g
, c – speed of light, n
g
total fiber group index)
determines the time that a given pulse will take to travel the effective length of fiber. In the
presence of the pump, the group velocity at the peak of the Brillouin gain will be modified
according to Equation 12 (Okawachi et al., 2005), where Δυ is the linewidth (full-width half-
maximum) of the Brillouin shift:
g
/
1
v2
f
geff
nGL
c
π
ν
=+
×
Δ
(12)
For a narrow linewidth pulse the delay, that is difference between the transit times required
by the pulse with and without the pump, will then be given by Equation 5 (Okawachi et al.,
2005):
B
eff
eff
gkL
G
Δt P
2A2πΔν
πν
×
×
≈
=×
×Δ × ×
(13)
Using the experimentally determined values for the involved parameters along with the
associated uncertainties, Equation 13 gives us a slope in the range [2.1 … 5.9] ns.mW
-1
. For
this type of fiber, Equation 13 indicates theoretically that delays on the order of 100 ns or
more can be obtained for reasonable powers.
While in practical terms a 19 ns delay was obtained for only 31 mW of pump power, which
is marginally better than the result in the As
2
Se
3
fiber (Abedin, 2008), these experimental
values fall short of the theoretical expectations. The choice of the 25 MHz frequency for
modulation of the signal was unfortunate since it turned out to be too close to the Brillouin
linewidth, especially at low powers. Future work will try different modulation parameters
and will also provide a study to gain an insight into the nature and origin of fiber
imperfections and the role of polarization which can negatively influence the performance
of this system. This understanding will pave the way forward for delays of the order of 20
ns with as little as 10 mW of launched power.
10. Conclusions
The large nonlinearities and fast response of the nonlinearity of the As-S-Se system make
fibers drawn from these glasses well suited for optical switches, optical regenerators for
high speed telecommunication systems. Use of these materials will allow compact devices
cm’s in length with optical powers <1W peak power (1 pJ in 1 ps pulses). The large Raman
gain of the As-S-Se fibers coupled with the large IR transparency make these well suited for
compact Raman amplifiers for telecommunications as well as fiber lasers and amplifiers in
the mid-IR. These high nonlinearities also allow efficient supercontinuum generation which
Frontiers in Guided Wave Optics and Optoelectronics
46
is useful for broadband sources in the near and mid-IR. Finally these materials can be poled
to induce an effective
χ
(2)
, opening up the potential of waveguide parametric amplifiers.
The stimulated Brillouin scattering process was studied in As
2
S
3
and As
2
Se
3
single mode
fibers. Values of the Brillouin gain coefficient were measured to be (3.9 ± 0.4) x 10
-9
m.W
-1
and (6.75 ± 0.35) x 10
-9
m.W
-1
, respectively. An analysis of the figure of merit for slow-light
based applications indicates that the smaller core As
2
S
3
fiber performs best due to the lower
loss, reduced core size and slightly lower refractive index. The configuration using the
small-core As
2
S
3
fiber yields a figure of merit which is about 140 times larger, or a theoretical
gain about 45 times larger, than the best silica-based configurations reported to date.
The continued improvement of chalcogenide materials will make such devices feasible in
the near term.
11. References
Abedin, K. (2006). Observation of strong stimulated Brillouin scattering in single-mode
As
2
Se
3
chalcogenide fiber. Opt. Express 13, pp. 10266-10271.
Abedin, K.; Lu, G. and Miyazaki, T. (2008). Electron. Lett 44 , pp. 16.
Asobe, M.; Kanamori, T.; Naganuma, K.; Itoh, H. and Kaino, T. (1995). Third-order
nonlinear spectroscopy in As
2
S
3
chalcogenide glass fibers. J. Appl. Phys. 77, pp.
5518-5523.
Asobe, M; Kobayashi, H; Itoh, H; and Kanamoir, T; (1993) Laser-diode-driven ultrafast all-
optical switching by using highly nonlinear chalcogenide glass fiber, Opt Lett, 18,
pp. 1056-1058.
Borisova, Z. (1981). Glassy Semicondutors, Borisova, Z. (Ed.), Plennum Press, NY, USA.
Churbanov, M. (1992). J. Non-Cryst. Solids, Vol. 140, pp. 324.
De Aruajo, M.; Vermelho, M.; Gouveia-Net, A.; Sombra, A. and Medeiros Neto, J. (1996).
IEEE Photonics Technol. Letts., Vol. 8, pp. 821.
Devyatykh, G.; Churbanov, M.; Scripachev, I.; Dianov, E. and Plotnichenko, V. (1992).
International Journal of Optoelectronics, Vol. 7, pp. 237-254.
Dianov, E.; Kazansky, P. and Stepanov, D. (1989). Sov. J. Quant. Electron., Vol. 19, pp. 575.
Edwards, G.; Logan, R.; Copeland, M.; Reinisch, L.; Davidson, J.; Johnson, B.; Maciunas, R.;
Mendenhall, M.; Ossoff, R.; Tribble, J.; Wekhaven, J. and O’Day, D. (1994). Nature,
Vol. 371, pp. 416-418.
Florea, C.; Bashkansky, M.; Dutton, Z.; Sanghera, J. & Aggarwal, I. (2006) Stimulated
Brillouin scattering in single-mode As
2
S
3
and As
2
Se
3
chalcogenide fibers. Opt.
Express, 14, 12063-12070.
Galili, M; Xu, J; Mulvad, H; Oxenlowe, L;, Clausen, A; Jeppesen, P; Luther-Davies, B;
Madden, S; Rode, A; Choi, D; Pelusi, M; Luan, F; and Eggleton, B (2009)
Breakthrough switching speed with an all-optical chalcogenide glass chip: 640
Gbit/s demultiplexing, Opt. Exp, 17, pp. 2182-2187
Harbold, J.; Ilday, F.; Wise, F.; Sanghera, J.; Nguyen, V.; Shaw, L. and Aggarwal, I. (2002)
Optics Letters, Vol. 27, pp. 119.
Hu, J.; Menyuk, C., Shaw, L., Sanghera, J., and Aggarwal, I., (2009) Generating mid-IR
source using As
2
S
3
-based chalcogenide photonic crystal fibers, Proc. Conference on
Lasers and Electro-Optics (CLEO) 2009, Optical Society of America
Nonlinear Properties of Chalcogenide Glass Fibers
47
Hu, J.; Menyuk, C., Shaw, L., Sanghera, J., and Aggarwal, I., (2008) Raman response
function and supercontinuum generation in chalcogenide fiber, Proc. Conference on
Lasers and Electro-Optics (CLEO) 2008, Optical Society of America
Ippen, E. and Stolen, R. (1972). Stimulated Brillouin scattering in optical fibers. Appl. Phys.
Lett., 21, pp. 539-541.
Jackson, S; and Anzueto-Sanchez, G; (2006) Chalcogenide glass Raman fiber laser, Appl.
Phys. Lett., 88, p. 221106
Jáuregui, C.; Ono, H.; Petropoulos, P. and Richardson, D. (2006). Four-fold reduction in the
speed of light at practical power levels using Brillouin scattering in a 2-m bismuth-
oxide fiber. OFC, paper PDP2.
Kazansky, P.; Russell, P. and Takabe, H. (1997). J. Lightwave Tech., Vol. 15, pp. 1484.
Lenz, G.; Zimmermann, J.; Katsufuji, T.; Lines, M.; Hwang, H.; Spalter, S.; Slusher, R.;
Cheong, S.; Sanghera, J. and Aggarwal, I. (2000). Optics Letts., Vol. 25, pp. 254.
Lee, J.; Tanemura, T.; Kikuchi, K.; Nagashima, T.; Hasegawa, T.; Ohara, S. and Sugimoto,
N. (2005). Experimental comparison of a Kerr nonlinearity figure of merit
including the stimulated Brillouin scattering threshold for state-of-the-art
nonlinear optical fibers. Opt. Lett. 30, 1698-1700.
Nasu, H.; Ibara, Y. and Kubodera, K. (1989). J. Non-Cryst. Solids, Vol. 110, pp. 229.
Ogusu, K. (2002). Analysis of Steady-State Cascaded Stimulated Brillouin Scattering in a
Fiber Fabry–Pérot Resonator. IEEE Photon. Tech. Lett. 14, pp. 947-949.
Ogusu, K.; Li, H. and Kitao, M. (2004). Brillouin-gain coefficients of chalcogenide glasses. J.
Opt. Soc. Am. B., 21, pp. 1302-1304.
Okawachi, Y.; Bigelow, M.; Sharping, J.; Zhu, Z.; Schweinsberg, A.; Gauthier, D.; Boyd, R.
and Gaeta, A. (2005). Phys. Rev. Lett. 94, pp. 153902.
Pelusi, M; Ta’eed, V; Fu, L.; Magi, E.; Lamont, M; Madden, S; Choi, D; Bulla, D; Luther-
Davies, B; Eggleton, B; (2008) Applications of highly-nonlinear chalcogenide glasss
devices tailored for high-speed all-optical signal processing, IEEE J. Sel. Top in
Quant. Electron., 14, pp. 529-539.
Richardson, K.; McKinley, J.; Lawrence, B.; Joshi, S. and Villeneuve, A. (1998). Opt. Mats.,
Vol. 10, pp. 155.
Ruffin, A. (2004). Stimulated Brillouin Scattering: An overview of measurements, system
impairments, and applications. NIST Symposium on Optical Fiber Measurements,
Technical Digest, pp. 23-28.
Ruffin, A.; Li, M.; Chen, X.; Kobyakov, A. and Annunziata, F. (2005). Brillouin gain analysis
for fibers with different refractive indices. Opt. Lett. 30, pp. 3123-3125.
Sanghera, J.; Busse, L. and Aggarwal, I. (1994a). J. Appl. Phys., Vol.75, pp. 4885 .
Sanghera, J.; Nguyen, V.; Pureza, P.; Kung, F.; Miklos, R. and Aggarwal, I. (1994b). J.
Lightwave Tech., Vol. 12, pp. 737.
Sanghera, J.; Aggarwal, I.; Busse, L.; Pureza, P.; Nguyen, V.; Miklos, R.; Kung, F. and
Mossadegh, R. (1995). SPIE, Vol.2396, pp. 71.
Sanghera, J.; Aggarwal, I.; Busse, L.; Pureza, P.; Nguyen, V.; Kung, F.; Shaw L. and Chenard,
F. (2005). Chalcogenide Optical Fibers Target Mid-IR Applications. Laser Focus
World, April Vol. 41 No. 4, pp. 83-87.
Shaw, L.; Thielen, P.; Kung, F.; Nguyen, V.; Sanghera, J. and Aggarwal, I. (2005). IR
supercontinuum generation in As-Se photonic crystal fiber. Proceedings of Advanced
Solid State Photonics, TOPS vol. 98, Optical Society of America.
Frontiers in Guided Wave Optics and Optoelectronics
48
Slusher, R.; Hodelin, J.; Sanghera, J.; Shaw, L. and Aggarwal, I. (2004). JOSA-B, Vol. 21, pp.
1146.
Song, K.; Herráez, M. and Thévenaz, L. (2005). Observation of pulse delaying and
advancement in optical fibers using stimulated Brillouin scattering. Opt. Expr. 13,
pp. 82-88.
Song, K.; Abedin, K.; Hotate, K.; Herráez, M. and Thévenaz, L. (2006). Highly efficient
Brillouin slow and fast light using As
2
Se
3
chalcogenide fiber. Opt. Expr. 14, pp.
5860-5865.
Thielen, P.; Shaw, L.; Pureza, P.; Nguyen, V.; Sanghera, J. and Aggarwal, I. (2003a). Small-
core As-Se fiber for Raman amplification. Optics Letters, 28, pp. 1406-1408.
Thielen, P.; Shaw, L.; Sanghera, J. and Aggarwal, I. (2003b). Optics Express, Vol. 11, pp. 3248-
3253.
3
Irradiation Effects in Optical Fibers
Sporea Dan
1
, Agnello Simonpietro
2
and Gelardi Franco Mario
2
1
National Institute for Lasers, Plasma and Radiation Physic, Laser Metrology Laboratory,
2
University of Palermo, Department of Physical and Astronomical Sciences
1
Romania,
2
Italy
1. Introduction
Intrinsic and extrinsic optical fiber-based sensors are promising devices to be used in very
different and complex environments, by their very nature: capabilities to work under
electromagnetic fields; possibility to carry multiplexed signals (time, wavelength
multiplexing); small size and low mass; ability to handle multi-parameter measurements in
distributed configuration; possibility to monitor sites far away from the controller. In the
case of the optical fibers, the possibility to be incorporated into various types of sensors and
actuators, free of additional hazards (i.e. fire, explosion), made them promising candidates
to operate in adverse conditions as those required by space applications and terrestrial
nuclear facilities (Alam et. al.
a
, 2006; Alam et al.
b
, 2006; Berghmans et al., 2008; Ott, 2002). In
nuclear environments optical fibers found an application niche in optical communication
links, embedded into various all-fiber or hybrid sensors or as light-guides for control and
diagnostics (Alfeeli et al., 2007; Ahrens et al., 2001; Fernando et al., 2005; Fielder et al., 2005;
Florous et al., 2007; Gan et al. 2008; Henschel et al., 2001; Kimurai et al. 2002; O'Keeffe et al.
2008; Reichle et al., 2007; Troska et al., 2003). For applications related to fusion installations
the requirements are quite demanding because of the exposure to (Campbell, 2005; Griscom,
1998; Hodgson, 2006; ITER Physics Expert Group on Diagnostics, 1999; Shikama, 2003;
Zabezhailov, 2005): ionising radiation, high temperature, and high electromagnetic
disturbances.
One of the major drawbacks for optical fibers use under ionizing radiation is related to the
development of colour centres, which affect dramatically the optical transmission in UV-
visible-NIR spectral ranges (Griscom, 1998; Karlitschek, 1995). For this reason, optical fibers
are by more than 30 years in the focus of colour centres research (Friebele, 1976; Kaiser,
1974).
Research on radiation induced colour centres in pure and doped bulk silica materials has a
long history of over 50 years (Weeks, 1956), but it is still actual (Radiation effects, 2007;
Devine et al., 2000; Pacchioni et al., 2000), as new materials and devices (optical fibers,
waveguides, multiplexers, or fiber lasers) are continuously devised and evaluated. Apart
from the diversity of the investigated materials and devices new challenges are presented by
the various irradiation conditions to which such materials and devices are subjected.
The complexity of the colour centres dynamics lead to the use of complementary methods to
individuate these centres (electron paramagnetic resonance: EPR, luminescence) besides the