Protect Your Wealth from the Ravages of Inflation_5 ppt
Bạn đang xem bản rút gọn của tài liệu. Xem và tải ngay bản đầy đủ của tài liệu tại đây (703.91 KB, 15 trang )
Step 3: Generate a Good Risk-Adjusted Return on Investments
74
I’m sure the numbers will be both interesting and eye-opening, especially if
you have never done any kind of risk-adjusted-return analysis before. Your
last financial advisor told you to just invest and then forget about it, right?
After all, nobody can “time the market,” and you’re not going to get out of
your investments whatever happens, so why worry yourself with short-term
results when you don’t need the cash in the account for years and years in
the future?
I’ll assume you went off and did your homework and came back with terri-
ble MAR ratios that were much less than 0.5, or even much less than zero.
And your CAGRs are probably nowhere near the “standard” 10% every-
body talks about, and you most likely have drawdowns that are at least 50%,
if not closer to 60%. If this is not the case, then you’re already an invest-
ment guru (or you did your number crunching wrong), and you don’t need
to read the rest of this chapter.
If the only result of reading this chapter is that you finally understand
whether you’re getting paid for the risk you are taking in your investments
accounts, then all your hard work understanding this information so far will
have paid off big time. You may not be inclined to actively manage your in-
vestments yourself, but if you stop doing what doesn’t work and put that
cash into your emergency fund or savings as described in the previous two
chapters, you’ll be much better off than if you do nothing.
Let’s assume you now realize that you’re getting a terrible result from your
current investment management methods (if you can call what you’ve been
doing before “a method”). Before we get into the details about managing
your investments, I need to make a couple of things very clear:
For most people, it is not appropriate or rational to take uncon-
trolled risk in an investment account, with little chance of a decent
return—especially with your retirement savings.
There is no way that I (or anyone) can show you how to achieve
the same performance that a full-time professional money manager
can achieve in your investment accounts, even if you do put in the
hour per week or so of effort into a spreadsheet, as this chapter
will show you how to do.
For these reasons it’s important that I talk about not actively managing your
investment accounts before I talk about how to manage them effectively.
Protect Your Wealth from the Ravages of Inflation
75
Don’t Even Think About Trying to
Manage Your Retirement Account
I’ve shown earlier in this book that FARCE
1
doesn’t work, and if that’s what
you’re doing in your retirement or investment accounts, then you’re likely
going to be disappointed when you retire. If your employer is making
matching contributions, then you should treat these as your “return on in-
vestment.” This “free money,” along with the deferral of income taxes until
you retire, should mean that your account grows faster than inflation.
If you think about this for a minute, you should reach a conclusion: you
should put your entire retirement account into a money market fund to
minimize risk. Yes, you’ll get a tiny return, but you’ll pay the lowest fees and
have the lowest chance of losing money. Note that your plan sponsor, your
employer, your friends and family, or anyone else you mention this to will
think you are crazy to give up the long-term “10%-a-year return” that so
many investment advisors point to as a bedrock financial fact. Don’t even at-
tempt to explain your rationale—just tell them to read this book.
As for your other investment accounts, where nobody is doing any match-
ing contributions on your behalf, then you should seriously consider
whether there is a better place for you to apply that cash than the shark-
infested waters of the financial industry. If you are still going to risk it, then
make sure you have a sound investment method that has a reasonable
chance of success. This is what the rest of this chapter is about.
Mr. and Mrs. Fit Visit a Casino
Mr. and Mrs. Fit decide to take a vacation to Las Vegas and go see some shows.
While they are there, they decide to visit a casino on the main strip. The casino
happens to be hosting a huge poker event, and the Fits decide to participate. Mr.
Fit read a book about Texas hold ’em a while ago, and Mrs. Fit has a natural tal-
ent with probabilities and numbers.
To enter the tournament, all they have to do is “buy in” for an initial $10,000. If
they lose that, then they can buy more chips any time they like—they just have to
pony up more cash. The casino takes a small fee (called a rake) from the pot for
every hand played. They can also cash out their chips any time they like and get
their remaining cash back.
1
For those of you who don’t remember, it stands for Faithful Annual Rebalancing of Common
ETFs.
Step 3: Generate a Good Risk-Adjusted Return on Investments
76
This is a huge tournament, and there are about 1,000 players at any one time.
The average buy-in is about $10,000. Mr. and Mrs. Fit are just like 95% of the
players—amateurs playing for fun, people on vacation looking for a thrill, people
who have read some books on poker and think they can employ simple strategies
to make some consistent, easy money. There are even some people who have
taken their retirement savings and think they can consistently increase their chip
stack by “playing the odds” and only betting when they have a “good” hand.
The other 5% of the players in the tournament are full-time professional poker
players. They play day-in, day-out and are experts at reading the other players,
managing their chip stack, and knowing when to bluff and when to fold. They can
easily calculate probabilities in their heads. They can also do some pretty neat
tricks with poker chips since they are so used to handling them, and they always
know exactly how many chips they have in play and how many are in the pot.
Mr. and Mrs. Fit start playing conservatively and make only small bets. The casino
gets paid because it takes its fee for each hand played. So the number of chips in
play is slowly decreasing, but not really fast enough for anyone to notice. Mr. Fit
notices that there is one player at his table that seems to be doing well, and a sig-
nificant amount of chips seem to be accumulating in front of him. Other people at
Mr. Fit’s table are either quitting because they are out of chips, or buying in again
if they have some cash remaining.
No matter what Mr. Fit does, it seems that the “good” player always folds when
Mr. Fit has a good hand and makes a large bet, calls or raises when Mr. Fit bluffs,
and makes a bet when he has poor cards. It’s almost like the other player knows
what Mr. Fit’s cards are, even though he is very careful to keep them concealed
when he looks at them.
Mrs. Fit is doing a little better because of her superior probability, statistics, and
number skills. She is managing to bet only when the odds are in her favor and not
risk a lot of money, even when she thinks her opponents have inferior hands.
However, effective chip-stack management and playing the odds well can only
slow down the gradual flow of Mrs. Fit’s chips to the casino and the superior play-
ers in the tournament.
The Fits play for a few hours, lose 20% of their chips, and decide to cash out. Mr.
Fit decides he needs to read some more books on good poker strategy before
coming back and trying again next year—if only he had the right betting tech-
nique and playing strategy, he could clean up. What Mr. Fit doesn’t realize is that
it’s impossible to make money in this environment unless you’re either the casino
taking the rake, or one of the small number of full-time professional players who
consistently end up with the amateurs’ chips before the casino takes them, again
via its rake.
Protect Your Wealth from the Ravages of Inflation
77
If this sounds familiar, it’s because it is a great analogy for the way the financial
industry works.
If You Do Want to Manage Your Own
Investment Accounts, Don’t Use FARCE
If you’ve read this far and you have followed all the rest of the advice in this
book, then you’re probably pretty financially savvy and also pretty adept at
making a spreadsheet program work for you. You have an emergency fund
in precious metals, you’ve put your savings into currencies or ETFs de-
pending on the prevailing interest rate environment, and you have your re-
tirement account funds “safe” in a money market account.
However, because your finances are now fit and you’re making more cash
every month than you spend, you have more savings than you’re comfort-
able with simply rebalancing on a quarterly basis. Because upon scrutiny, if
you did the homework I mention in the previous section, it probably
hasn’t worked out that well. You want a chance of a better return by tak-
ing more risk in a controlled manner. The rest of this chapter is the best
way to go about doing this if you don’t know any good money managers
who will take your cash and manage it full-time for a reasonable fee. The
good money managers are few and far between, and even if you can find
one, they probably don’t want the hassle of managing a load of relatively
small accounts (small to them anyway). As a result, they often have high
minimum-investment requirements or only take institutional funds from
other financial firms.
If you have $100,000 but don’t have the passion, inclination, time, or techni-
cal skills to manage it yourself, then drop me a line and I can refer you to
someone who implements the techniques I describe in the rest of this chap-
ter for a small annual asset management fee.
Whatever you do, though, please take heed of these warnings:
Don’t use FARCE to manage your investment accounts.
Don’t use dollar cost averaging to manage your investment ac-
counts.
If you don’t understand why, just take a closer look at Chapter 2 and Figure
5-1 later in this chapter.
Step 3: Generate a Good Risk-Adjusted Return on Investments
78
“Trading” vs. “Investing”
If you buy mutual funds in your retirement account or other brokerage ac-
count and intend to hold on to them for the long term, you’re investing, not
trading, right? Wrong! You’re just trading without any predefined exit strat-
egy. There is only one reason to buy any financial instrument—because you
want to sell it again later when the price has gone up. You can’t buy grocer-
ies with Microsoft stock, so you must sell it first and turn it back into cur-
rency before you can spend the proceeds.
In my opinion, this means that everyone is a trader, not an investor. You’re
an investor if you lend a startup company money in exchange for a share of
the company or a slice of future revenues. Then you don’t technically need
an exit strategy—in this case, meaning a method to limit risk rather than a
way to cash out. Either the company will succeed and you’ll get paid, or it
will fail and you’ll lose your initial investment.
Why am I making this seemingly irrelevant distinction? It’s because there are
six major components to a sound and complete trading strategy. So, for ex-
ample, if you’re a buy-and-hold investor, what you’re really doing is trading
with a system that only has one defined component: the entry signal. This
would be like playing in a poker tournament and only using one rule: “I’ll bet
half of my chips if I have a pair of aces in the hole.” In other words, you bet
only in one instance, letting the chips fall where they may. And you can bet
the chips will fall into the hands of the house and other players. How long
do you think you would last if that was the only rule you had?
Here are the six components of a complete trading approach:
1. Market selection
2. Instrument filter
3. Setup conditions
4. Entry signal
5. Position sizing
6. Exit strategy
You may be looking at this list and thinking, “Wow, that looks like a lot of
work; I don’t want to be a full-time investment manager.” Yes, it’s true,
good trading is not as simple as doing a quarterly rebalancing of your port-
folio. But you have to ask yourself one question: “Am I happy with the per-
formance of my investment account with the methods I’ve been using and
Protect Your Wealth from the Ravages of Inflation
79
the time and effort I’ve put in?” If the answer is a big, fat no, then ask your-
self one more question: “Am I prepared to put in a bit of effort up front in
order to understand and implement a much better method for managing my
investment accounts? A method that will take a maximum of an hour per
week to manage once it’s completed, and will give me a better chance of a
good risk-adjusted return for the rest of my investing life?”If the answers is no,
then you don’t need to read the rest of this chapter, and you should close
your investment accounts and either put the cash into your emergency fund
or take an emergency vacation to somewhere hot and sunny.
So, if you’re still with me, I’ll now deal briefly with each component of a
complete trading method. Note that this is not a complete guide to building
trading programs—it’s meant to show you how little of a complete ap-
proach a buy-and-hold investor really has, and why the results most people
achieve are so predictably terrible (or should that be terribly predictable?).
Occasionally, I’ll relate the component to your retirement account, since in
most cases the major decisions about how you manage this type of invest-
ment account have already been made for you, or your choices are se-
verely restricted.
Market Selection
Market selection determines what markets you will trade, and in turn de-
fines the complete universe of instruments that you will consider as poten-
tially tradable. For example, you could decide that your chosen market will
be all equities listed on the New York Stock Exchange (NYSE), National
Association of Securities Dealers Automated Quotation System
(NASDAQ), and American Stock Exchange (AMEX). In your retirement
account, market selection has probably been decided for you—it’s simply
the list of mutual funds your plan sponsor chose as investment options. By
the way, this choice is normally limited to less than ten, simply so that
you’re more likely to make a choice—any choice. Studies have shown that
if more options are provided, there is an increased probability that the
participant (i.e., you) will choose the money market fund because the par-
ticipant can’t make a decision. This is the last place the company running
your retirement plan wants you to put your cash, simply because their
fees are the lowest in this fund. They want you to allocate to the other
funds that have higher fees.
If you are going to trade your own capital, make sure it’s in an environment
that offers the biggest choice of markets and does not artificially constrain
Step 3: Generate a Good Risk-Adjusted Return on Investments
80
your tradable universe. Interactive Brokers is a good choice since they offer
access to virtually all global electronic markets and their fees are very low.
2
Instrument Filter
The instrument filter determines which instruments in the chosen markets
are suitable for trading right now. Again, this decision has already been
made for you in your retirement account. When choosing instruments to
trade, there are four main factors to consider:
Liquidity: How much volume is there in this instrument?
Spread: What is the difference between the current buying (bid) and
selling (offer) price?
Fees: How much will you have to pay to enter and exit positions?
Slippage: How different will your actual fulfillment price be from the
price quoted when you enter your order?
Not all instruments are liquid enough to trade without large spread and
slippage, and the fees may be high, which could all lead to significant imple-
mentation costs. These eat into your potential profit and amplify any losses.
All an instrument filter does is take the complete universe of all instruments
in a particular market and tells you exactly which ones should be considered
for trading right now. This means that your liquid universe can change on a
daily basis. You must have a method of reevaluating it periodically. It’s not a
“pick once and forget about it” type of thing, like the approach you used in
your retirement account.
For example, if your chosen market is US ETFs listed on the NYSE, then
you could have an instrument filter that says you will only include ETFs that
are in the top tenth percentile measured by average daily volume (ADV)
over the last 30 days. Most financial sites have a method of listing ETFs by
various criteria, including volume, so it should not be a problem to find a
ranked list that makes it simple to only choose instruments that are in the
top 100, or top 10%.
3
2
I am not affiliated with Interactive Brokers, and am simply mentioning them as the most suit-
able choice I have currently found for the implementation of the methods contained in this
book.
3
The ETF center on Yahoo Finance has a suitable ranking tool. Go to Investing, and then ETFs,
choose View ETFs by Volume, and then rank by “Volume (3 mo Avg).”
Protect Your Wealth from the Ravages of Inflation
81
Setup Conditions
Setup conditions are conditions that must be true for a trade to be consid-
ered. An example would be whether the volume today is sufficient for you
to enter a position. Even though the chosen instruments in your market
may have been liquid (had high volume) when you selected them, they may
not have sufficient volume right now to consider a trade.
Again, if you’re talking about your retirement account, then setup con-
ditions have already been decided for you—any time is a good time to in-
vest, and typically your plan will be set up with monthly contributions and
an automatic allocation to your chosen funds. In a sound trading system, not
all instruments in your liquid universe are good candidates for trading all the
time—setup conditions tell you when you should be considering a trade in a
particular instrument, and importantly, when you should not.
Entry Signal
Entry signal determines the specific conditions under which a buy order (or
a sell order if you’re shorting something) is generated. In your retirement
account, the entry signal is, “Buy $X per month based on your predeter-
mined allocation to the funds in your plan.” A valid entry signal should take
into account the prevailing trend of the instrument being considered, and
not just default to “buy every month”—as is done in your retirement ac-
count. If something has been dropping like a stone for the last six months,
what makes you think it’s a good idea to go ahead and buy it right now?
Oh, that dollar cost averaging thing I covered in Chapter 2, right? Again, it’s
probably not a good idea to ignore the prevailing trend and go ahead and
buy anyway?
Of all the concepts about the way markets work that are endlessly argued
over by all the participants in the market, there are only two that you really
need to understand:
Momentum
Inertia
In physics, momentum is defined as the tendency for a body that is in mo-
tion to stay in motion unless acted upon by an external force. Inertia is the
tendency for a body that is at rest to stay at rest unless acted upon by an
external force. In trading, momentum means that if the price of an instru-
ment is moving in a particular direction, then it will often continue to move
in that direction unless something changes. Inertia means that if the price of
Step 3: Generate a Good Risk-Adjusted Return on Investments
82
an instrument is going nowhere, then it will often continue to go nowhere
unless something changes.
The practical implications of these concepts are pretty simple to understand:
Buy things that are going up.
Sell things that are going down.
Don’t buy or sell things that are going sideways.
Position Sizing
Position sizing is how much to buy or sell at any point in time, and depends
on several factors that I will describe in detail later in this chapter. For most
people in a retirement account, once again, this is predetermined—you will
buy as much as possible based on your contribution and your employer’s
matching contribution. If you were playing in a poker tournament, then this
position-sizing algorithm is basically “go all-in every time,” which means bet
all your chips every time you play a hand. As the saying goes in poker, “Go-
ing all-in works every time . . . except once.”
Taking 100% risk by “investing” 100% of your cash is insane, especially when
your exit strategy amounts to “Hold on for dear life, whatever happens.” A
sound position-sizing algorithm limits the risk you will take on each position
so that your maximum risk is kept within your tolerances. Did anyone ever
talk to you about maximum expected drawdown when you chose your allo-
cation percentages in your retirement account? No, I didn’t think so.
Position sizing is the part of your trading system that determines two things:
Your likely CAGR
Your likely maximum drawdown
If either of these is important to you, then you better make sure you have a
good understanding of the implications of any particular position-sizing
method, rather than just buying as much as you can.
Exit Strategy
The exit strategy is the set of rules that determine when you will get out of
a position. After position sizing, this component of a trading system is the
most important and basically determines your expectation.
If I said you could toss a fair coin and I would pay you $1 for heads and you
would pay me $2 for tails, then the expectations would be:
Protect Your Wealth from the Ravages of Inflation
83
50% chance of a $1 loss for me
50% chance of a $2 loss for you
My expectations would be:
(Probability of a Win * Win Amount) – (Probability of a Loss * Loss Amount)
Which works out to the following:
(0.5 * $2) – (0.5 * $1) = 1.0 – 0.5 = 0.5
This means that if I played the game with you, I would win 50 cents per turn
on average—a positive expectation for me, and an equal and opposite nega-
tive expectation for you. Whether you’re playing a positive or negative ex-
pectation game with your investment accounts depends primarily on your
exit strategy. What’s your exit strategy in your retirement account? Don’t
have one? You probably do, but it may be along the lines of “Cash out when
I’m 60 years old.” Do such exit rules help you manage risk, keep losing posi-
tions small, let winners grow big, or create a positive expectation? Nope.
And if you’re using periodic portfolio rebalancing, your exit strategy basically
says: “Sell things that have gone up and buy things that have gone down with
the proceeds.”
This is the opposite of what “good” trading looks like: “Let winners run, and
cut losers short.”
Putting It All Together
I’m not going to pretend I can give you a complete trading method for all
major instrument types that you can implement in a few hours a month us-
ing a spreadsheet and some delayed market data. What I can do is show you
a much, much better way of managing your investment accounts than the
typical “buy and hold with periodic rebalancing” that you’re probably cur-
rently using.
I can also show you what your results would have looked like over the last,
say, eight years using this method so you can compare them to the actual
results you have achieved using traditional methods.
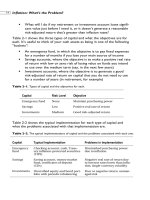
Let me make it clear again that it’s risk-adjusted return depicted by the
MAR ratio that’s important—not simply CAGR. Figure 5-1 shows the base-
line we’re trying to improve upon. You may recognize this chart from Chap-
Step 3: Generate a Good Risk-Adjusted Return on Investments
84
ter 2. If your plan sponsor actually provided you with a chart that showed
actual returns and drawdowns, rather than simply the total value of your
account including your contributions, it would probably look a lot like the
following chart over the last few years. The chart is of a simple annual rebal-
ancing model of a diversified portfolio consisting of equities, bonds, and
emerging markets. The ETFs in the portfolio are:
SPY: SPDR S&P 500 ETF
TLT: iShares Barclays 20+ Year Treasury Bond
EFA: iShares Trust MSCI EAFE Index (Europe, Australasia, and Far
East equities)
The account starts with $100,000 and has a 2% annual fee applied to it.
SPY (50%), TLT (40%), EFA (10%) with Annual Rebalancing,
Starting Value $100,000, 2% Annual Fee, from 08/08/2003 to
07/18/2011, CAGR%=1.45%, Maximum DD=35.14%, MAR=0.041,
Ending Value $115,506 (15.51%)
Aug 03
Nov 03
Feb 04
May 04
Aug 04
Nov 04
Feb 05
May 05
Aug 05
Nov 05
Feb 06
May 06
Aug 06
Nov 06
Feb 07
May 07
Aug 07
Nov 07
Feb 08
May 08
Aug 08
Nov 08
Feb 09
May 09
Aug 09
Nov 09
Feb 10
May 10
Aug 10
Nov 10
Feb 11
May 11
SPY (50%), TLT (40%), EFA (10%) with annual rebalancing High Low
$80,000
$90,000
$100,000
$110,000
$120,000
$130,000
$140,000
$150,000
Figure 5-1. Annual rebalancing of a diversified portfolio, August 2003 to July 2011
Not very impressive, is it? I don’t need to go into how pathetic these results
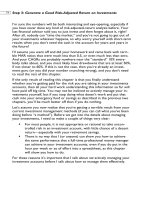
are, because I covered that in Chapter 2. How about Figure 5-2—does this
look a little more like it?
Protect Your Wealth from the Ravages of Inflation
85
Trend Capturing, Starting Value $100,000, 2% Annual Fee, from
08/08/2003 to 07/18/2011, CAGR%=10.51%, Maximum
DD=17.29%, MAR=0.61, Ending Value $215,800 (115.8%)
$90,000
$110,000
$130,000
$150,000
$170,000
$190,000
$210,000
$230,000
Aug 03
Nov 03
Feb 04
May 04
Aug 04
Nov 04
Feb 05
May 05
Aug 05
Nov 05
Feb 06
May 06
Aug 06
Nov 06
Feb 07
May 07
Aug 07
Nov 07
Feb 08
May 08
Aug 08
Nov 08
Feb 09
May 09
Aug 09
Nov 09
Feb 10
May 10
Aug 10
Nov 10
Feb 11
May 11
Trend capturing High Low
Figure 5-2. Trend capturing applied to a diversified portfolio, August 2003 to July 2011,
with 2% annual fee
I’ve included the same 2% annual fee so you can directly compare it to the
previous chart. I would call these results acceptable for an approach that
could be managed on your own using a diversified portfolio of ETFs (includ-
ing some inverse ETFs) and a spreadsheet with delayed market data. The ap-
proach attempts to capture trends in price as, and when, they occur, and
does not use any kind of periodic rebalancing.
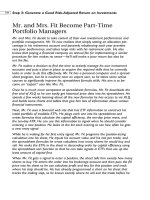
Figure 5-3 shows the same method with no annual fee, which would repre-
sent the kind of results that could be achieved if you do it yourself. If the re-
sults with the 2% annual fee look good to you, and you just can’t be both-
ered to do the hard work to manage an account yourself for the kind of im-
provement that’s possible, then just get in touch with me and I will refer
you to a financial advisor I know. This financial advisor is implementing a
version of the method I describe in detail later in this chapter, and currently
takes accounts of at least $100,000 but only charges a small annual fee based
on total assets.
4
4
I currently receive no compensation for such referrals.
Step 3: Generate a Good Risk-Adjusted Return on Investments
86
Trend Capturing, starting value $100,000, No Annual Fee, from
08/08/2003 to 07/18/2011, CAGR%=11.78%, Maximum
DD=17.04%, MAR=0.691, Ending Value $235,714 (135.71%)
Aug 03
Nov 03
Feb 04
May 04
Aug 04
Nov 04
Feb 05
May 05
Aug 05
Nov 05
Feb 06
May 06
Aug 06
Nov 06
Feb 07
May 07
Aug 07
Nov 07
Feb 08
May 08
Aug 08
Nov 08
Feb 09
May 09
Aug 09
Nov 09
Feb 10
May 10
Aug 10
Nov 10
Feb 11
May 11
Trend capturing High Low
$90,000
$110,000
$130,000
$150,000
$170,000
$190,000
$210,000
$230,000
$250,000
Figure 5-3. Trend capturing applied to a diversified portfolio, August 2003 to July 2011,
with no annual fee
As you can see from the last chart, doing it yourself (assuming you don’t
mess up, of course), your account balance would be just about $20,000 big-
ger at the end of the period.
A Simplified Trend-Capturing Method
Now that I’ve gotten your interest with what I consider to be good results,
it’s time to give you a few warnings:
Achieving these results requires accurate and consistent imple-
mentation of the trading method. No skipping a trade you don’t
like, no sizing a trade twice as big because it’s going to be a huge
winner, and no taking a six-month vacation and forgetting to look
at your account. If you can’t accurately and consistently imple-
ment the method, then don’t bother—you’ll end up worse off
than using FARCE.
The methods presented here require more time and effort than
most normal people are willing to spend managing their invest-
ment accounts.
Protect Your Wealth from the Ravages of Inflation
87
There is no guarantee that future results will look exactly like the
past results. However, there is a much better chance of future
results being acceptable compared to FARCE in my opinion, so
it’s worth the risk.
The method I describe next is a simplified version of what I and other pro-
fessional traders use that is easier to manage while still providing good re-
sults. The results for this version are shown in Figure 5-4.
$90,000
$110,000
$130,000
$150,000
$170,000
$190,000
$210,000
$230,000
$250,000
Aug 03
Nov 03
Feb 04
May 04
Aug 04
Nov 04
Feb 05
May 05
Aug 05
Nov 05
Feb 06
May 06
Aug 06
Nov 06
Feb 07
May 07
Aug 07
Nov 07
Feb 08
May 08
Aug 08
Nov 08
Feb 09
May 09
Aug 09
Nov 09
Feb 10
May 10
Aug 10
Nov 10
Feb 11
May 11
Simplified trend capturing High Low
Simplified Trend Capturing, Starting Value $100,000, No Annual
Fee, from 08/08/2003 to 07/18/2011, CAGR%=10.67%, Maximum
DD=20.63%, MAR=0.517, Ending Value $217,907 (117.91%)
Figure 5-4. Simplified trend capturing applied to a diversified portfolio, August 2003 to July
2011, with no annual fee
As you can see, the CAGR is lower and the max DD is higher, but that is
the price one pays for using a method that is simple to implement and
doesn’t require full-time babysitting.
So, with that out of the way, let me tell you the exact rules you can use to
implement the simplified trend-capturing method yourself.
Step 3: Generate a Good Risk-Adjusted Return on Investments
88
Market Selection
Plan to buy US ETFs listed on the NYSE and AMEX.
Most people are familiar with equities (stocks), but investing in individual
companies has some drawbacks—the price can be very volatile, and if the
company gets into trouble, the shareholders are the last in line to get any
cash back. Anyone remember Enron or Worldcom? In fact, of the 12 com-
panies on the original Dow Jones Industrial Average, only 1 still exists today
(General Electric).
For this reason, it’s better to invest in ETFs that represent ownership of a
collection of underlying instruments rather than a single company, so you
get “built-in” diversification. Another advantage is that ETFs trade just like
equities (they are priced in real time and trade on regular exchanges), so
they are easy to buy or sell in any regular brokerage account.
Instrument Filter
Rank the top 50 ETFs by dollar volume traded and choose a noncorrelated
list from this set that includes some inverse funds. Noncorrelated in this
case means that the holdings of each ETF should not have much overlap and
should not be based on a similar index, industry, or sector.
Inverse funds are ETFs that are designed to move in the opposite direction
to some other fund or index so they can be used to simulate going short in
an account where selling short is not allowed.
5
This means that you can
benefit from uptrends as well as downtrends, rather than only being able to
make money when things are going up in price.
There are many web sites that can list and rank ETFs quickly and easily. I
like to use the ETF Center in Yahoo! Finance, but any source that can be
easily loaded into your spreadsheet program so you can sort it will work.
Table 5.1 shows a list of ETFs ranked by descending average daily volume.
5
Going short, or “shorting,” is a trading technique in which you borrow securities from your
broker, sell them, and receive the proceeds. Then you have to buy back the securities at some
point in the future in order to return them to your broker. In this way, you can benefit from a
drop in price if you are able to buy the securities back for less than you received when you sold
them. Shorting of securities is not allowed in US retirement accounts.