Signal processing Part 17 pot
Bạn đang xem bản rút gọn của tài liệu. Xem và tải ngay bản đầy đủ của tài liệu tại đây (4.03 MB, 30 trang )
SignalProcessing474
premises and since phase-locking provides a measure that is sufficient to conclude if two
brain regions interact, another measure of phase synchronization, the PLV, has been
introduced, offering, thus, an alternative measure only based on the detection of phase
covariance (Lachaux et al., 1999; Le Van Quyen et al., 2001; Tass et al., 1998).
Before computing the PLV, the frequency bands and sub-bands of interest mentioned in
Section 2.2.2 are extracted for each subject and each single-trial by means of a filter bank
using band-pass FIR (Lachaux et al., 1999) or IIR filters (Brunner et al., 2006).
Then, the PLV can be computed for each frequency band. Contrary to the classical
coherence, it is defined by only considering the phases of the two signals.
j
ePLV
(15)
where
denotes the phase difference between the two signals
)(ts
x
and
)(ts
y
(i.e.,
=
yx
).
It must be noted that equations (14) and (15) are comparable; however, the equation
expressing the PLV does not include the amplitudes of the two signals, allowing
examination of synchronization phenomena in EEG/MEG signals by directly capturing the
phase synchronization.
Two methods to compute the phases
x
and
y
are available. The first one (Lachaux et al.,
1999) uses a complex Gabor wavelet as defined by equation (16):
ftja
eeftG
2
),(
(16)
Where a=
2
2
2
t
t
, t represents the time and
is the standard deviation of the Gaussian
envelope.
The second method (Tass et al., 1998) uses the Hilbert transform as defined by the following
equation:
d
t
ts
PVts
x
x
)(
1
)(
~
(17)
In this definition,
)(
~
ts
x
is the Hilbert transform of the time series
)(ts
x
(in our case an
EEG/MEG signal), and PV indicates that the integral is taken in the sense of Cauchy
principal value. The instantaneous phase can then be calculated as:
)(
)(
~
arctan)(
ts
ts
t
x
x
x
(18)
It must be noted that these two methods provide very similar results when applied to EEG
data (Le Van Quyen et al., 2001).
The averaging process can be performed either over time (i.e., in equation (19), n [1…N],
where n is the sample number of the time series) for single-trial applications such as BCI
approaches (Brunner et al., 2006; Lachaux et al., 2000) or over trials (Lachaux et al., 1999)
(i.e., in equation (19), n
[1…N], where n is the trial number). Thus, equation (19) is
obtained:
N
i
ntj
e
N
PLV
1
),(
1
(19)
where
),( nt
is the phase difference and
),( nt
=
),(),( ntnt
yx
.
As for the coherence, the PLV is ranged from 0 to 1 indicating that during this time window
the two channels considered are ranged from unsynchronized to perfectly synchronized,
respectively. It must be noted that, despite the previously mentioned advantages of the PLV,
it has been also suggested that one reason to use coherence rather than the PLV directly is
that coherence measures are weighted in favor of epochs with large amplitudes. In
particular, more consistent phase estimates will be probably obtained when amplitudes are
large (if large amplitudes show a large signal-to-noise ratio as is generally the case in
EEG/MEG) (Nunez & Srinivasan, 2006). Therefore, both coherence and PLV measures can
be used. Interestingly, due to their unique advantages and pitfalls, some studies apply and
compare both techniques that, in the case of convergence, lead to robust results, although in
the case of EEG both approaches are subject to the electrode reference problem that can
distort such measurements (Nunez & Srinivasan, 2006). Recently, Darvas et al., (2009) have
proposed an extension of the PLV, called bi-PLV that is specifically sensitive to non-linear
interactions providing, thus, robustness behavior to spurious synchronization arising from
linear crosstalk. This property is particularly useful when analyzing data recorded by EEG
or MEG. From a physiological point of view, both coherence and PLV methods quantify the
magnitude of correlation, for a given frequency (or band), between different areas of the
cerebral cortex. Thus, high coherence and/or PLV implies substantial communication
between different cortical areas while low coherence and/or PLV reflects regional
autonomy or independence (Nunez & Srinivasan, 2006).
3 Non-Invasive Functional Brain Biomarkers of Human Sensorimotor
Performance:
Although the signal processing approaches described above are applicable to both EEG and
MEG signals, we will focus mainly on brain biomarkers derived from EEG since, as
mentioned in the introduction, this technique is portable and therefore is particularly well
suited for ecological motor tasks such as aiming (e.g., marksmanship, archery), drawing,
arm reaching and grasping task. Therefore, most of the examples below will present the
results of brain biomarkers derived from EEG signals.
Signalprocessingfornon-invasivebrain
biomarkersofsensorimotorperformanceandbrainmonitoring 475
premises and since phase-locking provides a measure that is sufficient to conclude if two
brain regions interact, another measure of phase synchronization, the PLV, has been
introduced, offering, thus, an alternative measure only based on the detection of phase
covariance (Lachaux et al., 1999; Le Van Quyen et al., 2001; Tass et al., 1998).
Before computing the PLV, the frequency bands and sub-bands of interest mentioned in
Section 2.2.2 are extracted for each subject and each single-trial by means of a filter bank
using band-pass FIR (Lachaux et al., 1999) or IIR filters (Brunner et al., 2006).
Then, the PLV can be computed for each frequency band. Contrary to the classical
coherence, it is defined by only considering the phases of the two signals.
j
ePLV
(15)
where
denotes the phase difference between the two signals
)(ts
x
and
)(ts
y
(i.e.,
=
yx
).
It must be noted that equations (14) and (15) are comparable; however, the equation
expressing the PLV does not include the amplitudes of the two signals, allowing
examination of synchronization phenomena in EEG/MEG signals by directly capturing the
phase synchronization.
Two methods to compute the phases
x
and
y
are available. The first one (Lachaux et al.,
1999) uses a complex Gabor wavelet as defined by equation (16):
ftja
eeftG
2
),(
(16)
Where a=
2
2
2
t
t
, t represents the time and
is the standard deviation of the Gaussian
envelope.
The second method (Tass et al., 1998) uses the Hilbert transform as defined by the following
equation:
d
t
ts
PVts
x
x
)(
1
)(
~
(17)
In this definition,
)(
~
ts
x
is the Hilbert transform of the time series
)(ts
x
(in our case an
EEG/MEG signal), and PV indicates that the integral is taken in the sense of Cauchy
principal value. The instantaneous phase can then be calculated as:
)(
)(
~
arctan)(
ts
ts
t
x
x
x
(18)
It must be noted that these two methods provide very similar results when applied to EEG
data (Le Van Quyen et al., 2001).
The averaging process can be performed either over time (i.e., in equation (19), n [1…N],
where n is the sample number of the time series) for single-trial applications such as BCI
approaches (Brunner et al., 2006; Lachaux et al., 2000) or over trials (Lachaux et al., 1999)
(i.e., in equation (19), n
[1…N], where n is the trial number). Thus, equation (19) is
obtained:
N
i
ntj
e
N
PLV
1
),(
1
(19)
where
),( nt
is the phase difference and
),( nt
=
),(),( ntnt
yx
.
As for the coherence, the PLV is ranged from 0 to 1 indicating that during this time window
the two channels considered are ranged from unsynchronized to perfectly synchronized,
respectively. It must be noted that, despite the previously mentioned advantages of the PLV,
it has been also suggested that one reason to use coherence rather than the PLV directly is
that coherence measures are weighted in favor of epochs with large amplitudes. In
particular, more consistent phase estimates will be probably obtained when amplitudes are
large (if large amplitudes show a large signal-to-noise ratio as is generally the case in
EEG/MEG) (Nunez & Srinivasan, 2006). Therefore, both coherence and PLV measures can
be used. Interestingly, due to their unique advantages and pitfalls, some studies apply and
compare both techniques that, in the case of convergence, lead to robust results, although in
the case of EEG both approaches are subject to the electrode reference problem that can
distort such measurements (Nunez & Srinivasan, 2006). Recently, Darvas et al., (2009) have
proposed an extension of the PLV, called bi-PLV that is specifically sensitive to non-linear
interactions providing, thus, robustness behavior to spurious synchronization arising from
linear crosstalk. This property is particularly useful when analyzing data recorded by EEG
or MEG. From a physiological point of view, both coherence and PLV methods quantify the
magnitude of correlation, for a given frequency (or band), between different areas of the
cerebral cortex. Thus, high coherence and/or PLV implies substantial communication
between different cortical areas while low coherence and/or PLV reflects regional
autonomy or independence (Nunez & Srinivasan, 2006).
3 Non-Invasive Functional Brain Biomarkers of Human Sensorimotor
Performance:
Although the signal processing approaches described above are applicable to both EEG and
MEG signals, we will focus mainly on brain biomarkers derived from EEG since, as
mentioned in the introduction, this technique is portable and therefore is particularly well
suited for ecological motor tasks such as aiming (e.g., marksmanship, archery), drawing,
arm reaching and grasping task. Therefore, most of the examples below will present the
results of brain biomarkers derived from EEG signals.
SignalProcessing476
3.1 Spectral power
A series of studies that began in the early 80's provided a growing body of evidence that it is
possible to assess the cortical dynamics of motor skills in novice and expert performers
during visuomotor challenge such as marksmanship and archery tasks. These studies
revealed changes in EEG activity with skill learning as well as differences in EEG power
between novice and expert sport performers (Del Percio et al., 2008; Hatfield et al., 1984,
2004; Haufler et al., 2000; Kerick et al., 2004; Landers et al., 1994; Slobounov et al., 2007).
Specifically, the power computed for the alpha and theta frequency bands were positively
related to the level of motor performance (Del Percio et al., 2008; Hatfield et al., 2004;
Haufler et al., 2000; Kerick et al., 2004).
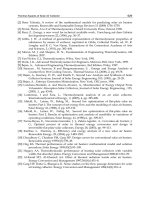
Fig. 4. Mean EEG power (mV
2
) spectra (1–44 Hz) at left and right homologous sites in the
frontal and temporal regions during the aiming period of the shooting task for expert
marksmen versus novice shooters (Adapted from Haufler et al., (2000) with permission from
Elsevier Science).
For instance, Haufler et al., (2000) showed that, compared to novices, experts revealed an
overall increase in EEG alpha power in the left temporal lobe (i.e., T3) while the same
comparison between novices and experts performing cognitive tasks that were equally
familiar to them did not provide any differences. The authors concluded, therefore, that the
EEG alpha power differences observed were likely due to the difference of level in mastery
of the motor task (see Fig. 4). Obviously, the differences in cortical dynamic between novices
and experts revealed by these studies were accompanied with important differences
between performances (i.e., the novices scored lower and exhibited more variability in their
performance than the experts). Thus, these studies provided brain biomarkers (e.g., alpha
power) able to identify a high level of motor performance resulting from an extensive
practice period, without, however, considering the changes of such brain biomarker
throughout the training period itself.
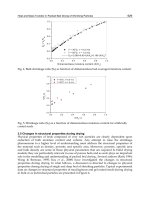
Interestingly, in a more recent study Kerick et al., (2004) extended these investigations by
assessing the dynamic changes throughout a marksmanship intensive training for novices
during three months. The results revealed that, throughout the training, the performance for
the shooting task was enhanced (Fig. 5A) concomitantly with an increased EEG alpha power
(Fig. 5B) at the temporal level located on the contralateral side (i.e., T3, left temporal lobe)
while such observation was not observed when the subjects were at rest. Such EEG changes
are generally interpreted as indicative of high levels of skill and associated with a cortical
refinement leading to reductions of nonessential cortical resources (Hatfield & Hillman,
2001). This kind of neural adaptation process may result in simplification of neurocognitive
activity and less possibility of interference with essential visuomotor processes. Within an
activation context, a decrease in alpha power frequency band (i.e., desynchronization)
represents an activated cortical site. Conversely, an increase in alpha power (i.e.,
synchronization) corresponds to a reduction of activation of a given cortical region
(Pfurtscheller et al., 1996) indicating a decrease of the recruitment of neural resources.
In addition to the alpha frequency band, several studies suggested that theta oscillations are
also related to performance enhancement (Caplan et al., 2003; Tombini et al., 2009). For
instance, during a virtual maze navigation task, Caplan et al., (2003) observed that theta
oscillations reflected an updating of motor plans in response to incoming sensory
information that facilitates the information encoding of participant’s cognitive map.
Fig. 5. A. Shooting percentages by practice session. The slope of the linear regression
revealed a significant increase in performance over all practice sessions from time 1 to 3
(equation lower right corner). The different symbols represent the performance scores of
individual participants on separate days of practice. B. Changes in mean power from time 1
to 3 during shooting (SH), postural (PS), and Baseline (BL) condition (T3, left panel; T4, right
panel). (Adapted from Kerick et al., (2004) with permission from Wolters
Kluwer/Lippincott Williams).
Although other interpretations of theta power increases are plausible (e.g., frontal theta EEG
synchronization could also reflect an increased short term memory load; for a review see
Klimesch et al., 2008), a growing body of work suggest that theta oscillations are
functionally associated with error monitoring (Cavanagh et al., 2009; Larson & Lynch, 1989;
Smith et al., 1999; Yordanova et al., 2004).
Thus, taken together these studies suggested that changes in alpha and theta power can be
used as non-invasive functional brain biomarkers capable either to assess the level of
mastery of a given sensori-motor task (e.g., marksmanship task) and/or to track the brain
status during motor practice. However, these studies used visuomotor task where upper
limb movements were extremely specific (e.g., archery, marksmanship task) without
considering more familiar movements used in daily activities such as arm reaching,
grasping and tool or object manipulations. Moreover, these investigations addressed the
improvement of an established motor ability (e.g., Haulfer et al., 2000), or a long learning
period of a skill involving no interference with previous motor experience (e.g., Caplan et
al., 2003; Kerick et al., 2004). Interestingly, Kranczioch et al., (2008) showed that the learning
of a visuomotor power grip tool led to EEG changes in spectral power and cortico-cortical
coupling (i.e., coherence). However, this study did not involve a tool that required
Signalprocessingfornon-invasivebrain
biomarkersofsensorimotorperformanceandbrainmonitoring 477
3.1 Spectral power
A series of studies that began in the early 80's provided a growing body of evidence that it is
possible to assess the cortical dynamics of motor skills in novice and expert performers
during visuomotor challenge such as marksmanship and archery tasks. These studies
revealed changes in EEG activity with skill learning as well as differences in EEG power
between novice and expert sport performers (Del Percio et al., 2008; Hatfield et al., 1984,
2004; Haufler et al., 2000; Kerick et al., 2004; Landers et al., 1994; Slobounov et al., 2007).
Specifically, the power computed for the alpha and theta frequency bands were positively
related to the level of motor performance (Del Percio et al., 2008; Hatfield et al., 2004;
Haufler et al., 2000; Kerick et al., 2004).
Fig. 4. Mean EEG power (mV
2
) spectra (1–44 Hz) at left and right homologous sites in the
frontal and temporal regions during the aiming period of the shooting task for expert
marksmen versus novice shooters (Adapted from Haufler et al., (2000) with permission from
Elsevier Science).
For instance, Haufler et al., (2000) showed that, compared to novices, experts revealed an
overall increase in EEG alpha power in the left temporal lobe (i.e., T3) while the same
comparison between novices and experts performing cognitive tasks that were equally
familiar to them did not provide any differences. The authors concluded, therefore, that the
EEG alpha power differences observed were likely due to the difference of level in mastery
of the motor task (see Fig. 4). Obviously, the differences in cortical dynamic between novices
and experts revealed by these studies were accompanied with important differences
between performances (i.e., the novices scored lower and exhibited more variability in their
performance than the experts). Thus, these studies provided brain biomarkers (e.g., alpha
power) able to identify a high level of motor performance resulting from an extensive
practice period, without, however, considering the changes of such brain biomarker
throughout the training period itself.
Interestingly, in a more recent study Kerick et al., (2004) extended these investigations by
assessing the dynamic changes throughout a marksmanship intensive training for novices
during three months. The results revealed that, throughout the training, the performance for
the shooting task was enhanced (Fig. 5A) concomitantly with an increased EEG alpha power
(Fig. 5B) at the temporal level located on the contralateral side (i.e., T3, left temporal lobe)
while such observation was not observed when the subjects were at rest. Such EEG changes
are generally interpreted as indicative of high levels of skill and associated with a cortical
refinement leading to reductions of nonessential cortical resources (Hatfield & Hillman,
2001). This kind of neural adaptation process may result in simplification of neurocognitive
activity and less possibility of interference with essential visuomotor processes. Within an
activation context, a decrease in alpha power frequency band (i.e., desynchronization)
represents an activated cortical site. Conversely, an increase in alpha power (i.e.,
synchronization) corresponds to a reduction of activation of a given cortical region
(Pfurtscheller et al., 1996) indicating a decrease of the recruitment of neural resources.
In addition to the alpha frequency band, several studies suggested that theta oscillations are
also related to performance enhancement (Caplan et al., 2003; Tombini et al., 2009). For
instance, during a virtual maze navigation task, Caplan et al., (2003) observed that theta
oscillations reflected an updating of motor plans in response to incoming sensory
information that facilitates the information encoding of participant’s cognitive map.
Fig. 5. A. Shooting percentages by practice session. The slope of the linear regression
revealed a significant increase in performance over all practice sessions from time 1 to 3
(equation lower right corner). The different symbols represent the performance scores of
individual participants on separate days of practice. B. Changes in mean power from time 1
to 3 during shooting (SH), postural (PS), and Baseline (BL) condition (T3, left panel; T4, right
panel). (Adapted from Kerick et al., (2004) with permission from Wolters
Kluwer/Lippincott Williams).
Although other interpretations of theta power increases are plausible (e.g., frontal theta EEG
synchronization could also reflect an increased short term memory load; for a review see
Klimesch et al., 2008), a growing body of work suggest that theta oscillations are
functionally associated with error monitoring (Cavanagh et al., 2009; Larson & Lynch, 1989;
Smith et al., 1999; Yordanova et al., 2004).
Thus, taken together these studies suggested that changes in alpha and theta power can be
used as non-invasive functional brain biomarkers capable either to assess the level of
mastery of a given sensori-motor task (e.g., marksmanship task) and/or to track the brain
status during motor practice. However, these studies used visuomotor task where upper
limb movements were extremely specific (e.g., archery, marksmanship task) without
considering more familiar movements used in daily activities such as arm reaching,
grasping and tool or object manipulations. Moreover, these investigations addressed the
improvement of an established motor ability (e.g., Haulfer et al., 2000), or a long learning
period of a skill involving no interference with previous motor experience (e.g., Caplan et
al., 2003; Kerick et al., 2004). Interestingly, Kranczioch et al., (2008) showed that the learning
of a visuomotor power grip tool led to EEG changes in spectral power and cortico-cortical
coupling (i.e., coherence). However, this study did not involve a tool that required
SignalProcessing478
suppression of a familiar response. Nevertheless, in daily activities, we frequently need to
adapt our motor commands related to our upper limb to learn new input-output mappings
characterizing novel tools by inhibiting familiar behavior or responses that are no longer
valid to manipulate them. Such tool learning requires the selection and guidance of
movements based on visual and proprioceptive inputs while frontal executive function
would inhibit the pre-potent input-output relationships during acquisition of the internal
model (also called internal representation) of the new tool. This would be typically the case
if a person has to learn to manipulate a new tool such as a neuroprosthetic. It should be
noted that Anguera et al., (2009) used a visuomotor adaptation task requiring suppression of
preexisting motor responses in order to quantify the changes in error-related negativity
associated with the magnitude of the error. However, this study did not focus on tracking
the learning process by using brain biomarkers derived from spectral power and/or phase
synchronization.
Based on this rational, a recent study (Gentili et al., 2008) intended to address this problem
by analyzing the cortical dynamics during the learning of a new tool having unknown
kinematics features. In this experiment, fifteen right-handed healthy adults subjects sat at a
table facing a computer screen and, with their right hand, had to perform “centre-out”
drawing movements (on a digitizing tablet) linking a central target and one of four
peripheral targets. Movement paths were displayed on the screen, but a horizontal board
prevented any vision of the moving limb on the tablet. EEG signals were acquired using an
electro-cap with 64 tin electrodes, which was fitted to the participant’s head in accordance
with the standards of the extended International 10-20 system (Fig.6). First, the subjects
performed 20 practice trials at the beginning of the experiment in order to be familiarized
with the experimental setup. After this familiarization period, the experiment was divided
into three sessions: i) pre-exposure, ii) exposure and iii) post-exposure. During the pre- and
post-exposure phases the subjects performed, under normal visual conditions, 20 trials (i.e.,
1 block). During the exposure phase, (180 trials, i.e., 20 trials x 9 blocks) ten subjects (i.e.,
learning croup) had to adapt to a 60º counter clock-wise screen cursor rotation. In addition,
five healthy (i.e., control group) subjects were examined using the same protocol but in the
absence of any visual distortion. Movements were self-initiated and targets were self-
selected one at a time. All the targets were displayed throughout each trial. The instructions
were to draw a line as straight and as fast as possible linking the home target and the
peripheral target. Unknown to the participants, a trial was aborted and restarted if the time
between entering the home target and movement onset was less than 2s. Therefore,
participants had enough time to both select the target and plan their movement providing,
thus, an extended time-window to analyze cortical activations related to preparation
processes (i.e., planning) of the movement.
In order to quantify the motor performance during both movement planning and movement
execution periods, the Movement Time (MT), Movement Length (ML) and Root Mean
Square of the Error (RMSE) were computed from the 2D horizontal displacements. The MT
was defined as the elapsed time between leaving the home circle and entering the target.
The ML was defined as the distance traveled in each trial.
Fig. 6. Experimental device to record kinematics and EEG signals during the visuomotor
adaptation task. Subjects sat at a table facing a computer screen located in front of them at a
distance of ~60 cm and had to execute the motor task which consisted of drawing a line on a
digitizing tablet (represented in light blue on the figure) that was displayed in real-time on
the computer screen. The home target circle was the origin of a direct polar frame of
reference, and the target circles were positioned 10 cm from the origin disposed at 45°, 135°,
225°, and 315°. Once a successful trial was performed, to prevent any feedback, all visual
stimuli were erased from the screen in preparation for the next trial.
The RMSE was computed to assess the average deviation between the movement trajectory
from the ‘ideal’ straight line connecting the home and the pointing target. For the nine
learning blocks, the mean and standard deviation of the ML and MT were computed. In
order to take into account any differences in subject’s performance during the pre-exposure
phase (i.e., baseline condition) and to focus on changes due solely to adaptation, the MT, ML
and RMSE values were standardized with respect to the pre-exposure stage.
Continuous EEG data were epoched in 2-s windows centered at movement onset. Both pre-
(i.e., planning) and post- (i.e., execution) movement time-windows were considered. Single-
trial data were detrended to remove DC amplifier drift, low-pass filtered to suppress line
noise, and baseline-corrected by averaging the mean potential from -1 to 1 s. The EEG
signals were cleaned by means of the ICA Infomax method appliedonasingle‐trialbasis
described in section 2.1.1. For each subject and each single-trial, the EEG power (ERS/ERD)
were computed by squaring and integrating the output of a dual band-pass Butterworth
fourth order filter, and standardized with respect to the pre-exposure stage. The EEG power
was computed for the alpha (low: 8-10 Hz, high: 11-13 Hz), beta (low: 13-20 Hz, high: 21-35
Hz); theta (Low: 4-5 Hz, High: 6-7 Hz) and γ (36-44 Hz) bands. The entire alpha, beta and
theta frequency bands were also analyzed. For the alpha band, two similar frequency ranges
have been considered. i) alpha1: spread form 8 to 13Hz, and ii) alpha2: spreads from 9 to 13
Hz. For each sensor and each block, the average power changes (across subjects) were fitted
using a linear model from which the coefficient of determination (R
2
) and its slope were
Signalprocessingfornon-invasivebrain
biomarkersofsensorimotorperformanceandbrainmonitoring 479
suppression of a familiar response. Nevertheless, in daily activities, we frequently need to
adapt our motor commands related to our upper limb to learn new input-output mappings
characterizing novel tools by inhibiting familiar behavior or responses that are no longer
valid to manipulate them. Such tool learning requires the selection and guidance of
movements based on visual and proprioceptive inputs while frontal executive function
would inhibit the pre-potent input-output relationships during acquisition of the internal
model (also called internal representation) of the new tool. This would be typically the case
if a person has to learn to manipulate a new tool such as a neuroprosthetic. It should be
noted that Anguera et al., (2009) used a visuomotor adaptation task requiring suppression of
preexisting motor responses in order to quantify the changes in error-related negativity
associated with the magnitude of the error. However, this study did not focus on tracking
the learning process by using brain biomarkers derived from spectral power and/or phase
synchronization.
Based on this rational, a recent study (Gentili et al., 2008) intended to address this problem
by analyzing the cortical dynamics during the learning of a new tool having unknown
kinematics features. In this experiment, fifteen right-handed healthy adults subjects sat at a
table facing a computer screen and, with their right hand, had to perform “centre-out”
drawing movements (on a digitizing tablet) linking a central target and one of four
peripheral targets. Movement paths were displayed on the screen, but a horizontal board
prevented any vision of the moving limb on the tablet. EEG signals were acquired using an
electro-cap with 64 tin electrodes, which was fitted to the participant’s head in accordance
with the standards of the extended International 10-20 system (Fig.6). First, the subjects
performed 20 practice trials at the beginning of the experiment in order to be familiarized
with the experimental setup. After this familiarization period, the experiment was divided
into three sessions: i) pre-exposure, ii) exposure and iii) post-exposure. During the pre- and
post-exposure phases the subjects performed, under normal visual conditions, 20 trials (i.e.,
1 block). During the exposure phase, (180 trials, i.e., 20 trials x 9 blocks) ten subjects (i.e.,
learning croup) had to adapt to a 60º counter clock-wise screen cursor rotation. In addition,
five healthy (i.e., control group) subjects were examined using the same protocol but in the
absence of any visual distortion. Movements were self-initiated and targets were self-
selected one at a time. All the targets were displayed throughout each trial. The instructions
were to draw a line as straight and as fast as possible linking the home target and the
peripheral target. Unknown to the participants, a trial was aborted and restarted if the time
between entering the home target and movement onset was less than 2s. Therefore,
participants had enough time to both select the target and plan their movement providing,
thus, an extended time-window to analyze cortical activations related to preparation
processes (i.e., planning) of the movement.
In order to quantify the motor performance during both movement planning and movement
execution periods, the Movement Time (MT), Movement Length (ML) and Root Mean
Square of the Error (RMSE) were computed from the 2D horizontal displacements. The MT
was defined as the elapsed time between leaving the home circle and entering the target.
The ML was defined as the distance traveled in each trial.
Fig. 6. Experimental device to record kinematics and EEG signals during the visuomotor
adaptation task. Subjects sat at a table facing a computer screen located in front of them at a
distance of ~60 cm and had to execute the motor task which consisted of drawing a line on a
digitizing tablet (represented in light blue on the figure) that was displayed in real-time on
the computer screen. The home target circle was the origin of a direct polar frame of
reference, and the target circles were positioned 10 cm from the origin disposed at 45°, 135°,
225°, and 315°. Once a successful trial was performed, to prevent any feedback, all visual
stimuli were erased from the screen in preparation for the next trial.
The RMSE was computed to assess the average deviation between the movement trajectory
from the ‘ideal’ straight line connecting the home and the pointing target. For the nine
learning blocks, the mean and standard deviation of the ML and MT were computed. In
order to take into account any differences in subject’s performance during the pre-exposure
phase (i.e., baseline condition) and to focus on changes due solely to adaptation, the MT, ML
and RMSE values were standardized with respect to the pre-exposure stage.
Continuous EEG data were epoched in 2-s windows centered at movement onset. Both pre-
(i.e., planning) and post- (i.e., execution) movement time-windows were considered. Single-
trial data were detrended to remove DC amplifier drift, low-pass filtered to suppress line
noise, and baseline-corrected by averaging the mean potential from -1 to 1 s. The EEG
signals were cleaned by means of the ICA Infomax method appliedonasingle‐trialbasis
described in section 2.1.1. For each subject and each single-trial, the EEG power (ERS/ERD)
were computed by squaring and integrating the output of a dual band-pass Butterworth
fourth order filter, and standardized with respect to the pre-exposure stage. The EEG power
was computed for the alpha (low: 8-10 Hz, high: 11-13 Hz), beta (low: 13-20 Hz, high: 21-35
Hz); theta (Low: 4-5 Hz, High: 6-7 Hz) and γ (36-44 Hz) bands. The entire alpha, beta and
theta frequency bands were also analyzed. For the alpha band, two similar frequency ranges
have been considered. i) alpha1: spread form 8 to 13Hz, and ii) alpha2: spreads from 9 to 13
Hz. For each sensor and each block, the average power changes (across subjects) were fitted
using a linear model from which the coefficient of determination (R
2
) and its slope were
SignalProcessing480
obtained. The sensors that showed a fit indicating a coefficient of determination capable to
explain at least 50% of the variability of the data (i.e., R
2
≥0.50) allowed us to determine the
sensor clusters and the frequency bands of interest. The results of this procedure led us to
consider the two alpha frequency bands and the high component of the theta frequency
band for the right (FT8, T8, TP8) and left (FT7, T7, TP7) temporal and right (FP2, AF4, F4, F6,
F8) and left (FP1, AF3, F3, F5, F7,) frontal lobes. This procedure led us also to consider the
two alpha frequency bands for the left (P1, P3, P5, P7, PO3, PO5, PO7) and right (P2, P4, P6,
P8, PO4, PO6, PO8) parietal and left (O1) and right (O2) occipital regions (For the electrodes
sites see Fig. 6). It must be noted that the results for both alpha bands were similar.
However, since the findings for the second alpha band (i.e., [9-13Hz]) were slightly better
only this frequency band will be presented and discussed. For the alpha (i.e., [9-13Hz]) and
high theta (i.e., [6-7Hz]) bands and the eight clusters of interest, the average power values
were computed, and the same fitting process was applied. Furthermore, in order to
investigate any correlation between the kinematics data and the EEG power, the average
EEG power values obtained for the clusters of interest were plotted versus the MT, ML and
RMSE values. Exponential (single and double), linear and quadratic models were used to fit
these relationships. The best fit was selected by considering the coefficient of determination
and its adjusted value, the mean square error of the fit, and the sum of squares due to the
fitting error.
The results showed that, during the early learning phase, the subjects performed distorted
movement trajectories with a slow progression towards the targets. However, as the subjects
of the learning group learned the unknown physical (kinematics) properties of the novel
tool, the analysis of the motor performance revealed that the MT, ML and RMSE decreased
throughout adaptation (Fig. 7A-C). From the early to the late learning period, the trajectories
were straighter and smoother while the control group did not show any performance
improvement (Fig. 7A-C).
Fig. 7. Concomitant EEG and kinematic changes throughout learning for the learning and
control groups. (A) Changes in MT (±SE) throughout the learning blocks. (B) Changes in ML
(±SE) (purple) and RMSE (±SE) (blue) throughout the learning blocks. (C) Changes in
average trajectory (thick black lines) throughout learning for early, middle and late exposure
(the grey area represents the standard error across subjects). (D) Qualitative EEG changes in
alpha (first and third row) and high theta (second and fourth row) frequency bands for the
frontal, temporal, parietal and occipital regions during planning (two first rows) and
execution (two last rows). For the sake of clarity, sensors which did not belong to the
clusters of interest were set to the minimal value of the scale for the scalp plot. The results of
the learning group and control group are represented in the left and right column,
respectively. (Adapted from Gentili et al., (2008) with permission from EURASIP).
Simultaneously to these behavioral changes, the results revealed that, as the subject adapt,
the alpha and the high component of the theta power increased in the frontal and temporal
lobes whereas an increased in alpha power also took place in the parietal lobes. Moreover,
these spectral changes occurred during both movement planning (i.e., movement
preparation) and movement execution. It must be noted that this alpha frequency band
spread form 9 to 13Hz showed the largest reactivity during the adaptation to the novel tool
and thus provides a better brain biomarker. Contrary to the learning group, the control
group did not exhibit any changes in spectral power (Fig. 7D).
Fig. 8. Linear fits of EEG power changes for the frontal and temporal clusters for the
participants of the learning group. Standardized values of the average EEG power
computed across subjects (n=10) of the learning group and blocks (n=9) for the alpha and
the high theta frequency bands recorded from the right (FT8, T8, TP8) and left (FT7, T7, TP7)
temporal lobes and right (FP2, AF4, F4, F6, F8) and left (FP1, AF3, F3, F5, F7) frontal lobes.
The blue and red stars indicate that the slopes were significantly different from zero for
planning and execution, respectively. The black star indicates that the slopes between
planning and execution were significantly different. The two bars on the right side of each
panel represent the average value of the EEG power for the same cortical sites and the same
frequency band for planning (blue) and execution (red) of the control group. (Adapted from
Gentili et al., (2008) with permission from EURASIP).
Signalprocessingfornon-invasivebrain
biomarkersofsensorimotorperformanceandbrainmonitoring 481
obtained. The sensors that showed a fit indicating a coefficient of determination capable to
explain at least 50% of the variability of the data (i.e., R
2
≥0.50) allowed us to determine the
sensor clusters and the frequency bands of interest. The results of this procedure led us to
consider the two alpha frequency bands and the high component of the theta frequency
band for the right (FT8, T8, TP8) and left (FT7, T7, TP7) temporal and right (FP2, AF4, F4, F6,
F8) and left (FP1, AF3, F3, F5, F7,) frontal lobes. This procedure led us also to consider the
two alpha frequency bands for the left (P1, P3, P5, P7, PO3, PO5, PO7) and right (P2, P4, P6,
P8, PO4, PO6, PO8) parietal and left (O1) and right (O2) occipital regions (For the electrodes
sites see Fig. 6). It must be noted that the results for both alpha bands were similar.
However, since the findings for the second alpha band (i.e., [9-13Hz]) were slightly better
only this frequency band will be presented and discussed. For the alpha (i.e., [9-13Hz]) and
high theta (i.e., [6-7Hz]) bands and the eight clusters of interest, the average power values
were computed, and the same fitting process was applied. Furthermore, in order to
investigate any correlation between the kinematics data and the EEG power, the average
EEG power values obtained for the clusters of interest were plotted versus the MT, ML and
RMSE values. Exponential (single and double), linear and quadratic models were used to fit
these relationships. The best fit was selected by considering the coefficient of determination
and its adjusted value, the mean square error of the fit, and the sum of squares due to the
fitting error.
The results showed that, during the early learning phase, the subjects performed distorted
movement trajectories with a slow progression towards the targets. However, as the subjects
of the learning group learned the unknown physical (kinematics) properties of the novel
tool, the analysis of the motor performance revealed that the MT, ML and RMSE decreased
throughout adaptation (Fig. 7A-C). From the early to the late learning period, the trajectories
were straighter and smoother while the control group did not show any performance
improvement (Fig. 7A-C).
Fig. 7. Concomitant EEG and kinematic changes throughout learning for the learning and
control groups. (A) Changes in MT (±SE) throughout the learning blocks. (B) Changes in ML
(±SE) (purple) and RMSE (±SE) (blue) throughout the learning blocks. (C) Changes in
average trajectory (thick black lines) throughout learning for early, middle and late exposure
(the grey area represents the standard error across subjects). (D) Qualitative EEG changes in
alpha (first and third row) and high theta (second and fourth row) frequency bands for the
frontal, temporal, parietal and occipital regions during planning (two first rows) and
execution (two last rows). For the sake of clarity, sensors which did not belong to the
clusters of interest were set to the minimal value of the scale for the scalp plot. The results of
the learning group and control group are represented in the left and right column,
respectively. (Adapted from Gentili et al., (2008) with permission from EURASIP).
Simultaneously to these behavioral changes, the results revealed that, as the subject adapt,
the alpha and the high component of the theta power increased in the frontal and temporal
lobes whereas an increased in alpha power also took place in the parietal lobes. Moreover,
these spectral changes occurred during both movement planning (i.e., movement
preparation) and movement execution. It must be noted that this alpha frequency band
spread form 9 to 13Hz showed the largest reactivity during the adaptation to the novel tool
and thus provides a better brain biomarker. Contrary to the learning group, the control
group did not exhibit any changes in spectral power (Fig. 7D).
Fig. 8. Linear fits of EEG power changes for the frontal and temporal clusters for the
participants of the learning group. Standardized values of the average EEG power
computed across subjects (n=10) of the learning group and blocks (n=9) for the alpha and
the high theta frequency bands recorded from the right (FT8, T8, TP8) and left (FT7, T7, TP7)
temporal lobes and right (FP2, AF4, F4, F6, F8) and left (FP1, AF3, F3, F5, F7) frontal lobes.
The blue and red stars indicate that the slopes were significantly different from zero for
planning and execution, respectively. The black star indicates that the slopes between
planning and execution were significantly different. The two bars on the right side of each
panel represent the average value of the EEG power for the same cortical sites and the same
frequency band for planning (blue) and execution (red) of the control group. (Adapted from
Gentili et al., (2008) with permission from EURASIP).
SignalProcessing482
Among the various models tested to fit these spectral changes, the best model that was able
to capture these changes was linear. Only the left temporal lobe presented a significantly
linear increase for the high component of theta power during movement planning (Fig. 8A).
However, for the frontal lobes, the same linear theta power increase occurred during both
movement planning and execution with similar slopes (Fig. 8C). For both the temporal and
frontal lobes, the alpha power significantly increased linearly during both movement
planning and execution. The slopes were also different between movement planning and
execution (Fig. 8B, D). Finally, the alpha power showed a significant linear increase in the
left and right parietal lobes for the planning while only a tendency was observed for the
execution and both movement stages for the two occipital lobes (Fig. 9A, C).
Fig. 9. Linear fits of EEG power changes for the occipital (A) and parietal (B) clusters for the
learning group. Standardized values of the average EEG power computed across subjects
(n=10) and blocks (n=9) for the alpha frequency bands recorded from the right (O2) and left
(O1) occipital lobes and right (P2, P4, P6, P8, PO4, PO6, PO8) and left (P1, P3, P5, P7, PO3, PO5,
PO7) parietal lobes. The blue stars indicate that the slopes were significantly different from
zero for planning. The two bars on the right side of each panel represent the average value of
the EEG power for the same cortical sites and the same frequency band for planning (blue) and
execution (red) for the control group. The scalp plot depicts the clusters of electrodes in the
occipital and parietal sites (C) and also for the frontal and temporal sites (D). For both panels,
the blue and red circles indicate that the linear models for the alpha and theta power showed a
coefficient of determination (R
2
) greater than 0.5 for the planning and execution of movement,
respectively. The blue and red stars indicate that the linear models had a slope significantly
different from zero for planning and execution phases, respectively. The black star indicates
that the slopes for planning and execution are significantly different from each other.
The previous results were obtained at a cluster level; however, a refined analysis conducted
at the sensor level also showed that these linear changes where located on specific sensors
(Fig. 9C, D) for these two frequency bands and both movement planning and execution.
Finally, in order to find a correlation model between these spectral changes and those
observed in kinematics during performance several models have been tested.
Fig. 10. Changes in EEG power in the alpha and high theta bands versus kinematics. The
first two rows represent the average values of the standardized power of the alpha bands
computed for the right and left temporal and frontal regions during planning and execution
versus the concomitant changes in ML (first row) and RMSE (second row) for the learning
group. The third row represents the same relationship for both alpha versus ML and high
theta versus RMSE for the control group. (Adapted from Gentili et al., (2008) with
permission from EURASIP).
The findings showed that, among the models tested, the single exponential was able to
capture with the best accuracy these co-variations between EEG power changes and the
corresponding motor production (Fig. 10A, B). The control group did not show any changes
(Fig. 10C).
Thus, it appears that these changes in theta and alpha power provide informative brain
biomarkers to track the cortical dynamics in order to assess the level of performance and
also to track during both planning and execution the level of mastery of a novel tool
throughout learning. Although useful, this first type of brain biomarker has the drawback to
be univariate, that is, the power computed at a particular scalp site is able to characterize
activation patterns for a particular channel (or brain region) without accounting for
functional network connectivity or communications between different regions of the cortex
during performance. It must be noted that these spectral power changes have been robustly
observed in EEG/MEG studies and represent today a classical brain biomarker of human
performance. Beside the spectral power, another type of brain biomarker, derived from
EEG/MEG, is the computation of the phase synchronization between two scalp sites.
Although initially less popular, this second technique (see section 2.3) is increasingly used to
Signalprocessingfornon-invasivebrain
biomarkersofsensorimotorperformanceandbrainmonitoring 483
Among the various models tested to fit these spectral changes, the best model that was able
to capture these changes was linear. Only the left temporal lobe presented a significantly
linear increase for the high component of theta power during movement planning (Fig. 8A).
However, for the frontal lobes, the same linear theta power increase occurred during both
movement planning and execution with similar slopes (Fig. 8C). For both the temporal and
frontal lobes, the alpha power significantly increased linearly during both movement
planning and execution. The slopes were also different between movement planning and
execution (Fig. 8B, D). Finally, the alpha power showed a significant linear increase in the
left and right parietal lobes for the planning while only a tendency was observed for the
execution and both movement stages for the two occipital lobes (Fig. 9A, C).
Fig. 9. Linear fits of EEG power changes for the occipital (A) and parietal (B) clusters for the
learning group. Standardized values of the average EEG power computed across subjects
(n=10) and blocks (n=9) for the alpha frequency bands recorded from the right (O2) and left
(O1) occipital lobes and right (P2, P4, P6, P8, PO4, PO6, PO8) and left (P1, P3, P5, P7, PO3, PO5,
PO7) parietal lobes. The blue stars indicate that the slopes were significantly different from
zero for planning. The two bars on the right side of each panel represent the average value of
the EEG power for the same cortical sites and the same frequency band for planning (blue) and
execution (red) for the control group. The scalp plot depicts the clusters of electrodes in the
occipital and parietal sites (C) and also for the frontal and temporal sites (D). For both panels,
the blue and red circles indicate that the linear models for the alpha and theta power showed a
coefficient of determination (R
2
) greater than 0.5 for the planning and execution of movement,
respectively. The blue and red stars indicate that the linear models had a slope significantly
different from zero for planning and execution phases, respectively. The black star indicates
that the slopes for planning and execution are significantly different from each other.
The previous results were obtained at a cluster level; however, a refined analysis conducted
at the sensor level also showed that these linear changes where located on specific sensors
(Fig. 9C, D) for these two frequency bands and both movement planning and execution.
Finally, in order to find a correlation model between these spectral changes and those
observed in kinematics during performance several models have been tested.
Fig. 10. Changes in EEG power in the alpha and high theta bands versus kinematics. The
first two rows represent the average values of the standardized power of the alpha bands
computed for the right and left temporal and frontal regions during planning and execution
versus the concomitant changes in ML (first row) and RMSE (second row) for the learning
group. The third row represents the same relationship for both alpha versus ML and high
theta versus RMSE for the control group. (Adapted from Gentili et al., (2008) with
permission from EURASIP).
The findings showed that, among the models tested, the single exponential was able to
capture with the best accuracy these co-variations between EEG power changes and the
corresponding motor production (Fig. 10A, B). The control group did not show any changes
(Fig. 10C).
Thus, it appears that these changes in theta and alpha power provide informative brain
biomarkers to track the cortical dynamics in order to assess the level of performance and
also to track during both planning and execution the level of mastery of a novel tool
throughout learning. Although useful, this first type of brain biomarker has the drawback to
be univariate, that is, the power computed at a particular scalp site is able to characterize
activation patterns for a particular channel (or brain region) without accounting for
functional network connectivity or communications between different regions of the cortex
during performance. It must be noted that these spectral power changes have been robustly
observed in EEG/MEG studies and represent today a classical brain biomarker of human
performance. Beside the spectral power, another type of brain biomarker, derived from
EEG/MEG, is the computation of the phase synchronization between two scalp sites.
Although initially less popular, this second technique (see section 2.3) is increasingly used to
SignalProcessing484
track the level of sensorimotor performance/learning. Recently this approach led to
interesting results that will be presented in the next section.
3.2 Phase synchronisation
Contrary to the previously mentioned investigations focusing on the spectral power analysis,
there are only a few studies that analyzed the cortical networking by means of coherence
and/or PLV to assess the level of motor performance and/or to track the learning dynamic.
For instance, Bell and Fox (1996) reported a decreased EEG coherence in experienced infant
crawlers relative to novice crawlers and attributed their findings to a pruning of synaptic
connections as crawling became more routine. Another experiment, further directly related
to our purpose and conducted by Deeny et al., (2003), compared EEG coherence between a
frontal site (i.e., sensor Fz) and several other cortical regions in two groups of highly skilled
marksmen who were similar in expertise, but who differed in competitive performance
history. One of the two groups performed consistently better in competition and exhibited
significantly lower coherence between the left temporal region (i.e., T3) and the premotor
area (i.e., Fz) in the low-alpha (8–10 Hz) and low-beta (13–22 Hz) bandwidths during the
aiming period (Fig. 11).
Fig. 11. Upper row. Expert and skilled group means for low-alpha (8–10 Hz) coherence
estimates between Fz (premotor area) and frontal, central, temporal, parietal, and occipital
sites in each cerebral hemisphere. Lower row. Expert and skilled group means for low-beta
(13–22 Hz) coherence estimates between Fz (premotor area) and frontal, central, temporal,
parietal, and occipital sites in each cerebral hemisphere. *Significant difference, p <0.05;
**T3–Fz coherence was significantly lower than T4–Fz coherence in the expert group only.
(Adapted from Deeny et al., (2003) with permission from Human Kinetics Publishers).
More recently, Deeny et al., (2009) confirmed that the coherence could also be useful to
assess the brain dynamic in relation to the level of mastery of a motor task. Specifically, they
showed that experts generally exhibited lower coherence over the whole scalp compared
with novices, with the effect most prominent in the right hemisphere. Coherence was
positively related to aiming movement variability in experts (Fig. 12).
Fig. 12. A. Average variability of rifle aiming path during the 4 s prior to trigger pull in 1-s
time bins for experts and novices. Error bars represent standard error. B. Coherence values
for high alpha. C. Coherence values for low beta. *Indicate significantly higher coherence in
novice shooters relative to experts (p <0.05). C = central; F = frontal; O = occipital; P =
parietal; T = temporal. (Adapted from Deeny et al., (2009) with permission from Heldref
Publications).
Taken together, the authors of these two studies suggested that these coherence results
reflect a refinement of cortical networks in experts that was interpreted as a reduction of
nonessential functional communications among the cortical regions of interest inducing in
turn an improvement in motor performance. In other words, such coherence patterns
provide brain biomarkers of specific motor planning as skill level increases allowing
assessing the mastery level of a given task. As previously explained in the section related to
the spectral power analysis, these studies assessed cortical dynamics for a well-established
motor ability without addressing any learning manipulations of object or tool having
unknown properties. As far as we know, only two investigations (Busk & Galbraith, 1975;
Kranczioch et al., 2008) used coherence measurement to study learning during a visuomotor
task. Specifically, Busk & Galbraith, (1975) reported decreased coherence between premotor
(Fz) and motor (C3, C4) areas of the cortex and between the premotor and occipital regions,
following practice on an eye–hand tracking task. More recently, Kranczioch et al., (2008)
found changes in cortico-cortical coupling during learning of a visuomotor power grip tool.
Specifically, they revealed that learning was variably associated with increased coherence
between contralateral and/or ipsilateral frontal and parietal, fronto-central, and occipital
brain regions. However, the learning period was relatively short (e.g., only the early
learning stage was considered in Busk & Galbraith, (1975)) and these studies did not involve
the suppression of familiar behavior used in the daily life.
By using the same tool learning protocol with unknown kinematics features (see section 3.1,
Fig.6), a recent analysis (Gentili et al., 2009b) aimed to identify any changes in phase
synchronization between two electrode pairs using both spectral coherence and PLV. The
aim was to extract information from these measures to provide additional non-invasive
functional brain biomarkers able to track the sensorimotor performance while subjects
learned to manipulate a novel tool. The pre-processing of the EEG, the choice of the
Signalprocessingfornon-invasivebrain
biomarkersofsensorimotorperformanceandbrainmonitoring 485
track the level of sensorimotor performance/learning. Recently this approach led to
interesting results that will be presented in the next section.
3.2 Phase synchronisation
Contrary to the previously mentioned investigations focusing on the spectral power analysis,
there are only a few studies that analyzed the cortical networking by means of coherence
and/or PLV to assess the level of motor performance and/or to track the learning dynamic.
For instance, Bell and Fox (1996) reported a decreased EEG coherence in experienced infant
crawlers relative to novice crawlers and attributed their findings to a pruning of synaptic
connections as crawling became more routine. Another experiment, further directly related
to our purpose and conducted by Deeny et al., (2003), compared EEG coherence between a
frontal site (i.e., sensor Fz) and several other cortical regions in two groups of highly skilled
marksmen who were similar in expertise, but who differed in competitive performance
history. One of the two groups performed consistently better in competition and exhibited
significantly lower coherence between the left temporal region (i.e., T3) and the premotor
area (i.e., Fz) in the low-alpha (8–10 Hz) and low-beta (13–22 Hz) bandwidths during the
aiming period (Fig. 11).
Fig. 11. Upper row. Expert and skilled group means for low-alpha (8–10 Hz) coherence
estimates between Fz (premotor area) and frontal, central, temporal, parietal, and occipital
sites in each cerebral hemisphere. Lower row. Expert and skilled group means for low-beta
(13–22 Hz) coherence estimates between Fz (premotor area) and frontal, central, temporal,
parietal, and occipital sites in each cerebral hemisphere. *Significant difference, p <0.05;
**T3–Fz coherence was significantly lower than T4–Fz coherence in the expert group only.
(Adapted from Deeny et al., (2003) with permission from Human Kinetics Publishers).
More recently, Deeny et al., (2009) confirmed that the coherence could also be useful to
assess the brain dynamic in relation to the level of mastery of a motor task. Specifically, they
showed that experts generally exhibited lower coherence over the whole scalp compared
with novices, with the effect most prominent in the right hemisphere. Coherence was
positively related to aiming movement variability in experts (Fig. 12).
Fig. 12. A. Average variability of rifle aiming path during the 4 s prior to trigger pull in 1-s
time bins for experts and novices. Error bars represent standard error. B. Coherence values
for high alpha. C. Coherence values for low beta. *Indicate significantly higher coherence in
novice shooters relative to experts (p <0.05). C = central; F = frontal; O = occipital; P =
parietal; T = temporal. (Adapted from Deeny et al., (2009) with permission from Heldref
Publications).
Taken together, the authors of these two studies suggested that these coherence results
reflect a refinement of cortical networks in experts that was interpreted as a reduction of
nonessential functional communications among the cortical regions of interest inducing in
turn an improvement in motor performance. In other words, such coherence patterns
provide brain biomarkers of specific motor planning as skill level increases allowing
assessing the mastery level of a given task. As previously explained in the section related to
the spectral power analysis, these studies assessed cortical dynamics for a well-established
motor ability without addressing any learning manipulations of object or tool having
unknown properties. As far as we know, only two investigations (Busk & Galbraith, 1975;
Kranczioch et al., 2008) used coherence measurement to study learning during a visuomotor
task. Specifically, Busk & Galbraith, (1975) reported decreased coherence between premotor
(Fz) and motor (C3, C4) areas of the cortex and between the premotor and occipital regions,
following practice on an eye–hand tracking task. More recently, Kranczioch et al., (2008)
found changes in cortico-cortical coupling during learning of a visuomotor power grip tool.
Specifically, they revealed that learning was variably associated with increased coherence
between contralateral and/or ipsilateral frontal and parietal, fronto-central, and occipital
brain regions. However, the learning period was relatively short (e.g., only the early
learning stage was considered in Busk & Galbraith, (1975)) and these studies did not involve
the suppression of familiar behavior used in the daily life.
By using the same tool learning protocol with unknown kinematics features (see section 3.1,
Fig.6), a recent analysis (Gentili et al., 2009b) aimed to identify any changes in phase
synchronization between two electrode pairs using both spectral coherence and PLV. The
aim was to extract information from these measures to provide additional non-invasive
functional brain biomarkers able to track the sensorimotor performance while subjects
learned to manipulate a novel tool. The pre-processing of the EEG, the choice of the
SignalProcessing486
frequency bands of interest and the kinematics processing were similar to that previously
described in section 3.1 for the same tool learning task. Both the spectral coherence and the
PLV have been computed as mentioned in section 2.3. A visual inspection of the data led us
to consider a linear and a logarithmic model to fit the relationship between the spectral
coherence/PLV changes and the kinematics parameters (MT, ML, RMSE) throughout
learning. However, based on the criteria previously mentioned (see section 3.1), the
logarithmic model allowed a better fitting of these relationships. It must be noted that, since
for this experiment both spectral coherence and PLV provided similar results, thus, only the
PLV results are presented in the following. The kinematics results are the same that those
presented in section 3.1 (see Fig. 7A-C) indicating that the subjects learned to manipulate
correctly the novel tool.
Fig. 13. Changes in PLV throughout the learning. A. Pair of electrodes showing a decrease of
their synchronization throughout the learning during planning (top scalp plot) and
execution (bottom scalp plot). B. Linear model capturing the changes in PLV during
planning and execution for the pair of electrodes Fz-F3 (low alpha band), Fz-F4 (low beta
band), Fz-C3 (low beta band) and Fz-O1 (gamma band). C. Linear model capturing the
changes in PLV during execution for the pair of electrodes Fz-T7 (low theta band), Fz-P3
(high alpha band), Fz-P4 (high alpha band), and Fz-F3 (high theta band). (Panels A and B
reproduced from Gentili et al., (2009b) with permission from IEEE).
While throughout learning the kinematics was enhanced (see Fig. 7A-C);
electrophysiological changes in phase synchronization were simultaneously observed (Fig.
13A). Namely, as the subjects adapt, the electrodes pair Fz-F3 (low alpha band), Fz-F3 (low
beta band), Fz-F4 (low beta band), Fz-C3 (low beta band) and Fz-O1 (gamma band) revealed
a decrease captured by a linear model (i.e., R
2
≥0.50) for both movement planning and
execution (Fig. 13B). For planning, the slopes of these linear models were significantly
different from zero (t-test, p<0.05) for Fz-F3 (low components of the alpha and beta bands),
Fz-C3 (low beta band), Fz-O1 (gamma band) and during execution for Fz-F3 (low alpha
band) and Fz-C3 (low beta band) while a trend was observed for Fz-F3 (low beta band,
p=0.06) and Fz-F4 (low beta band, p=0.07). Also, for execution, the same analysis revealed
that the electrode pairs Fz-T7 (low theta band), Fz-P3 (high alpha band), Fz-P4 (high alpha
band) and Fz-F3 (high theta band) showed a significant linear decrease of the PVL (t-test,
p<0.05) throughout adaptation (Fig.13C).
Such linear decrease was correlated with an enhancement of the performance and
particularly good logarithmic correlations were found between the changes in phase
synchronization and the MT and ML parameters. The results for the correlation analyses
showed that the relationships between the changes in PLV for the pairs Fz-F3, Fz-F4, Fz-C3,
Fz-O1 and the MT and ML values were best fitted by using a logarithm (R
2
≥0.40) for both
planning and execution. The same correlation analysis performed for the pairs Fz-T7, Fz-P3,
Fz-P4, Fz-F3 and the MT and ML values revealed that the same results were obtained
(R
2
≥0.50) only for movement execution.
Fig. 14. Representation of the PLV versus the MT (first row) and the ML (second row) for
both movement planning (blue color) and execution (red color). A. Pair Fz-F3 (low alpha
band); B. Pair Fz-C3 (low beta band); C. Pair Fz-O1 (gamma band); D. Pair Fz-T7 (low theta
band); E. Pair Fz-F3 (low alpha band); F. Pair Fz-C3 (low beta band); G. Pair Fz-O1 (gamma
band); H. Pair Fz-F3 (high theta band). Since the Pair Fz-T7 (low theta band) and Fz-F3 (high
theta band) revealed a non significant linear decrease during planning, the fits for PLV
values versus MT and ML are only presented for execution (see panel D and H). (Panels
A,B,E,F reproduced from Gentili et al., (2009b) with permission from IEEE).
As for the spectral power changes for the alpha and theta frequency bands, these changes in
coherence/PLV presented above, allow assessing the level of performance but also its
development throughout a learning period. Therefore, the spectral power and
coherence/PLV provide brain biomarkers of the performance and learning in Human that
may be useful in bioengineering/biomedical applications, particularly for brain monitoring
applications and/or when the access to the actual performance is impossible. This will be
presented in section 4, beforehand; the section 3.3 will present and discuss the advantages of
these brain biomarkers but also their current limitations and the potential solutions to
overcome them.
Signalprocessingfornon-invasivebrain
biomarkersofsensorimotorperformanceandbrainmonitoring 487
frequency bands of interest and the kinematics processing were similar to that previously
described in section 3.1 for the same tool learning task. Both the spectral coherence and the
PLV have been computed as mentioned in section 2.3. A visual inspection of the data led us
to consider a linear and a logarithmic model to fit the relationship between the spectral
coherence/PLV changes and the kinematics parameters (MT, ML, RMSE) throughout
learning. However, based on the criteria previously mentioned (see section 3.1), the
logarithmic model allowed a better fitting of these relationships. It must be noted that, since
for this experiment both spectral coherence and PLV provided similar results, thus, only the
PLV results are presented in the following. The kinematics results are the same that those
presented in section 3.1 (see Fig. 7A-C) indicating that the subjects learned to manipulate
correctly the novel tool.
Fig. 13. Changes in PLV throughout the learning. A. Pair of electrodes showing a decrease of
their synchronization throughout the learning during planning (top scalp plot) and
execution (bottom scalp plot). B. Linear model capturing the changes in PLV during
planning and execution for the pair of electrodes Fz-F3 (low alpha band), Fz-F4 (low beta
band), Fz-C3 (low beta band) and Fz-O1 (gamma band). C. Linear model capturing the
changes in PLV during execution for the pair of electrodes Fz-T7 (low theta band), Fz-P3
(high alpha band), Fz-P4 (high alpha band), and Fz-F3 (high theta band). (Panels A and B
reproduced from Gentili et al., (2009b) with permission from IEEE).
While throughout learning the kinematics was enhanced (see Fig. 7A-C);
electrophysiological changes in phase synchronization were simultaneously observed (Fig.
13A). Namely, as the subjects adapt, the electrodes pair Fz-F3 (low alpha band), Fz-F3 (low
beta band), Fz-F4 (low beta band), Fz-C3 (low beta band) and Fz-O1 (gamma band) revealed
a decrease captured by a linear model (i.e., R
2
≥0.50) for both movement planning and
execution (Fig. 13B). For planning, the slopes of these linear models were significantly
different from zero (t-test, p<0.05) for Fz-F3 (low components of the alpha and beta bands),
Fz-C3 (low beta band), Fz-O1 (gamma band) and during execution for Fz-F3 (low alpha
band) and Fz-C3 (low beta band) while a trend was observed for Fz-F3 (low beta band,
p=0.06) and Fz-F4 (low beta band, p=0.07). Also, for execution, the same analysis revealed
that the electrode pairs Fz-T7 (low theta band), Fz-P3 (high alpha band), Fz-P4 (high alpha
band) and Fz-F3 (high theta band) showed a significant linear decrease of the PVL (t-test,
p<0.05) throughout adaptation (Fig.13C).
Such linear decrease was correlated with an enhancement of the performance and
particularly good logarithmic correlations were found between the changes in phase
synchronization and the MT and ML parameters. The results for the correlation analyses
showed that the relationships between the changes in PLV for the pairs Fz-F3, Fz-F4, Fz-C3,
Fz-O1 and the MT and ML values were best fitted by using a logarithm (R
2
≥0.40) for both
planning and execution. The same correlation analysis performed for the pairs Fz-T7, Fz-P3,
Fz-P4, Fz-F3 and the MT and ML values revealed that the same results were obtained
(R
2
≥0.50) only for movement execution.
Fig. 14. Representation of the PLV versus the MT (first row) and the ML (second row) for
both movement planning (blue color) and execution (red color). A. Pair Fz-F3 (low alpha
band); B. Pair Fz-C3 (low beta band); C. Pair Fz-O1 (gamma band); D. Pair Fz-T7 (low theta
band); E. Pair Fz-F3 (low alpha band); F. Pair Fz-C3 (low beta band); G. Pair Fz-O1 (gamma
band); H. Pair Fz-F3 (high theta band). Since the Pair Fz-T7 (low theta band) and Fz-F3 (high
theta band) revealed a non significant linear decrease during planning, the fits for PLV
values versus MT and ML are only presented for execution (see panel D and H). (Panels
A,B,E,F reproduced from Gentili et al., (2009b) with permission from IEEE).
As for the spectral power changes for the alpha and theta frequency bands, these changes in
coherence/PLV presented above, allow assessing the level of performance but also its
development throughout a learning period. Therefore, the spectral power and
coherence/PLV provide brain biomarkers of the performance and learning in Human that
may be useful in bioengineering/biomedical applications, particularly for brain monitoring
applications and/or when the access to the actual performance is impossible. This will be
presented in section 4, beforehand; the section 3.3 will present and discuss the advantages of
these brain biomarkers but also their current limitations and the potential solutions to
overcome them.
SignalProcessing488
3.3 Strengths, weaknesses, and perspectives for brain biomarkers of the
sensorimotor performance
3.3.1 Strengths and weaknesses
By revealing correlations between the spectral power, coherence/PLV and motor
performance, the research lines presented in this chapter provide potential non-invasive
functional brain biomarkers to assess and track the level of performance and learning. It is
important to note that these biomarkers are able to detect important differences in skills
level such as those existing between novices and experts (e.g., Hatfield et al., 1984, 2004;
Haufler et al., 2000) as well as to identify the learning dynamic related to different types of
tasks inducing different neural resources (e.g., Gentili et al., 2008, 2009a,b; Kerick et al.,
2004). Moreover, although their scalp locations and frequency band of interest present slight
variations from one task to another, it appears that these biomarkers share also some
frequency (e.g., alpha band) and spatial (e.g., temporal region) features while being located
on specific electrodes for the various tasks tested. Therefore, beyond certain specificities that
are task-dependent, these biomarkers of human performance share a common consistent
topology in term of frequency and spatial scalp locations across different tasks. Moreover, it
must be noted that changes in phase synchronization for a specific frequency range do not
necessarily imply similar power changes for the same electrodes (Kiroi & Aslanyan, 2006).
Therefore, the availability of processing techniques for extracting and combining both
univariate (i.e., spectral power) and multivariate (i.e., spectral coherence/PLV) cortical
measures might provide “multidimensional” brain biomarkers in the future. Such
multidimensionality resulting from the combination previously described is expected to
provide enhanced, robust biomarkers capable of tracking performance and learning
dynamics, thus providing a potential solution to overcome limitations in current practical
applications. This will be explained in the section 3.3.2.
Another important point is directly linked to the fact that these biomarkers were derived
from EEG during movement execution, but, more importantly, during movement
preparation (i.e., planning; Deeny et al., 2003, 2009; Gentili et al., 2008, 2009a,b; Hatfield et
al., 2004; Haufler et al., 2000). The availability of these biomarkers during movement
execution and particularly during movement preparation (i.e., planning) involves two
specific advantages.
First, a biomarker of the performance during execution can be considered as a good
complement of the behavioral measures available during and/or after movement execution.
More importanty, the presence of these brain biomarkers during planning also allow
estimating/predicting the on-coming performance level that is not available with usual
peripheral and behavioral measurements. This important feature is common to many
biomarkers such as the bispectral index derived from EEG used for the identification of
anesthetic depth during pediatric cardiac surgery while the usual clinical signs are not
accessible (Williams & Ramamoorthy, 2009).
Second, the availability of brain biomarkers of the performance during movement
preparation is a feature that becomes particularly important when considering overt but,
more importantly, covert movement executions in the context of bioengineering and
biomedical applications for rehabilitation. The expression “overt movement execution”
corresponds to a movement actually performed such as those executed in daily activities. In
this case, the person can see and feel his/her own limb moving. Conversely, the term
“covert movement execution”, also commonly named mental or motor imagery, refers to a
dynamic mental process during which a subject internally simulates a motor action without
activating the muscles and, therefore, without any apparent motion of the limbs involved in
that action (Gentili et al., 2004, 2006; Jeannerod, 2001). Such motor imagery or covert
execution is commonly used for mental practice/rehearsal of specific performance skills,
BCI approaches and more generally in rehabilitation (see section 4 of this chapter).
Interestingly, many studies revealed that common neurocognitive mechanisms in terms of
both similar neural structures and behaviour exist between overt and covert motor actions
(Fadiga & Craighero, 2004; Gentili et al., 2006; Jeannerod et al., 2001). In particular, several
investigations suggest that motor imagery involves the same neural mechanisms as those
activated during preparation (i.e., planning) and execution of overt movements (e.g.,
Jeannerod, 1994, 2001). Therefore, although our task involved actual movements, since the
present results suggest that these brain biomarkers are accessible during movement
preparation, they may also be suitable for covert movement execution when a task is
performed using motor imagery.
Despite this research provided some interesting results and is still currently making
progresses, two main limitations have to be considered. First, the present brain biomarkers
of performance are based on a population analysis without considering subject individually.
Second, their computation was based on the average value across several trials (e.g., 20
trials). Definitely, considering the variability of the MEG/EEG signals from one trial to
another and also the sensitivity of the EEG signal to environmental noise and artefacts, the
approach consisting in defining brain biomarkers of the performance needs to investigate, to
what extent these results can be extended when single subject and single trials are
considered. This is important for future applications since they will be designed for single
subjects and ideally based on single or eventually few trials. Recently, by using MEG
applied to a similar tool learning task (described in Fig. 6), we started to address these two
problems by analyzing the alpha power band ([9-13Hz]) in individual subjects using the
same ERD/ERS techniques and testing different sliding window (e.g., length, overlap)
across trials. The preliminary results suggest that, at the individual level, the spectral power
for the alpha band ([9-13Hz]) computed at the frontal, temporal and parietal regions during
movement preparation were able to predict the motor performance (Gentili et al. 2009a).
3.3.2 Overcoming the current limitations by means of multiple constrains
As suggested in section 3.3.1, a possible way to overcome the two main limitations
previously mentioned (i.e., single subject and computation based on single or few trials) is
to obtain robust multidimensional EEG/MEG biomarkers able to assess the level of
performance and learning by combining several individual biomarkers. In other words, the
combination of several biomarkers would result in an increased number of conditions that
have to be satisfied for estimating reliably any enhancement of the performance. The
prediction problem is therefore constrained since a reliable estimation of performance needs
to satisfy several constraints represented by the right combinations of biomarkers. For
instance, if both a power increase and a coherence/PLV decrease are simultaneously
observed for specific frequency bands and brain regions, it seems reasonable to predict with
a certain confidence that the subjects are successfully learning the task. Conversely, if we
would have only one biomarker, this prediction would be less reliable. Therefore, the
combination of several brain biomarkers such as phase synchronization and spectral power
would provide cross-information resulting in the generation of robust and accurate non-
Signalprocessingfornon-invasivebrain
biomarkersofsensorimotorperformanceandbrainmonitoring 489
3.3 Strengths, weaknesses, and perspectives for brain biomarkers of the
sensorimotor performance
3.3.1 Strengths and weaknesses
By revealing correlations between the spectral power, coherence/PLV and motor
performance, the research lines presented in this chapter provide potential non-invasive
functional brain biomarkers to assess and track the level of performance and learning. It is
important to note that these biomarkers are able to detect important differences in skills
level such as those existing between novices and experts (e.g., Hatfield et al., 1984, 2004;
Haufler et al., 2000) as well as to identify the learning dynamic related to different types of
tasks inducing different neural resources (e.g., Gentili et al., 2008, 2009a,b; Kerick et al.,
2004). Moreover, although their scalp locations and frequency band of interest present slight
variations from one task to another, it appears that these biomarkers share also some
frequency (e.g., alpha band) and spatial (e.g., temporal region) features while being located
on specific electrodes for the various tasks tested. Therefore, beyond certain specificities that
are task-dependent, these biomarkers of human performance share a common consistent
topology in term of frequency and spatial scalp locations across different tasks. Moreover, it
must be noted that changes in phase synchronization for a specific frequency range do not
necessarily imply similar power changes for the same electrodes (Kiroi & Aslanyan, 2006).
Therefore, the availability of processing techniques for extracting and combining both
univariate (i.e., spectral power) and multivariate (i.e., spectral coherence/PLV) cortical
measures might provide “multidimensional” brain biomarkers in the future. Such
multidimensionality resulting from the combination previously described is expected to
provide enhanced, robust biomarkers capable of tracking performance and learning
dynamics, thus providing a potential solution to overcome limitations in current practical
applications. This will be explained in the section 3.3.2.
Another important point is directly linked to the fact that these biomarkers were derived
from EEG during movement execution, but, more importantly, during movement
preparation (i.e., planning; Deeny et al., 2003, 2009; Gentili et al., 2008, 2009a,b; Hatfield et
al., 2004; Haufler et al., 2000). The availability of these biomarkers during movement
execution and particularly during movement preparation (i.e., planning) involves two
specific advantages.
First, a biomarker of the performance during execution can be considered as a good
complement of the behavioral measures available during and/or after movement execution.
More importanty, the presence of these brain biomarkers during planning also allow
estimating/predicting the on-coming performance level that is not available with usual
peripheral and behavioral measurements. This important feature is common to many
biomarkers such as the bispectral index derived from EEG used for the identification of
anesthetic depth during pediatric cardiac surgery while the usual clinical signs are not
accessible (Williams & Ramamoorthy, 2009).
Second, the availability of brain biomarkers of the performance during movement
preparation is a feature that becomes particularly important when considering overt but,
more importantly, covert movement executions in the context of bioengineering and
biomedical applications for rehabilitation. The expression “overt movement execution”
corresponds to a movement actually performed such as those executed in daily activities. In
this case, the person can see and feel his/her own limb moving. Conversely, the term
“covert movement execution”, also commonly named mental or motor imagery, refers to a
dynamic mental process during which a subject internally simulates a motor action without
activating the muscles and, therefore, without any apparent motion of the limbs involved in
that action (Gentili et al., 2004, 2006; Jeannerod, 2001). Such motor imagery or covert
execution is commonly used for mental practice/rehearsal of specific performance skills,
BCI approaches and more generally in rehabilitation (see section 4 of this chapter).
Interestingly, many studies revealed that common neurocognitive mechanisms in terms of
both similar neural structures and behaviour exist between overt and covert motor actions
(Fadiga & Craighero, 2004; Gentili et al., 2006; Jeannerod et al., 2001). In particular, several
investigations suggest that motor imagery involves the same neural mechanisms as those
activated during preparation (i.e., planning) and execution of overt movements (e.g.,
Jeannerod, 1994, 2001). Therefore, although our task involved actual movements, since the
present results suggest that these brain biomarkers are accessible during movement
preparation, they may also be suitable for covert movement execution when a task is
performed using motor imagery.
Despite this research provided some interesting results and is still currently making
progresses, two main limitations have to be considered. First, the present brain biomarkers
of performance are based on a population analysis without considering subject individually.
Second, their computation was based on the average value across several trials (e.g., 20
trials). Definitely, considering the variability of the MEG/EEG signals from one trial to
another and also the sensitivity of the EEG signal to environmental noise and artefacts, the
approach consisting in defining brain biomarkers of the performance needs to investigate, to
what extent these results can be extended when single subject and single trials are
considered. This is important for future applications since they will be designed for single
subjects and ideally based on single or eventually few trials. Recently, by using MEG
applied to a similar tool learning task (described in Fig. 6), we started to address these two
problems by analyzing the alpha power band ([9-13Hz]) in individual subjects using the
same ERD/ERS techniques and testing different sliding window (e.g., length, overlap)
across trials. The preliminary results suggest that, at the individual level, the spectral power
for the alpha band ([9-13Hz]) computed at the frontal, temporal and parietal regions during
movement preparation were able to predict the motor performance (Gentili et al. 2009a).
3.3.2 Overcoming the current limitations by means of multiple constrains
As suggested in section 3.3.1, a possible way to overcome the two main limitations
previously mentioned (i.e., single subject and computation based on single or few trials) is
to obtain robust multidimensional EEG/MEG biomarkers able to assess the level of
performance and learning by combining several individual biomarkers. In other words, the
combination of several biomarkers would result in an increased number of conditions that
have to be satisfied for estimating reliably any enhancement of the performance. The
prediction problem is therefore constrained since a reliable estimation of performance needs
to satisfy several constraints represented by the right combinations of biomarkers. For
instance, if both a power increase and a coherence/PLV decrease are simultaneously
observed for specific frequency bands and brain regions, it seems reasonable to predict with
a certain confidence that the subjects are successfully learning the task. Conversely, if we
would have only one biomarker, this prediction would be less reliable. Therefore, the
combination of several brain biomarkers such as phase synchronization and spectral power
would provide cross-information resulting in the generation of robust and accurate non-
SignalProcessing490
invasive brain biomarkers of the motor performance. This approach could also give insight
into possible reasons for the failure of sensorimotor learning and adaptations. Thus, such
multidimensional brain biomarkers might be better suited for applications based on
individual subjects and single or few trials.
It must be noted that, this first type of constraint was related to a combination of various
biomarkers using the same brain imaging modality, i.e., EEG/MEG signals. However,
another type of combination could also be considered by using the fusion across multiple
recoding modalities in order to complement information provided from each imaging
technique. For instance, in order to complement EEG/MEG signals analysis, fNIRS signals
processing could provide additional brain biomarker by measuring the hemodynamic of
brain activity. The choice to use fNIRS is guided by three reasons: First, although the
hemodynamic activity has a lower temporal resolution than EEG, the fNIRS potentially
provides more direct spatial resolution or localization abilities over EEG (Soraghan et al.,
2008). Thus, with the superior temporal resolution of EEG, merging these two techniques
would allow for “the best of both worlds” (Coyle et al., 2007). Second, contrary to EEG, the
hemodynamic response is influenced by head/body orientation with respect to the
gravitational axis whereas fNRIS signal is relatively less sensitive to artefact and
environmental noise than EEG. Once again, since both do not have these two common
weaknesses their combination appears to be advantageous. Third, although fNIRS only
penetrate the cortex relatively superficially (~2.0 cm; Rolfe, 2003) contrary to classical fMRI,
these signals can be recorded by portable devices as it is also the case for EEG, making them,
particularly well suited for applications in practical/ecological situations with various
populations (e.g., healthy persons, patients, children, elderly, military personnel, etc.). It
must be noted that the idea to combine several biomarkers within (power, coherence/PLV)
and between (fNIRS) imaging modalities has already been proposed for clinical applications
(Guarracino et al., 2008) such as for brain injury prediction (Ramaswamy et al., 2009) and
amyotrophic lateral sclerosis (Turner et al., 2009). From a practical point of view, this signal
fusion across multiple imaging modalities could ideally be performed by using a recoding
system that embed both EEG and fNIRS sensors.
3.3.3 Emotional states on brain biomarkers of the performance
A question that is naturally raised is the influence that some psychological and mental states
such as emotion, stress or fatigue could exert over the quality of sensorimotor performance.
If such adverse psychological and mental states disrupt the motor performance, it is
legitimate to wonder to which extent the biomarkers tracking this same performance would
also be affected. However, the majority of the performance stress-related studies focus on
behavioural aspects without analyzing the cortical dynamics (Staal et al., 2004). Ongoing
research by Hatfield and colleagues is beginning to provide some insight into such
questions by placing performers under stressful conditions. For instance, Rietschel et al.,
(2008) asked participants to perform a marksmanship task under both regular performance-
alone and competitive conditions. Changes in the Spielberger State Anxiety Inventory
(STAI), heart rate, cortisol and skin conductance evidenced an increased state anxiety during
the competitive condition. Furthermore, the performance was affected during the
competition along with a significant decrease in alpha power. Similarly, when subjects
performed a drawing movement task under high level arousal conditions they exhibited
higher levels of coherence associated with decreases in performance (Rietschel et al., 2006).
Therefore, these results provide evidence that the brain biomarkers of sensorimotor
performance can be disrupted by psychological and mental states such as emotion, stress.
Thus, from a physiological point of view, it is possible to consider that an increased degree
of stress would induce the recruitment of nonessential neural resources during task
execution, leading to a reduction of cortical refinement (i.e., a reduction of alpha power and
an increase in cortico-cortical communication) that reflects sub-optimal performance. In
other words, we could consider that, to some degree, the brain biomarkers are contaminated
with a sort of noise. However, even in this case, they may still be informative since in some
instances they could also unravel the possible causes (e.g., stress, fatigue) of alterations in
behavioral performance which cannot be revealed by peripheral motion parameters (e.g.,
kinematics) alone. For instance, in the study where subjects learn a novel tool, the absence of
learning/adaptation could also be due to fatigue. Nevertheless, when considering the
spectral power, the frontal biomarkers evidenced here are neither in the same spatial
location (frontal midline) nor in the same frequency band (low theta band) than the fatigue-
related EEG power (Makeig et al., 2000; Oken et al., 2006). Similarly, when considering the
coherence/PLV, factors such as stress or fatigue imply an increase and not a decrease in
phase synchronization and is generally identified for different electrodes pairs and/or
frequency bands (Andersen et al., 2009; Lorist et al., 2009) than those found in the tool
learning study (see section 3.2). Therefore, this clearly illustrates: i) the advantage to
combine different biomarkers of the performance to obtain more robust predictions, ii) the
benefit to combine them with other biomarkers identifying some adverse mental states (e.g.,
fatigue, stress) to be able to better decipher or indicate potential causes of a poor learning
performance. Futures research should provide insights about these various possibilities,
their benefit and limits.
3.3.4 Fusion of structural and functional brain biomarkers
Although the two previous sections (3.3.2 and 3.3.3) focused on different problems, both of
them emphasized the importance for cross-information by combining several biomarkers.
Indeed, it can be reasonably expected that such combination of biomarkers would lead to a
robust tracking of motor performance and learning. It must be noted that such a
combination can be performed not only between functional biomarkers but also between
both structural and functional biomarkers. For instance, biomarkers can predict the
performance based on information at the genetic/molecular level (e.g., naloxone, cortisol) or
from behaviour such as heart rate or skin conductance (Armstrong & Hatfield, 2006). Thus,
such convergence between these biomarkers, different in nature, would allow performing
an even more robust prediction to assess accurately the level of performance and to
track/predict precisely the learning dynamic. Although this chapter introduced mainly the
concept of functional brain biomarkers for performance assessment, it appears clearly that
both structural and functional brain biomarkers must be seen as a complementary source of
information. Interestingly, while structural brain biomarkers using methods form genetic
may be more appropriate on a long timescale prediction such as very early diagnostic,
functional biomarkers may be better suited for short timescale prediction such as a real-time
tracking of the neural events. Such combination of structural and functional brain
biomarkers is an emerging research line. For instance, recently Deeny et al., (2008)
investigated MEG measurements in relation to genetic markers such as the epsilon4 allele of
Signalprocessingfornon-invasivebrain
biomarkersofsensorimotorperformanceandbrainmonitoring 491
invasive brain biomarkers of the motor performance. This approach could also give insight
into possible reasons for the failure of sensorimotor learning and adaptations. Thus, such
multidimensional brain biomarkers might be better suited for applications based on
individual subjects and single or few trials.
It must be noted that, this first type of constraint was related to a combination of various
biomarkers using the same brain imaging modality, i.e., EEG/MEG signals. However,
another type of combination could also be considered by using the fusion across multiple
recoding modalities in order to complement information provided from each imaging
technique. For instance, in order to complement EEG/MEG signals analysis, fNIRS signals
processing could provide additional brain biomarker by measuring the hemodynamic of
brain activity. The choice to use fNIRS is guided by three reasons: First, although the
hemodynamic activity has a lower temporal resolution than EEG, the fNIRS potentially
provides more direct spatial resolution or localization abilities over EEG (Soraghan et al.,
2008). Thus, with the superior temporal resolution of EEG, merging these two techniques
would allow for “the best of both worlds” (Coyle et al., 2007). Second, contrary to EEG, the
hemodynamic response is influenced by head/body orientation with respect to the
gravitational axis whereas fNRIS signal is relatively less sensitive to artefact and
environmental noise than EEG. Once again, since both do not have these two common
weaknesses their combination appears to be advantageous. Third, although fNIRS only
penetrate the cortex relatively superficially (~2.0 cm; Rolfe, 2003) contrary to classical fMRI,
these signals can be recorded by portable devices as it is also the case for EEG, making them,
particularly well suited for applications in practical/ecological situations with various
populations (e.g., healthy persons, patients, children, elderly, military personnel, etc.). It
must be noted that the idea to combine several biomarkers within (power, coherence/PLV)
and between (fNIRS) imaging modalities has already been proposed for clinical applications
(Guarracino et al., 2008) such as for brain injury prediction (Ramaswamy et al., 2009) and
amyotrophic lateral sclerosis (Turner et al., 2009). From a practical point of view, this signal
fusion across multiple imaging modalities could ideally be performed by using a recoding
system that embed both EEG and fNIRS sensors.
3.3.3 Emotional states on brain biomarkers of the performance
A question that is naturally raised is the influence that some psychological and mental states
such as emotion, stress or fatigue could exert over the quality of sensorimotor performance.
If such adverse psychological and mental states disrupt the motor performance, it is
legitimate to wonder to which extent the biomarkers tracking this same performance would
also be affected. However, the majority of the performance stress-related studies focus on
behavioural aspects without analyzing the cortical dynamics (Staal et al., 2004). Ongoing
research by Hatfield and colleagues is beginning to provide some insight into such
questions by placing performers under stressful conditions. For instance, Rietschel et al.,
(2008) asked participants to perform a marksmanship task under both regular performance-
alone and competitive conditions. Changes in the Spielberger State Anxiety Inventory
(STAI), heart rate, cortisol and skin conductance evidenced an increased state anxiety during
the competitive condition. Furthermore, the performance was affected during the
competition along with a significant decrease in alpha power. Similarly, when subjects
performed a drawing movement task under high level arousal conditions they exhibited
higher levels of coherence associated with decreases in performance (Rietschel et al., 2006).
Therefore, these results provide evidence that the brain biomarkers of sensorimotor
performance can be disrupted by psychological and mental states such as emotion, stress.
Thus, from a physiological point of view, it is possible to consider that an increased degree
of stress would induce the recruitment of nonessential neural resources during task
execution, leading to a reduction of cortical refinement (i.e., a reduction of alpha power and
an increase in cortico-cortical communication) that reflects sub-optimal performance. In
other words, we could consider that, to some degree, the brain biomarkers are contaminated
with a sort of noise. However, even in this case, they may still be informative since in some
instances they could also unravel the possible causes (e.g., stress, fatigue) of alterations in
behavioral performance which cannot be revealed by peripheral motion parameters (e.g.,
kinematics) alone. For instance, in the study where subjects learn a novel tool, the absence of
learning/adaptation could also be due to fatigue. Nevertheless, when considering the
spectral power, the frontal biomarkers evidenced here are neither in the same spatial
location (frontal midline) nor in the same frequency band (low theta band) than the fatigue-
related EEG power (Makeig et al., 2000; Oken et al., 2006). Similarly, when considering the
coherence/PLV, factors such as stress or fatigue imply an increase and not a decrease in
phase synchronization and is generally identified for different electrodes pairs and/or
frequency bands (Andersen et al., 2009; Lorist et al., 2009) than those found in the tool
learning study (see section 3.2). Therefore, this clearly illustrates: i) the advantage to
combine different biomarkers of the performance to obtain more robust predictions, ii) the
benefit to combine them with other biomarkers identifying some adverse mental states (e.g.,
fatigue, stress) to be able to better decipher or indicate potential causes of a poor learning
performance. Futures research should provide insights about these various possibilities,
their benefit and limits.
3.3.4 Fusion of structural and functional brain biomarkers
Although the two previous sections (3.3.2 and 3.3.3) focused on different problems, both of
them emphasized the importance for cross-information by combining several biomarkers.
Indeed, it can be reasonably expected that such combination of biomarkers would lead to a
robust tracking of motor performance and learning. It must be noted that such a
combination can be performed not only between functional biomarkers but also between
both structural and functional biomarkers. For instance, biomarkers can predict the
performance based on information at the genetic/molecular level (e.g., naloxone, cortisol) or
from behaviour such as heart rate or skin conductance (Armstrong & Hatfield, 2006). Thus,
such convergence between these biomarkers, different in nature, would allow performing
an even more robust prediction to assess accurately the level of performance and to
track/predict precisely the learning dynamic. Although this chapter introduced mainly the
concept of functional brain biomarkers for performance assessment, it appears clearly that
both structural and functional brain biomarkers must be seen as a complementary source of
information. Interestingly, while structural brain biomarkers using methods form genetic
may be more appropriate on a long timescale prediction such as very early diagnostic,
functional biomarkers may be better suited for short timescale prediction such as a real-time
tracking of the neural events. Such combination of structural and functional brain
biomarkers is an emerging research line. For instance, recently Deeny et al., (2008)
investigated MEG measurements in relation to genetic markers such as the epsilon4 allele of
SignalProcessing492
the apolipoprotein, providing a method to detect risk factors for Alzheimer's disease
(Corder et al., 1993).
4. Current Brain Biomarkers for Sensorimotor Performance and
Bioengineering Applications
Beyond the considerations presented in section 3, the techniques presented to record and
process brain biomarkers non-invasively using portable systems make them particularly
well suited for real-time (or close to real-time) prediction in practical/ecological
applications. Although multiple potential applications can be considered for the future, this
section will illustrate two possible applications. The first one will be the design of future
smart neuroprosthetics by proposing solutions to overcome some well-known BCI-related
problems. The second application (that is actually to some extent a generalization of the first
one) will be related to brain monitoring in the context of overt and covert movement
execution to accelerate learning or re-learning when a task is performed/learned using
actual movements and/or motor imagery.
4.1 Neuroprosthetic applications: towards a smart Brain Computer Interface
The changes previously described in EEG power and coherence/PLV that mirror human
motor performance may potentially provide powerful biomarkers for tracking human
learning/adaptation status when one has to learn/adapt to a new tool. A first potential
interesting role of these brain biomarkers would be to overcome the well-known difficulties
related to BCI systems such as adaptive decoding, constant recalibration and the
maintenance of stable performance while a user tries to control a neuroprosthesis (Vaughan
et al., 2003). Traditionally, motor-imagery-based BCI approaches are divided into two
phases. The first one consists of a calibration phase to determine the parameters of a
decoding algorithm, which has to map neural signals to a class of imagined movement. The
second phase aims to train the subject by providing him/her sufficient feedback to change
his/her cortical dynamics in order to control an external device via the BCI system. It is
important to note that during this second stage, since the adaptation depends on the
capacity of the user’s brain to change its cortical dynamics, frequent recalibrations of the
decoding algorithms are required when the user’s performance degrades (Blankertz et al.,
2009). In order to address these problems, some solutions have been proposed and notably
by means of adaptive algorithms (Blankertz et al., 2006; Sykacek et al., 2004). However, these
approaches use supervised adaptation based on a priori knowledge of an external target.
Although helpful, the requirement of such a priori information actually represents a major
pitfall for practical BCI applications since the user should decide when and where to direct
his/her intentions. In other words, no information of external targets is available to the
decoding algorithm (Blankertz et al., 2006; Vidaurre et al., 2007). The complexity of using
two adaptive controllers (the user’s brain and the decoding algorithm) is not new and has
been already raised (McFarland et al., 2006; Vaughan et al., 1996); however, it continues to
be an issue, and no satisfying solutions of this problem have been provided (McFarland et
al., 2006). The brain biomarkers of performance presented in this chapter may help to
overcome such important drawbacks of BCI. Indeed, such biomarkers could be used to
continuously adapt the decoding algorithm to the subject’s mental states, thereby allowing a
stable co-adaptation/cooperation between the user and the BCI system. This is especially
relevant when the user has to learn the physical properties of a new tool and/or a novel
environment as is the case when a user intends to control a neuroprosthetic device. For
example, the alpha power at the frontal, temporal and parietal sites combined with
coherence/PLV for the low beta frequency bands between the pair of electrodes Fz-F3 and
Fz-C3 could be computed using a sliding window (e.g., 15-20 trials). If the user’s brain
considerably adapts as indicated by an increased alpha power combined with a reduced
coherence/PLV at the brain sites mentioned above, then the BCI decoding algorithm should
not update its parameters. Conversely, it should adjust the parameters, by using, for
instance, a reinforcement learning signal, to compensate for a user’s poor performance (in
that case reflected by a decreased alpha power and an increased coherence/PLV at the brain
sites mentioned above).
As previously mentioned in section 3.3.3, the use of such biomarkers could also reveal the
sources of alteration in behavioral performance which cannot be revealed by kinematics
parameters alone. For instance, poor learning/adaptation performance could be due to
other factors such as stress or fatigue. These biomarkers, thanks to their specificities in term
of scalp sites and frequency bands (and also with eventual additional information such as
hemodynamic response provided by fNIRS), could reasonably unravel the possible origin of
poor motor learning, providing, therefore, relevant covert supervision of the user during
BCI training. For example, in practical use, it is important to decipher if a user’s poor BCI
performance is related to fatigue or to bottlenecks related to information processing guiding
the algorithm to adapt to the user’s cognitive state, which is usually impossible to access
from behavior.
4.2 Brain monitoring applications
Another possible application of functional brain biomarkers would be related to brain
monitoring for overt and more importantly for covert execution. It is well known that motor
imagery, or covert execution, share a lot of functional commonalities and that many neural
structures are commonly activated during both overt and covert movement. On the other
hand, there is also a growing body of evidence that suggests that it is possible to learn, or at
least improve, performance with practice using motor imagery also called mental training.
Most of the studies focusing on mental practice either considered performance enhancement
in a healthy population (e.g., Gentili et al., 2006; Yaguez et al., 1998) or a rehabilitation (e.g.,
Jackson et al., 2004; Page et al., 2001) context where a positive effect on subsequent actual
motor performance was evidenced. While it is possible to assess the effects of such covert
practice on subsequent actual movements, it is impossible to continuously monitor mental
training (unless a trial is actually executed) since no overt execution is available. However,
the brain biomarkers presented here would allow for assessing the level of performance
during mental training and tracking of learning dynamics. Such brain biomarkers could be
coupled to a neurofeedback system providing, thus, an enhanced feedback of performance
during overt execution (in addition to classical feedback) or covert execution where usually
no feedback is available. Such brain monitoring systems for covert/overt movement
execution would allow efficient supervision of performance, resulting in an accelerated
learning or re-learning. Such bioengineering systems could be applied in various
populations ranging from military personnel desiring to rapidly acquire skills to any
persons subjected to a motor impairment undergoing rehabilitation where enhanced
guidance for both patient and therapist would be beneficial. It must be noted that these
Signalprocessingfornon-invasivebrain
biomarkersofsensorimotorperformanceandbrainmonitoring 493
the apolipoprotein, providing a method to detect risk factors for Alzheimer's disease
(Corder et al., 1993).
4. Current Brain Biomarkers for Sensorimotor Performance and
Bioengineering Applications
Beyond the considerations presented in section 3, the techniques presented to record and
process brain biomarkers non-invasively using portable systems make them particularly
well suited for real-time (or close to real-time) prediction in practical/ecological
applications. Although multiple potential applications can be considered for the future, this
section will illustrate two possible applications. The first one will be the design of future
smart neuroprosthetics by proposing solutions to overcome some well-known BCI-related
problems. The second application (that is actually to some extent a generalization of the first
one) will be related to brain monitoring in the context of overt and covert movement
execution to accelerate learning or re-learning when a task is performed/learned using
actual movements and/or motor imagery.
4.1 Neuroprosthetic applications: towards a smart Brain Computer Interface
The changes previously described in EEG power and coherence/PLV that mirror human
motor performance may potentially provide powerful biomarkers for tracking human
learning/adaptation status when one has to learn/adapt to a new tool. A first potential
interesting role of these brain biomarkers would be to overcome the well-known difficulties
related to BCI systems such as adaptive decoding, constant recalibration and the
maintenance of stable performance while a user tries to control a neuroprosthesis (Vaughan
et al., 2003). Traditionally, motor-imagery-based BCI approaches are divided into two
phases. The first one consists of a calibration phase to determine the parameters of a
decoding algorithm, which has to map neural signals to a class of imagined movement. The
second phase aims to train the subject by providing him/her sufficient feedback to change
his/her cortical dynamics in order to control an external device via the BCI system. It is
important to note that during this second stage, since the adaptation depends on the
capacity of the user’s brain to change its cortical dynamics, frequent recalibrations of the
decoding algorithms are required when the user’s performance degrades (Blankertz et al.,
2009). In order to address these problems, some solutions have been proposed and notably
by means of adaptive algorithms (Blankertz et al., 2006; Sykacek et al., 2004). However, these
approaches use supervised adaptation based on a priori knowledge of an external target.
Although helpful, the requirement of such a priori information actually represents a major
pitfall for practical BCI applications since the user should decide when and where to direct
his/her intentions. In other words, no information of external targets is available to the
decoding algorithm (Blankertz et al., 2006; Vidaurre et al., 2007). The complexity of using
two adaptive controllers (the user’s brain and the decoding algorithm) is not new and has
been already raised (McFarland et al., 2006; Vaughan et al., 1996); however, it continues to
be an issue, and no satisfying solutions of this problem have been provided (McFarland et
al., 2006). The brain biomarkers of performance presented in this chapter may help to
overcome such important drawbacks of BCI. Indeed, such biomarkers could be used to
continuously adapt the decoding algorithm to the subject’s mental states, thereby allowing a
stable co-adaptation/cooperation between the user and the BCI system. This is especially
relevant when the user has to learn the physical properties of a new tool and/or a novel
environment as is the case when a user intends to control a neuroprosthetic device. For
example, the alpha power at the frontal, temporal and parietal sites combined with
coherence/PLV for the low beta frequency bands between the pair of electrodes Fz-F3 and
Fz-C3 could be computed using a sliding window (e.g., 15-20 trials). If the user’s brain
considerably adapts as indicated by an increased alpha power combined with a reduced
coherence/PLV at the brain sites mentioned above, then the BCI decoding algorithm should
not update its parameters. Conversely, it should adjust the parameters, by using, for
instance, a reinforcement learning signal, to compensate for a user’s poor performance (in
that case reflected by a decreased alpha power and an increased coherence/PLV at the brain
sites mentioned above).
As previously mentioned in section 3.3.3, the use of such biomarkers could also reveal the
sources of alteration in behavioral performance which cannot be revealed by kinematics
parameters alone. For instance, poor learning/adaptation performance could be due to
other factors such as stress or fatigue. These biomarkers, thanks to their specificities in term
of scalp sites and frequency bands (and also with eventual additional information such as
hemodynamic response provided by fNIRS), could reasonably unravel the possible origin of
poor motor learning, providing, therefore, relevant covert supervision of the user during
BCI training. For example, in practical use, it is important to decipher if a user’s poor BCI
performance is related to fatigue or to bottlenecks related to information processing guiding
the algorithm to adapt to the user’s cognitive state, which is usually impossible to access
from behavior.
4.2 Brain monitoring applications
Another possible application of functional brain biomarkers would be related to brain
monitoring for overt and more importantly for covert execution. It is well known that motor
imagery, or covert execution, share a lot of functional commonalities and that many neural
structures are commonly activated during both overt and covert movement. On the other
hand, there is also a growing body of evidence that suggests that it is possible to learn, or at
least improve, performance with practice using motor imagery also called mental training.
Most of the studies focusing on mental practice either considered performance enhancement
in a healthy population (e.g., Gentili et al., 2006; Yaguez et al., 1998) or a rehabilitation (e.g.,
Jackson et al., 2004; Page et al., 2001) context where a positive effect on subsequent actual
motor performance was evidenced. While it is possible to assess the effects of such covert
practice on subsequent actual movements, it is impossible to continuously monitor mental
training (unless a trial is actually executed) since no overt execution is available. However,
the brain biomarkers presented here would allow for assessing the level of performance
during mental training and tracking of learning dynamics. Such brain biomarkers could be
coupled to a neurofeedback system providing, thus, an enhanced feedback of performance
during overt execution (in addition to classical feedback) or covert execution where usually
no feedback is available. Such brain monitoring systems for covert/overt movement
execution would allow efficient supervision of performance, resulting in an accelerated
learning or re-learning. Such bioengineering systems could be applied in various
populations ranging from military personnel desiring to rapidly acquire skills to any
persons subjected to a motor impairment undergoing rehabilitation where enhanced
guidance for both patient and therapist would be beneficial. It must be noted that these
SignalProcessing494
biomarkers would allow monitoring and fitting of the training time-scale for each individual
since it is reasonable to expect that two individuals will not mentally learn at the same
speed. For instance, for the same task some individuals using mental practice may need 40
trials to reach acceptable performance while others would need 60 trials to reach the same
level of performance. However, it is not possible to detect any progression in performance
when using motor imagery (except by occasionally using actual execution) unless we use
these brain biomarkers to create a customized training timescale for each individual.
Moreover, as for BCI application, it would also be possible to know if a poor performance is
related to sensorimotor learning processes or induced by some adverse mental states such as
fatigue. Thus, the therapist could adapt the current rehabilitation session to the patient’s
cognitive state in order to improve training efficiency without having to access behavioral
measures.
At present, the current research focuses mainly on brain biomarkers for healthy people since
a well-established model of these brain biomarkers needs to be defined before moving
towards practical applications for pathology in a rehabilitation context. It is of interest to
consider if such brain biomarkers would be applicable for patients subjected to neural
pathologies. Although these biomarkers should be affected by a given pathological state, it
is still possible to find their modified version adapted to this pathology as a BCI decoding
algorithm is able to map a pathological neural activity to the desired output (Neuper et al.,
2003). This would necessitate applying the same techniques and approaches, albeit with
some modifications, to provide biomarkers engineered for specific neural pathologies. For
instance, it has been suggested that mental imagery practice would have positive effects on
persons subjected to cerebral palsy (Trusceli et al., 2008; Zabalia, 2002). Therefore, under
such conditions, the cerebral palsy-specific performance biomarkers would allow
monitoring of the brain to provide feedback for a therapist in order to accelerate and
improve performance and, thus, the physical therapy process. It must be noted that, beyond
application, such brain biomarkers could also provide useful information about the cortical
neural networks of patients suffering from neural diseases. Still taking the example of
patients with cerebral palsy, specifically, these brain biomarkers could provide insights into
the effects of physical therapy by, for instance, estimating the benefit of motor imagery on
reorganization of cortical dynamics and the degree of automatization of the movement.
Namely, the coherence/PLV biomarker (Busk & Galbraith, 1975; Deeny et al., 2003, 2009;
Gentili et al., 2009b) may be of particular interest to analyze any possible changes in cortical
network recruitments throughout the rehabilitation procedure associated with any potential
motor performance improvement. Moreover, several investigations have suggested that an
increase in alpha power in the temporal, frontal regions would reflect that movement
become more automatized as a function of practice, requiring less attentional and processing
resources, since as strategies and skills are developed, there is a less extensive cortical
contribution to task performance, resulting in increased alpha power (Gentili et al., 2008,
2009a; Hatfield et al., 2004; Smith et al., 1999). Therefore, when using mental imagery the
computation of such spectral power could provide a biomarker able to assess the degree of
automatization of the repeated actions throughout a rehabilitation session. Finally, as
previously mentioned, a multidimensional brain biomarker could be even more effective by
combining information such as the spectral power, coherence/PLV and hemodynamic
responses using fNIRS.
5. Conclusions and Perspectives
Nowadays, some non-invasive functional brain biomarkers able to assess cognitive-
motor/sensorimotor performance and learning level are available. However, they were
mainly analyzed by means of investigations based on populations of subjects. The next
challenge is to generalize these biomarkers to single subjects using single or few trials in
tasks using actual movements or motor imagery. In order to reach these new aims, further
research is needed to provide multidimensional biomarkers by considering the fusion of
both processing techniques (e.g., EEG/MEG spectral power and coherence) and the nature
of neural signals (e.g., hemodynamic response with fNIRS). Such approaches are expected to
provide robust models for these biomarkers. Today, these brain biomarkers are engineered
based on healthy people; however, in the future these methods could be transferred to
alleviate neural disorders, provide new types of smart neural prostheses, and create brain
monitoring tools to allow the emergence of a new generation of assistive technology for both
healthy (e.g., accelerated learning) and pathological (e.g., rehabilitation) human populations.
6. Acknowledgements
Rodolphe J. Gentili would like to sincerely thank La Fondation Motrice, Paris, France, for
supporting continuously his research from several years.
7. References
Andersen, S.B.; Moore, R.A.; Venables, L. & Corr, P.J. (2009). Electrophysiological correlates
of anxious rumination. Int JPsychophysiol., Vol.71(2), pp.156-169.
Anguera, J.A.; Seidler, R.D.; Gehring, W.J. (2009). Changes in performance monitoring
during sensorimotor adaptation. J. Neurophysiol., Vol.102(3), pp.1868-1879.
Armstrong, D.W. & Hatfield, B.D. (2006). Hormonal responses to opioid receptor blockade:
during rest and exercise in cold and hot environments. Eur J Appl Physiol., Vol.97(1),
pp.43-51.
Bell, M.A. & Fox, N.A. (1996). Crawling experience is related to changes in cortical
organization during infancy: evidence from EEG coherence. Dev Psychobiol.,
Vol.29(7), pp.551-61.
Bell, A.J. & Sejnowski, T.J. (1995). An Information-Maximization Approach to Blind
Separation and Blind Deconvolution, Neural Computation, Vol.7(6), pp.1129-1159.
Berg, D. (2008). Biomarkers for the early detection of Parkinson's and Alzheimer's disease.
Neurodegener Dis., Vol.5(34), pp.133-136.
Blankertz, B. & Vidaurre, C. (2009). Towards a cure for BCI illiteracy: Machine-learning
based co-adaptive learning.BMC Neuroscience, Vol.10(1), pp.85.
Blankertz, B.; Muller, K.R.; Krusienski, D. J.; Schalk, G.; Wolpaw, A. et al. (2006). The BCI
competetion. III: Validating alternative approaches to actual BCI problems, IEEE
Trans Neural Syst Rehabil Eng., Vol.14(2), pp.153-159.
Blankertz, B.; Müller K.R. & Curio, G. (2009). Neuronal correlates of emotions in human-
machine interaction. BMC Neuroscience, Vol.10(1), pp.80.
Brunner, C.; Scherer, R.; Graimann, B.; Supp, G. & Pfurtscheller, G. (2006). Online control of
a brain-computer interface using phase synchronization. IEEE Trans Biomed Eng.,
Vol.53(12 Pt 1), pp.2501-2506.
Signalprocessingfornon-invasivebrain
biomarkersofsensorimotorperformanceandbrainmonitoring 495
biomarkers would allow monitoring and fitting of the training time-scale for each individual
since it is reasonable to expect that two individuals will not mentally learn at the same
speed. For instance, for the same task some individuals using mental practice may need 40
trials to reach acceptable performance while others would need 60 trials to reach the same
level of performance. However, it is not possible to detect any progression in performance
when using motor imagery (except by occasionally using actual execution) unless we use
these brain biomarkers to create a customized training timescale for each individual.
Moreover, as for BCI application, it would also be possible to know if a poor performance is
related to sensorimotor learning processes or induced by some adverse mental states such as
fatigue. Thus, the therapist could adapt the current rehabilitation session to the patient’s
cognitive state in order to improve training efficiency without having to access behavioral
measures.
At present, the current research focuses mainly on brain biomarkers for healthy people since
a well-established model of these brain biomarkers needs to be defined before moving
towards practical applications for pathology in a rehabilitation context. It is of interest to
consider if such brain biomarkers would be applicable for patients subjected to neural
pathologies. Although these biomarkers should be affected by a given pathological state, it
is still possible to find their modified version adapted to this pathology as a BCI decoding
algorithm is able to map a pathological neural activity to the desired output (Neuper et al.,
2003). This would necessitate applying the same techniques and approaches, albeit with
some modifications, to provide biomarkers engineered for specific neural pathologies. For
instance, it has been suggested that mental imagery practice would have positive effects on
persons subjected to cerebral palsy (Trusceli et al., 2008; Zabalia, 2002). Therefore, under
such conditions, the cerebral palsy-specific performance biomarkers would allow
monitoring of the brain to provide feedback for a therapist in order to accelerate and
improve performance and, thus, the physical therapy process. It must be noted that, beyond
application, such brain biomarkers could also provide useful information about the cortical
neural networks of patients suffering from neural diseases. Still taking the example of
patients with cerebral palsy, specifically, these brain biomarkers could provide insights into
the effects of physical therapy by, for instance, estimating the benefit of motor imagery on
reorganization of cortical dynamics and the degree of automatization of the movement.
Namely, the coherence/PLV biomarker (Busk & Galbraith, 1975; Deeny et al., 2003, 2009;
Gentili et al., 2009b) may be of particular interest to analyze any possible changes in cortical
network recruitments throughout the rehabilitation procedure associated with any potential
motor performance improvement. Moreover, several investigations have suggested that an
increase in alpha power in the temporal, frontal regions would reflect that movement
become more automatized as a function of practice, requiring less attentional and processing
resources, since as strategies and skills are developed, there is a less extensive cortical
contribution to task performance, resulting in increased alpha power (Gentili et al., 2008,
2009a; Hatfield et al., 2004; Smith et al., 1999). Therefore, when using mental imagery the
computation of such spectral power could provide a biomarker able to assess the degree of
automatization of the repeated actions throughout a rehabilitation session. Finally, as
previously mentioned, a multidimensional brain biomarker could be even more effective by
combining information such as the spectral power, coherence/PLV and hemodynamic
responses using fNIRS.
5. Conclusions and Perspectives
Nowadays, some non-invasive functional brain biomarkers able to assess cognitive-
motor/sensorimotor performance and learning level are available. However, they were
mainly analyzed by means of investigations based on populations of subjects. The next
challenge is to generalize these biomarkers to single subjects using single or few trials in
tasks using actual movements or motor imagery. In order to reach these new aims, further
research is needed to provide multidimensional biomarkers by considering the fusion of
both processing techniques (e.g., EEG/MEG spectral power and coherence) and the nature
of neural signals (e.g., hemodynamic response with fNIRS). Such approaches are expected to
provide robust models for these biomarkers. Today, these brain biomarkers are engineered
based on healthy people; however, in the future these methods could be transferred to
alleviate neural disorders, provide new types of smart neural prostheses, and create brain
monitoring tools to allow the emergence of a new generation of assistive technology for both
healthy (e.g., accelerated learning) and pathological (e.g., rehabilitation) human populations.
6. Acknowledgements
Rodolphe J. Gentili would like to sincerely thank La Fondation Motrice, Paris, France, for
supporting continuously his research from several years.
7. References
Andersen, S.B.; Moore, R.A.; Venables, L. & Corr, P.J. (2009). Electrophysiological correlates
of anxious rumination. Int JPsychophysiol., Vol.71(2), pp.156-169.
Anguera, J.A.; Seidler, R.D.; Gehring, W.J. (2009). Changes in performance monitoring
during sensorimotor adaptation. J. Neurophysiol., Vol.102(3), pp.1868-1879.
Armstrong, D.W. & Hatfield, B.D. (2006). Hormonal responses to opioid receptor blockade:
during rest and exercise in cold and hot environments. Eur J Appl Physiol., Vol.97(1),
pp.43-51.
Bell, M.A. & Fox, N.A. (1996). Crawling experience is related to changes in cortical
organization during infancy: evidence from EEG coherence. Dev Psychobiol.,
Vol.29(7), pp.551-61.
Bell, A.J. & Sejnowski, T.J. (1995). An Information-Maximization Approach to Blind
Separation and Blind Deconvolution, Neural Computation, Vol.7(6), pp.1129-1159.
Berg, D. (2008). Biomarkers for the early detection of Parkinson's and Alzheimer's disease.
Neurodegener Dis., Vol.5(34), pp.133-136.
Blankertz, B. & Vidaurre, C. (2009). Towards a cure for BCI illiteracy: Machine-learning
based co-adaptive learning.BMC Neuroscience, Vol.10(1), pp.85.
Blankertz, B.; Muller, K.R.; Krusienski, D. J.; Schalk, G.; Wolpaw, A. et al. (2006). The BCI
competetion. III: Validating alternative approaches to actual BCI problems, IEEE
Trans Neural Syst Rehabil Eng., Vol.14(2), pp.153-159.
Blankertz, B.; Müller K.R. & Curio, G. (2009). Neuronal correlates of emotions in human-
machine interaction. BMC Neuroscience, Vol.10(1), pp.80.
Brunner, C.; Scherer, R.; Graimann, B.; Supp, G. & Pfurtscheller, G. (2006). Online control of
a brain-computer interface using phase synchronization. IEEE Trans Biomed Eng.,
Vol.53(12 Pt 1), pp.2501-2506.
SignalProcessing496
Busk, J. & Galbraith, G.C. (1975). EEG correlates of visual-motor practice in man.
Electroencephalogr Clin Neurophysiol,. Vol.38(4), pp.415-22.
Caplan, J.B.; Madsen, J.R.; Schulze-Bonhage, A.; Aschenbrenner-Scheibe, R.; Newman E.L. et
al. (2003). Human theta oscillations related to sensorimotor integration and spatial
learning. J Neurosci., Vol.23(11), pp.4726-736.
Carignan, C.R.; Naylor, M.P. & Roderick, S.N. (2008). Controlling shoulder impedance in a
rehabilitation arm exoskeleton. IEEE International Conference on Robotics and
Automation, Vol.19(23), pp.2453-2458.
Cavanagh, J.F.; Cohen, M.X. & Allen, J.J.B. (2009). Prelude to and Resolution of an Error:
EEG Phase Synchrony Reveals Cognitive Control Dynamics during Action
Monitoring. J. Neurosc., Vol.29(1), pp.98-105.
Cipriani, C.; Zaccone, F.; Micera, S. & Carrozza, M.C. (2008). On the Shared Control of an
EMG-Controlled Prosthetic Hand: Analysis of User–Prosthesis Interaction. IEEE
Trans on Robotics, Vol.24(1), pp.170-184.
Contreras-Vidal, J.L. & Kerick, S.E. (2004). Independent component analysis of dynamic
brain responses during visuomotor adaptation. Neuroimage, Vol.21(3), pp.936-945.
Corder, E.H.; Saunders, A.M.; Strittmatter, W.J.; Schmechel, D.E.; Gaskell, P.C. et al. (1993).
Gene dose of apolipoproteine type 4 allele and the risk of Alzheimer's disease in
late onset families, Science,Vol.261, pp.921–3.
Coyle, S.M.; Ward, T.E. & Markham, C.M. (2007). Brain-computer interface using a
simplified functional near-infrared spectroscopy system. J Neural Eng., Vol.4(3),
pp.219-226.
Crone, N.E.; Miglioretti, D.L.; Gordon, B. & Lesser R.P. (1998). Functional mapping of
human sensorimotor cortex with electrocorticographic spectral analysis. II. Event-
related synchronization in the gamma band. Brain, Vol.121 (12), pp.2301-2315.
Dammann, O. & Leviton, A. (2004). Biomarker epidemiology of cerebral palsy. Ann Neurol.,
Vol.55(2), pp.158-161.
Dammann, O. & Leviton, A. (2006). Neuroimaging and the prediction of outcomes in
preterm infants. N Engl J Med., Vol.355(7), pp.727-729.
Darvas, F.; Ojemann, J.G.; & Sorensen, L.B. (2009). Bi-phase locking - a tool for probing non-
linear interaction in the human brain. NeuroImage, Vol.46(1), pp.123–132.
Deeny, S.P.; Poeppel, D.; Zimmerman, J.B.; Roth, S.M.; Brandauer, J. et al. (2008). Exercise,
APOE, and working memory: MEG and behavioral evidence for benefit of exercise
in epsilon4 carriers. Biol Psychol., Vol.78(2), pp.179-187.
Deeny, S.P.; Hillman, C.H.; Janelle, C.M. & Hatfield, B.D. (2003). Cortico–cortical
communication and superior performance in skilled marksmen:An EEG coherence
analysis. J Sport and Exercise Psychology,Vol.25, pp.188–204.
Deeny, S.P.; Haufler, A.J.; Saffer, M. & Hatfield, B.D. (2009). Electroencephalographic
coherence during visuomotor performance:a comparison of cortico-cortical
communication in experts and novices.J MotBehav. Vol.41, p106-16.
Delorme, A.; Makeig, S. & Sejnowski, T.J. (2001). Automatic artifact rejection for EEG data
using high-order statistics and independent component analysis. Third International
Workshop on Independent Component Analysis and Signal Separation, pp.457-462.
Del Percio, C.; Rossini, P.M.; Marzano, N.; Iacoboni, M.; Infarinato, F. et al. (2008). Is there a
"neural efficiency" in athletes? A high-resolution EEG study. Neuroimage, Vol. 42(4),
pp.1544-1553.
Dengler, T.J.; Gleissner, C.A.; Klingenberg, R.; Sack, F.U.; Schnabel, P.A. et al. (2007).
Biomarkers after heart transplantation: nongenomic. Heart Fail Clin., Vol. 3(1),
pp.69-81.
Eleuteri, E.; Magno, F.; Gnemmi, I.; Carbone, M.; Colombo, M. et al. (2009). Role of oxidative
and nitrosative stress biomarkers in chronic heart failure. Front Biosci., Vol.1(14),
pp.2230-2237.
Fadiga, L. & Craighero, L. (2004). Electrophysiology of action representation. J Clin
Neurophysiol., Vol. 21(3), pp.157-169.
Gasser, T. (2009). Genomic and proteomic biomarkers for Parkinson disease. Neurology,
Vol.72(7), pp.27-31.
Gentili, R.J.; Cahouet, V.; Ballay, Y. & Papaxanthis, C. (2004). Inertial properties of the arm
are accurately predicted during motor imagery. Behav Brain Res., Vol.155(2), pp.231-
239.
Gentili, R.J.; Papaxanthis, C. & Pozzo, T. (2006). Improvement and generalization of arm
motor performance through motor imagery practice. Neuroscience, Vol.137(3),
pp.761-772.
Gentili, R.J.; Bradberry, T.J.; Hatfield, B.D. & Contreras-Vidal, J.L. (2008). A new generation
of non-invasive biomarkers of cognitive-motor states with application to smart
Brain Computer Interfaces. Proceedings of the 16th European Signal Processing
Conference - 2008, Lausanne, Switzerland.
/Eusipco/Eusipco2008/index.html/papers/1569105504.pdf.
Gentili, R.J.; Bradberry, T.J.; Rong, F.; Hatfield, B.D. & Contreras-Vidal, J.L. (2009a).
Decoding of Non-Invasive Functional Brain Biomarkers for Sensorimotor
Adaptation Assessed by MEG. University of Maryland Graduate Research Interaction
Day, p.14.
Gentili, R.J.; Bradberry T.J.; Hatfield, B.D.; & Contreras-Vidal, J.L. (2009b). Brain Biomarkers
of Motor Adaptation Using Phase Synchronization. Proceedings of the IEEE
International Conference of the Engineering in Medicine and Biology Society, September,
2-6, 2009, Minneapolis, Minnesota, USA. Vol.1, pp.5930-3.
Georgiadis, S.D.; Ranta-aho, P.O.; Tarvainen, M.P. & Karjalainen, P.A. (2005). Single-trial
dynamical estimation of event-related potentials: a Kalman filter-based approach.
IEEE Trans Biomed Eng., Vol.52(8), pp.1397-1406.
Georgopoulos, A.P.; Karageorgiou, E.; Leuthold, A.C.; Lewis, S.M.; Lynch, J et
al.(2007).Synchronous neural interactions assessed by magnetoencephalography:a
functional biomarker for brain disorders. JNeuralEng. Vol.4, pp.349-55.
Glass, K.A.; Frishkoff, G.A.; Frank, R.M.; Davey, C.; Dien, J. et al. (2004). A Framework for
Evaluating ICA Methods of Artifact Removal from Multichannel EEG. In. Lecture
Notes in Computer Science. Independent Component Analysis and Blind Signal
Separation, Springer, Vol.3195, pp.1033-40, ISBN 978-3-540-23056-4, Berlin.
Guarracino, F. (2008). Cerebral monitoring during cardiovascular surgery. Curr Opin
Anaesthesiol., Vol. 21(1), pp.50-54.
Hatfield, B.D.; Landers, D.M. & Ray, W.J. (1984). Cognitive processes during self-paced
motor performance: an electroencephalographic profile of skilled marksmen. J Sport
Psychol., Vol.6, pp.42–59.
Signalprocessingfornon-invasivebrain
biomarkersofsensorimotorperformanceandbrainmonitoring 497
Busk, J. & Galbraith, G.C. (1975). EEG correlates of visual-motor practice in man.
Electroencephalogr Clin Neurophysiol,. Vol.38(4), pp.415-22.
Caplan, J.B.; Madsen, J.R.; Schulze-Bonhage, A.; Aschenbrenner-Scheibe, R.; Newman E.L. et
al. (2003). Human theta oscillations related to sensorimotor integration and spatial
learning. J Neurosci., Vol.23(11), pp.4726-736.
Carignan, C.R.; Naylor, M.P. & Roderick, S.N. (2008). Controlling shoulder impedance in a
rehabilitation arm exoskeleton. IEEE International Conference on Robotics and
Automation, Vol.19(23), pp.2453-2458.
Cavanagh, J.F.; Cohen, M.X. & Allen, J.J.B. (2009). Prelude to and Resolution of an Error:
EEG Phase Synchrony Reveals Cognitive Control Dynamics during Action
Monitoring. J. Neurosc., Vol.29(1), pp.98-105.
Cipriani, C.; Zaccone, F.; Micera, S. & Carrozza, M.C. (2008). On the Shared Control of an
EMG-Controlled Prosthetic Hand: Analysis of User–Prosthesis Interaction. IEEE
Trans on Robotics, Vol.24(1), pp.170-184.
Contreras-Vidal, J.L. & Kerick, S.E. (2004). Independent component analysis of dynamic
brain responses during visuomotor adaptation. Neuroimage, Vol.21(3), pp.936-945.
Corder, E.H.; Saunders, A.M.; Strittmatter, W.J.; Schmechel, D.E.; Gaskell, P.C. et al. (1993).
Gene dose of apolipoproteine type 4 allele and the risk of Alzheimer's disease in
late onset families, Science,Vol.261, pp.921–3.
Coyle, S.M.; Ward, T.E. & Markham, C.M. (2007). Brain-computer interface using a
simplified functional near-infrared spectroscopy system. J Neural Eng., Vol.4(3),
pp.219-226.
Crone, N.E.; Miglioretti, D.L.; Gordon, B. & Lesser R.P. (1998). Functional mapping of
human sensorimotor cortex with electrocorticographic spectral analysis. II. Event-
related synchronization in the gamma band. Brain, Vol.121 (12), pp.2301-2315.
Dammann, O. & Leviton, A. (2004). Biomarker epidemiology of cerebral palsy. Ann Neurol.,
Vol.55(2), pp.158-161.
Dammann, O. & Leviton, A. (2006). Neuroimaging and the prediction of outcomes in
preterm infants. N Engl J Med., Vol.355(7), pp.727-729.
Darvas, F.; Ojemann, J.G.; & Sorensen, L.B. (2009). Bi-phase locking - a tool for probing non-
linear interaction in the human brain. NeuroImage, Vol.46(1), pp.123–132.
Deeny, S.P.; Poeppel, D.; Zimmerman, J.B.; Roth, S.M.; Brandauer, J. et al. (2008). Exercise,
APOE, and working memory: MEG and behavioral evidence for benefit of exercise
in epsilon4 carriers. Biol Psychol., Vol.78(2), pp.179-187.
Deeny, S.P.; Hillman, C.H.; Janelle, C.M. & Hatfield, B.D. (2003). Cortico–cortical
communication and superior performance in skilled marksmen:An EEG coherence
analysis. J Sport and Exercise Psychology,Vol.25, pp.188–204.
Deeny, S.P.; Haufler, A.J.; Saffer, M. & Hatfield, B.D. (2009). Electroencephalographic
coherence during visuomotor performance:a comparison of cortico-cortical
communication in experts and novices.J MotBehav. Vol.41, p106-16.
Delorme, A.; Makeig, S. & Sejnowski, T.J. (2001). Automatic artifact rejection for EEG data
using high-order statistics and independent component analysis. Third International
Workshop on Independent Component Analysis and Signal Separation, pp.457-462.
Del Percio, C.; Rossini, P.M.; Marzano, N.; Iacoboni, M.; Infarinato, F. et al. (2008). Is there a
"neural efficiency" in athletes? A high-resolution EEG study. Neuroimage, Vol. 42(4),
pp.1544-1553.
Dengler, T.J.; Gleissner, C.A.; Klingenberg, R.; Sack, F.U.; Schnabel, P.A. et al. (2007).
Biomarkers after heart transplantation: nongenomic. Heart Fail Clin., Vol. 3(1),
pp.69-81.
Eleuteri, E.; Magno, F.; Gnemmi, I.; Carbone, M.; Colombo, M. et al. (2009). Role of oxidative
and nitrosative stress biomarkers in chronic heart failure. Front Biosci., Vol.1(14),
pp.2230-2237.
Fadiga, L. & Craighero, L. (2004). Electrophysiology of action representation. J Clin
Neurophysiol., Vol. 21(3), pp.157-169.
Gasser, T. (2009). Genomic and proteomic biomarkers for Parkinson disease. Neurology,
Vol.72(7), pp.27-31.
Gentili, R.J.; Cahouet, V.; Ballay, Y. & Papaxanthis, C. (2004). Inertial properties of the arm
are accurately predicted during motor imagery. Behav Brain Res., Vol.155(2), pp.231-
239.
Gentili, R.J.; Papaxanthis, C. & Pozzo, T. (2006). Improvement and generalization of arm
motor performance through motor imagery practice. Neuroscience, Vol.137(3),
pp.761-772.
Gentili, R.J.; Bradberry, T.J.; Hatfield, B.D. & Contreras-Vidal, J.L. (2008). A new generation
of non-invasive biomarkers of cognitive-motor states with application to smart
Brain Computer Interfaces. Proceedings of the 16th European Signal Processing
Conference - 2008, Lausanne, Switzerland.
/Eusipco/Eusipco2008/index.html/papers/1569105504.pdf.
Gentili, R.J.; Bradberry, T.J.; Rong, F.; Hatfield, B.D. & Contreras-Vidal, J.L. (2009a).
Decoding of Non-Invasive Functional Brain Biomarkers for Sensorimotor
Adaptation Assessed by MEG. University of Maryland Graduate Research Interaction
Day, p.14.
Gentili, R.J.; Bradberry T.J.; Hatfield, B.D.; & Contreras-Vidal, J.L. (2009b). Brain Biomarkers
of Motor Adaptation Using Phase Synchronization. Proceedings of the IEEE
International Conference of the Engineering in Medicine and Biology Society, September,
2-6, 2009, Minneapolis, Minnesota, USA. Vol.1, pp.5930-3.
Georgiadis, S.D.; Ranta-aho, P.O.; Tarvainen, M.P. & Karjalainen, P.A. (2005). Single-trial
dynamical estimation of event-related potentials: a Kalman filter-based approach.
IEEE Trans Biomed Eng., Vol.52(8), pp.1397-1406.
Georgopoulos, A.P.; Karageorgiou, E.; Leuthold, A.C.; Lewis, S.M.; Lynch, J et
al.(2007).Synchronous neural interactions assessed by magnetoencephalography:a
functional biomarker for brain disorders. JNeuralEng. Vol.4, pp.349-55.
Glass, K.A.; Frishkoff, G.A.; Frank, R.M.; Davey, C.; Dien, J. et al. (2004). A Framework for
Evaluating ICA Methods of Artifact Removal from Multichannel EEG. In. Lecture
Notes in Computer Science. Independent Component Analysis and Blind Signal
Separation, Springer, Vol.3195, pp.1033-40, ISBN 978-3-540-23056-4, Berlin.
Guarracino, F. (2008). Cerebral monitoring during cardiovascular surgery. Curr Opin
Anaesthesiol., Vol. 21(1), pp.50-54.
Hatfield, B.D.; Landers, D.M. & Ray, W.J. (1984). Cognitive processes during self-paced
motor performance: an electroencephalographic profile of skilled marksmen. J Sport
Psychol., Vol.6, pp.42–59.