Tạp chí khoa học công nghệ và thực phẩm tập 22
Bạn đang xem bản rút gọn của tài liệu. Xem và tải ngay bản đầy đủ của tài liệu tại đây (4.84 MB, 165 trang )
TẠP CHÍ KHOA HỌC CƠNG NGHỆ VÀ THỰC PHẨM
Tập 22 - Số 4 (12/2022)
MỤC LỤC
1.
Tran Thi Kim Nhan, Nguyen Thi Hai Hoa, Hoang Thi Ngoc Nhon Optimization of enzyme-assisted extraction of flavonoid from
Glinus oppositifolius.
3
2.
Bui Thi Phuong Quynh, Le Thi Kim Anh, Tran Nguyen An Sa Comparison of catalytic activities of magnetic iron oxides in phenol
degradation.
12
3.
Truong Thi Dieu Hien - Potential of spent coffee ground
Pleurotus sajor-caju cultivation.
in
20
4.
Lê Thị Thúy, Huỳnh Tuấn Qui, Trần Uyển Nhi - Nghiên cứu xây
dựng quy trình nhân giống in vitro cây trầu bà cung đàn
(Philodendron ‘Jungle boogie’)
28
5.
Trịnh Thị Hương, Nguyễn Ngọc Hoàng Vân, Trần Trọng Tuấn - Ảnh
hưởng của chất điều hoà sinh trưởng thực vật đến q trình nhân
giống in vitro cây ba kích (Morinda officinalis How.).
37
6.
Mai Minh Trẫm, Phạm Thị Cẩm Hoa, Hoàng Thị Ngọc Nhơn Nghiên cứu điều kiện chiết coumarin từ lá đơn đỏ (Excoecaria
cochinchinesis).
47
7.
Nguyễn Đào Thanh Hương, Hồ Thị Nguyệt, Trương Minh Ngọc Ảnh hưởng của một số điều kiện chiết xuất đến hàm lượng
polyphenols và flavonoids thu được trong dịch chiết lá cây Costus
pictus D. Don trồng tại Việt Nam.
55
8.
La Bội Sương, Nguyễn Cẩm Hường, Hoàng Thị Ngọc Nhơn - Tối
ưu điều kiện trích ly lutein có hỗ trợ siêu âm từ lá đinh lăng Polyscias
fruticosa (L.) Harms.
64
9.
Đỗ Thị Mai Trinh, Trương Minh Ngọc, Nguyễn Thị Liên, Nguyễn
Thị Hạnh - Tối ưu hóa điều kiện tách chiết saponin triterpenoid từ bã
hạt cây sở (Camellia oleifera) bằng phương pháp đáp ứng bề mặt
(RSM).
76
1
10.
Nguyễn Công Bỉnh, Đinh Hữu Đông, Trần Thị Phương Kiều, Đào
Thị Tuyết Mai, Trần Quốc Đảm - Tối ưu hóa điều kiện thủy phân
collagen từ da cá ngừ vây vàng (Thunnus albacares) theo mơ hình
Box-Behnken.
88
11.
Trần Thị Ngọc Mai, Trần Thị Thúy Nhàn, Trương Thị Diệu Hiền Nghiên cứu nâng cao hiệu quả xử lý antimony trong nước thải nhà
máy sợi.
97
12
Phạm Duy Thanh, Nguyễn Mậu Trung Chính, Phạm Thị Ngọc Hân,
Phùng Lê Thúy Hằng, Nguyễn Lan Hương - Nghiên cứu khả năng
xử lý nước thải chăn nuôi heo sau xử lý kỵ khí bằng q trình tăng
trưởng dính bám của Spirulina platensis có hỗ trợ chiếu sáng bằng
đèn LED.
105
13.
Lê Minh Thanh, Nguyễn Hữu Sự, Ngơ Hồng Ấn - Phân tích và đánh
giá hiệu năng của NOMA-CRN sử dụng học sâu.
115
14.
Bùi Quốc Tú, Nguyễn Huy Hồng, Trương Quang Phúc, Lê Quang
Bình, Hồ Nhựt Minh - Nhận diện biển báo và tín hiệu đèn giao thông
sử dụng YOLOv4 trên phần cứng Jetson TX2.
132
15.
Mai Văn Lưu, Nguyễn Thanh Vân, Nguyễn Thuỳ Trang - Ảnh hưởng
của độ rộng xung bơm lên biến đổi quang nhiệt trong hoạt chất laser
rắn.
143
16.
Nguyễn Quốc Tiến, Đào Thị Trang - Tổng quan về môđun nội xạ và
các mở rộng của nó.
149
17.
Vũ Văn Quế - Sáng tạo, đổi mới, bản lĩnh của Hồ Chí Minh trong
tác phẩm “Sửa đổi lối làm việc”.
156
2
Journal of Science Technology and Food 22 (4) (2022) 3-11
OPTIMIZATION OF ENZYME-ASSISTED EXTRACTION
OF FLAVONOID FROM Glinus oppositifolius
Tran Thi Kim Nhan, Nguyen Thi Hai Hoa,
Hoang Thi Ngoc Nhon*
Ho Chi Minh City University of Food Industry
*Email:
Received: 17 May 2022; Accepted: 15 June 2022
ABSTRACT
Glinus oppositifolius, a potential medicinal herb used in many countries around the
world, contains lots of bioactive compounds. One of the essential ingredients was flavonoid,
a group of natural compounds that have many beneficial effects on human health, such as
antioxidant functions, antibacterial, anti-inflammatory, and anti-cancer. The independent
variables, including enzyme concentration (10-50 UI/g), temperature (50-70 °C), and time (60120 min), were investigated. The flavonoid extraction conditions were optimized with the
CCD (Central Composite Design) design by response surface method (RSM). The results
indicated that the optimal extraction conditions were found to be enzyme concentration (24.12
UI/g), temperature (68 °C), and time (99.8 min). Under such conditions, the highest content
of flavonoid is 26.13 ± 0.05 mg/g of dry matter. These results suggest that enzyme treatment
could help extract valuable components such as flavonoids that hold good potential for use in
the food, cosmetic and pharmaceutical industries.
Keywords: Cellulase enzyme, extraction, flavonoids, Glinus oppositifolius.
1. INTRODUCTION
Glinus oppositifolius, an herbaceous plant with slender stem and branches, grows widely
in Vietnam and tropical areas of Asia, Africa, and Australia [1]. It is distributed along with the
coastal provinces, from the Hong River to the Mekong Delta in Vietnam. It is used as a
vegetable and a precious medicine to treat some diseases. The extract has beneficial effects on
digestion, aperitif, antibiotic, liver laxative, mouth sores, periodontitis, bleeding teeth, and
diuretic [2]. Its extract has long been used as an antipyretic agent in traditional medicine for
liver disease and jaundice. The active ingredients in this herbal medicine have been extracted
and used in combination with other medicinal herbs to make soft capsules or tablets for modern
medicine. It is known that G. oppositifolius has a prosperous chemical composition (alkaloids,
saponins, steroids, anthocyanins, etc.) and especially contains large amounts of flavonoids
with many important biological activities.
Flavonoid, a natural yellow pigment synthesized from phenylalanine [3], is a natural
compound found in plants. More than 6000 flavonoids have been founded in vegetables, seeds,
and fruits [4]. They reveal multiple positive effects because of their antioxidant and free radical
scavenging action. So, it is beneficial for human health. This compound also has antiinflammatory effects, antiviral or anti-allergic, and a protective role against cardiovascular
disease, cancer, and various pathologies [5].
3
Tran Thi Kim Nhan, Nguyen Thi Hai Hoa, Hoang Thi Ngoc Nhon
Figure 1. Glinus oppositifolius
In recent years, enzyme techniques have been increasingly interesting in studies on
extracting bioactive compounds from plants. Enzyme-assisted extraction offers a safe, green,
and novel approach to extracting bioactive compounds. This technique is also safe for targeted
substances and users in both laboratory and industrial conditions [6]. However, their recovery
from the plant matrix is generally limited by the presence of a physical barrier (cell wall).
Thus, the use of novel extraction procedures to enhance their release is essential. Thus, the
enzyme-assisted extraction method seems suitable for obtaining and applying bioactive
substances such as flavonoids from plants such as G. oppositifolius. Therefore, this work aims
to assess the potential use of cellulase to improve the extraction efficiency of bioactive
compounds from G. oppositifolius, and to find out and optimize the flavonoid extraction
conditions from the material to offer a foundation for further studies on applying this
compound in practice.
2. MATERIALS AND METHODS
2.1. Materials
Fresh G. oppositifolius in green was collected in Chau Phu district, An Giang province,
in July 2021. After being harvested, G. oppositifolius would be cleaned by washing to remove
impurities. The leaves were dried at 60 ºC until under 10% moisture. The fine powder was
obtained by grinding by a mechanical grinder (less than 80 mesh size) and stored in PE bags,
protected from light and powder for the experiments.
Chemicals such as sodium carbonate (Na2CO3), sodium nitrite (NaNO2), aluminum
chloride (AlCl3), sodium hydroxide (NaOH), and methanol 99.5% were procured from Fisher
Scientific (USA). Quercetin was purchased from Sigma-Aldrich Chemie GmbH (Steinheim,
Germany), and cellulase (10000U/g) from Antozyme Biotech Pvt.Ltd (India).
2.2. Methods
2.2.1. Effects of enzyme-assisted extraction
1g of raw materials (calculated by dry matter-dm), adding water as a solvent with the
ratio of material/solvent 1/30 (w/v). The extraction process was conducted with the support of
cellulase at the pH range investigated (3, 4, 5, 6, 7), and the concentrations of the studied
enzyme (10, 20, 30, 40, 50 UI/g) at the temperature (40, 50, 60, 70, 80 ºC) in the period of (30,
60, 90, 120, 150 minutes). Then, the mixture was centrifuged at 5500 rpm/5 min. After
centrifugation, the solution was filtered through Whatman No.1 filter (China) to collect the
filtrate. Then, the total flavonoid content (TFC) content was determined by UV-Vis
4
Optimization of enzyme-assisted extraction of flavonoid from Glinus oppositifolius
spectrophotometer (Genesys 10s thermo, Made in the USA) to select the appropriate
conditions for the flavonoid extraction.
2.2.2. Experimental design
RSM is a proper statistical and mathematical technique to evaluate multiple independent
variables on the dependent variable and thus estimate the maximum yield of the process under
a specific limited condition. The central composite design (CCD) is a common method to
design experiments for building a quadratic model in RSM with response variables. CCD
contains an embedded or fractional factorial design with a center point augmented with a group
of new extreme values (low and high) for each factor in the design to allow curvature
estimation, and the experimental matrix was built using JMP 10 software. Three independent
variables include enzyme concentration (X1), temperature (X2), and time (X3). The marginal
values and experimental design with independent variables, their ranges, and 20 experiments
(6 experiments at the central point) were carried out randomly to optimize the extraction
process.
2.2.3. Total flavonoids content determination
Total flavonoid content was measured by the aluminum chloride colorimetric assay
(Zhishen et al. 1999) using quercetin as a standard flavonoid. 1 mL of the extract was added
to 4 mL of distilled water, and 0.3 mL of 5% NaNO2, and the mixture was incubated at room
temperature for 5 min. After incubation, the mixture was treated with 0.3 mL 10% AlCl3
solution. After 1 min, 2 mL of 1 M NaOH was added, and 2.4 mL distilled water was added
to the solution. The solution was mixed well, and the absorbance was measured at 415 nm
against blank. The assay was performed based on the 6-point standard calibration curve of
quercetin. The TFC was expressed as quercetin equivalents (QE) in milligrams per gram of
dry material [7].
2.2.4. Experimental design and statistical analysis
The experiments were repeated three times. The results were presented as mean ± SD.
Using IBM SPSS Statistics 20.0 software to analyze experimental data and evaluate the
difference between samples (p< 0.05). JMP 10 software was used to analyze data in
experimental optimization. The graph was drawn by Microsoft Excel 2016.
3. RESULTS AND DISCUSSION
3.1. Effects of enzyme and enzyme concentration on the flavonoids recovery yield
The effects of cellulase on TFC are shown in Table 1. There is a significant difference
between the samples treated with cellulase (19.93 mgQE/gdm) and the control (12.24 mgQE/gdm).
Thus, the cellulase positively supported the extraction efficiency of flavonoids from
G. oppositifolius. The extraction process was carried out with water as a solvent, ratio
1/30 (g/mL), pH 5 at 60 in 60 min.
Table 1. Effects of cellulase on TFC
Samples
Flavonoid content (mgQE/gdm)
Control
12.24 ± 0.65a
Cellulase
19.93 ± 1.20b
5
Tran Thi Kim Nhan, Nguyen Thi Hai Hoa, Hoang Thi Ngoc Nhon
Yields of flavonoids mgQE/gdm
The enzyme concentration also significantly affected the obtained flavonoid content.
According to Puri et al., the enzyme disrupted the cell wall and membrane to release bioactive
components into the solvent with high-yield recovery during enzyme-assisted extraction [8].
Plant cell walls are complex and heterogeneous, mainly composed of cellulose, hemicellulose,
and lignin. These components were considered barriers, hindering some compounds'
extraction [9]. Enzymes cause break plant cells to be fully exposed to the solvent and
hydrolyze polysaccharides and lipids, promoting the release of intracellular components [10].
From Figure 2, the obtained flavonoid concentration gradually increased with the increase of
enzyme concentration and reached 23.70 mgQE/gdm at 20 UI/g. Then, the flavonoid
concentration decreased from 30 UI/g to 50 UI/g (11.34 mgQE/gdm). The effectivity of
enzyme-assisted extraction was affected by its concentration and substrate concentration.
While low enzyme concentrations resulted in a slow reaction rate and incomplete process, the
high enzyme concentration caused fast and thorough speed until a certain percentage of
enzymes. Thus, too much enzyme was unchanged in extracted targeted components and
wasteful of the extraction process. With the appropriate enzyme concentration, an enzymeassisted extraction method was an excellent approach to enhancing extraction efficiency [11].
30
25
d
c
c
20
b
15
a
10
5
0
10
20
30
40
Enzyme concentration(UI/g)
50
Figure 2. Effects of enzyme concentration on TFC
Note: Different letters a, b, c, and d in the same column represent statistically
significant differences at p <0.05. This annotation applies to all charts.
3.2. Effects of times and temperatures on the flavonoids recovery yield
The TFC increased from 10.19 mgQE/gdm to 24.60 mgQE/gdm after an extraction time of
30 to 90 minutes (Figure 3). However, total TFC recovery tended to decrease to 23.52 mgQE/gdm
up to 120 minutes. The extraction process was carried out with water as a solvent, the ratio of
1/30 (g/mL), the concentrations of the studied enzyme 20 UI/g (Fig.2), and pH 5 at 60 in 60 min.
A suitable period is essential for hydrolysis to occur entirely and thoroughly in the extraction
stage. Long incubation time causes extract loss, the substrate is gradually decomposed, and
produced substances during hydrolysis inhibit enzyme activity [12]. In addition, prolonged time
will dissolve unwanted substances, affecting the extraction process [13]. On the other hand, the
short incubation time is not enough for a thorough reaction, resulting in a low yield. In this
study, 90 minutes of extraction was selected for further experiments. The result was in line
with Nguyen Nhat Minh Phuong et al. [14]. The obtained TFC content peaked at 25.44
mgQE/gdm at 60 °C, but that figure did not increase at the higher temperature (Figure 4).
Temperature reduces solvent viscosity and increases mass transfer and solvent penetration into
cells. Thus, bioactive compounds are easily dissolved and diffused into the solvent. However,
too high or too low temperature does not affect it well. For instance, an enzyme is a biological
molecule with the nature of a protein, so it is quickly impacted by heat, especially at high
temperatures. It would cut off the hydrogen bonds between the water surface and proteins and
6
Optimization of enzyme-assisted extraction of flavonoid from Glinus oppositifolius
30
c
c
Yields of flavonoids mgQE/gdm
Yields of flavonoids mgQE/gdm
amino acids [15]. On the other hand, the enzyme's active center would not be able to work
well to break the cellulose chain in the plant cells at a low temperature. Therefore, the
appropriate temperature for cellulase in this study was 60 °C.
c
25
b
20
15
a
10
5
0
c
30
c
b
b
25
20
15
a
10
5
0
30
60
90
120
150
40
50
Time (minutes)
60
70
80
Temperature (oC)
Figure 3. Effects of time extraction on TFC
Figure 4. Effects of temperature extraction on TFC
3.3. Effects of different pH on extraction recovery yield of TFC
The effects of pH on flavonoid extraction from G. oppositifolius are shown in Figure 5. The
shape of an enzyme would be changed in a too acidic or too alkaline medium, which impacted
the extraction efficiency [16]. The TFC content increased to 23.80 mgQE/gdm at pH 5. This
figure continued to rise at pH 6, but there are no significant differences from that at pH 5. The
results were consistent with the study of Pan et al. (2014) [17]. Therefore, pH 5 is considered a
suitable condition for the following experiments. Each enzyme has its own optimal active pH
range; changing the pH value from the optimal pH point reduces the enzyme's ability to work
and even denatures it. This result is similar to the study of Yan et al. (2012) [18], investigating
the effect of pH on the activity of cellulase enzyme-produced strains of the fungus
Trichoderma reesei; pH 5 is the optimal pH for the best cellulose hydrolysis for this enzyme.
Yields of flavonoid
mgQE/gCK
30
d
d
25
c
20
15
b
a
10
5
0
3
4
5
pH
6
7
Figure 5. Effects of pH on recovery yield of TFC
3.4. The optimization of enzyme-assisted extraction of TFC
According to the CCD complex model, the total flavonoid content obtained from
different optimal conditions is presented in the modeling table.
Based on suitable investigated conditions in the above single-factor experiments, the
parameters such as enzyme concentration, temperature, and extraction time, were selected for
the optimal study of extraction conditions to obtain the highest TFC content. The appropriate
7
Tran Thi Kim Nhan, Nguyen Thi Hai Hoa, Hoang Thi Ngoc Nhon
ranges of these factors are presented in Table 2. The optimal experiment was designed in CCD
style by the RSM method.
Table 2. Response surface central composite design and experimental flavonoids yield
Independent variables
No.
Concentration
(UI/g)
Temperature
(C)
Time
(min)
Y (Yield of flavonoids,
mgQE/gdm)
1
10
40
60
18.96
2
30
40
60
18.83
3
10
60
60
17.74
4
30
60
60
22.51
5
10
40
120
22.98
6
30
40
120
19.72
7
10
60
120
21.89
8
30
60
120
22.79
9
3.18
50
90
17.19
10
36.82
50
90
22.75
11
20
33.20
90
18.35
12
20
66.80
90
22.73
13
20
50
39.54
20.53
14
20
50
140.46
22.71
15
20
50
90
24.42
16
20
50
90
25.04
17
20
50
90
26.35
18
20
50
90
24.93
19
20
50
90
24.95
20
20
50
90
24.43
The factors with p < 0.05 were considered to influence the objective function, and the
influencing factors with regression coefficients were determined by the multivariable
regression method, obtained as follows:
Y = 25.16 + 1.09X1 + 1.15X2 + 1.62X3 + 0.76X2X3 – 1.13X12 – 1.17X22 – 1.11X32
After conducting ANOVA analysis using JMP software, the following results were
obtained: TFC obtained was 26.63 mgQE/gdm at optimal conditions with enzyme
concentration (24.12 UI/g), temperature (68 °C), and time (99.8 minutes). The response
surface model showed the influence of the investigated factors on the obtained total flavonoid
content in the extract (Figure 6). The relationship between the repeat factors and flavonoids,
while contour lines help visualize the shape of the response surface. Therefore, relying on
surfaces helps assess the fit of the model [19].
8
Optimization of enzyme-assisted extraction of flavonoid from Glinus oppositifolius
Figure 6. Response surface 3D (a, b, c) and 2D contour (d, e, f) plots showing the effect
of different extraction parameters (X1: concentration, UI/g; X2: temperature, oC and X3
time, min) added on the response Y.
Figure 7. The predictive model of TFC extraction
For verification of the obtained parameters, experiments under optimized conditions were
carried out (replicated three times). The obtained TFC of 26.13 mgQE/gdm, compared with
the predicted TFC of 26.63 mgQE/gdm from the regression equation, accounting for 2.94%
(<5%) in the difference. It showed that the obtained TFC content was completely consistent
with the values predicted by the quadratic regression model. Thus, the quadratic equation to
predict the TFC from G. oppositifolius under optimal conditions has practical value.
4. CONCLUSION
This study found the optimal conditions for flavonoid enzyme-assisted extraction from
G. oppositifolius by cellulase enzyme. The RSM was used to find optimized conditions for
flavonoid extraction, resulting in the optimal parameters of enzyme concentration (24.12
9
Tran Thi Kim Nhan, Nguyen Thi Hai Hoa, Hoang Thi Ngoc Nhon
UI/g), temperature (68 oC), and time (99.8 min). At optimal conditions, the TFC was
maximized at 26.13 ± 0.05 mg/gdm. The results showed that G. oppositifolius extract
contained a significant amount of flavonoids. The obtained results are mainly to find the
optimal conditions for flavonoid extraction by cellulase enzyme to the maximum TFC content.
More studies need to be conducted to obtain comprehensive characteristics of flavonoids from
G. oppositifolius to apply to functional foods and pharmaceuticals.
REFERENCES
1. Ridgway R. and Rowson J. - Glinus oppositifolius L. root - a substitute for senega,
Journal of Pharmacy Pharmacology 8 (1) (1956) 915-926.
2. Mall T.P. and Tripathi S.C. - Exploitable vegetables for Food and health in Bahraich
(UP) India, Agricultural Science Research Journal 6 (10) (2016) 241-246.
3. Harborne J.B. and Turner B.I. - Plant Chemosystematics, Academic Press, London,
1984.
4. Dixon R.A. and Pasinetti G.M. - Flavonoids and isoflavonoids: from plant biology to
agriculture and neuroscience, Plant Physiology 154 (2) (2010) 453-457.
5. Chávez-González M.L., Sepúlveda L., Verma D.K., Luna-García H.A., RodríguezDurán L.V., Ilina A., and Aguilar C.N. - Conventional and emerging extraction
processes of flavonoids, Processes 8 (4) (2020) 434.
6. Vergara-Barberán M., Lerma-García M., Herrero-Martínez J., and Simó-Alfonso E. Use of an enzyme-assisted method to improve protein extraction from olive leaves,
Food Chemistry 169 (2015) 28-33.
7. Simlai A., Chatterjee K., and Roy A. - A comparative study on antioxidant potentials
of some leafy vegetables consumed widely in India, Journal of Food Biochemistry 38
(3) (2014) 365-373.
8. Puri M., Sharma D., and Barrow C.J. - Enzyme-assisted extraction of bioactives from
plants, Trends in Biotechnology 30 (1) (2012) 37-44.
9. Khalil H., Lai T., Tye Y., Rizal S., Chong E., Yap S., Hamzah A., Fazita M., and
Paridah M. - A review of extractions of seaweed hydrocolloids: Properties and
applications, Express Polymer Letters 12 (4) (2018).
10. Nadar S.S., Rao P., and Rathod V.K. - Enzyme assisted extraction of biomolecules as
an approach to novel extraction technology: A review, Food Research International
108 (2018) 309-330.
11. Panja P. - Green extraction methods of food polyphenols from vegetable materials,
Current Opinion in Food Science 23 (2018) 173-182.
12. Duong Thi Ngoc Hanh and Nguyen Minh Thuy - The use of α-amylase enzyme in starch
hydrolysis from Red rice, Scientific Journal of Can Tho University (2014) 61-67.
13. Hahn T., Lang S., Ulber R., and Muffler K. - Novel procedures for the extraction of
fucoidan from brown algae, Process Biochemistry 47 (12) (2012) 1691-1698.
14. Phuong Nguyen Minh Nhat, Hoang Che Van, Binh Ly Nguyen, and Ai Chau Tran
Diem - Effect of pectinase enzyme treament to juice yield and fermentation conditions
to the quality of mango wine (Mangifera indica), Can Tho University Journal of
Science 20 (2011) 127-136.
15. Al-Farsi M.A. and Lee C.Y. - Optimization of phenolics and dietary fibre extraction
from date seeds, Food Chemistry 108 (3) (2008) 977-985.
10
Optimization of enzyme-assisted extraction of flavonoid from Glinus oppositifolius
16. Nguyen Thi Ngoc Thuy, Nguyen Thi Thu Huyen, Truong Quang Duy, Phan Huynh
Thuy Nga, and Tu Cao Thi Cam - Effect of solvent and pH value on extract of
antioxidant activity compounds from perilla (Perilla frutescens) Journal of Science
Techology and Food 14 (1) (2018) 66-74.
17. Pan S. and Wu S. - Cellulase-assisted extraction and antioxidant activity of the
polysaccharides from garlic, Carbohydrate polymers 111 (2014) 606-609.
18. Zhong-Li Y., Xiao-Hong C., Qing-Dai L., Zhi-Yan Y., Yu-Ou T., and Juan Z. - A
shortcut to the optimization of cellulase production using the mutant Trichoderma
reesei YC-108, Indian Journal of Microbiology 52 (4) (2012) 670-675.
19. Baş D. and Boyacı I.H. - Modeling and optimization I: Usability of response surface
methodology, Journal of Food Engineering 78 (3) (2007) 836-845.
TÓM TẮT
NGHIÊN CỨU TỐI ƯU HĨA CÁC ĐIỀU KIỆN TRÍCH LY FLAVONOIDS
TỪ Glinus oppositifolius VỚI SỰ HỖ TRỢ CỦA ENZYME
Trần Thị Kim Nhân, Nguyễn Thị Hải Hịa, Hồng Thị Ngọc Nhơn*
Trường Đại học Công nghiệp Thực phẩm TP.HCM
*Email:
Rau đắng đất (Glinus oppositifolius) là một loại cây dược liệu tiềm năng được sử dụng
phổ biến ở nhiều nước trên thế giới. Thành phần trong rau đắng đất chứa nhiều hợp chất hữu
cơ mang hoạt tính sinh học, trong đó có flavonoid - nhóm hợp chất tự nhiên có nhiều tác
dụng tốt cho sức khỏe con người, trong đó nổi bật nhất là các chức năng chống oxy hóa,
kháng khuẩn, chống viêm nhiễm và ức chế tăng sinh của các tế bào ung thư. Để thu hồi được
một lượng các hợp chất flavonoid ở mức cao nhất từ cây rau đắng đất flavonoids, nghiên
cứu đã tiến hành trích ly kết hợp với sự hỗ trợ của enzyme cellulase trong q trình trích ly
flavonoids từ rau đắng đất và tối ưu hóa. Các thơng số được khảo sát bao gồm: nồng độ
enzyme (10-50 UI/g), nhiệt độ (50-70 oC), thời gian (60-120 phút). Điều kiện tối ưu trích ly
flavonoids được thiết kế kiểu CCD (Central Composite Design) bằng phương pháp bề mặt đáp
ứng (RSM), sử dụng phần mềm JMP 10. Kết quả nghiên cứu đã xác định được nồng độ
enzyme, cùng nhiệt độ và thời gian trích ly tương ứng là: 24,12 UI/g, (68 °C) và 99,8 phút.
Trong điều kiện tối ưu như thế có thể thu được 26,13 ± 0,05 mg/gck là điều kiện tối ưu để trích
ly được hàm flavonoid cao nhất.
Từ khóa: Enzyme cellulase, flavonoid, Glinus oppositifolius, rau đắng đất, trích ly.
11
Journal of Science Technology and Food 22 (4) (2022) 12-19
COMPARISON OF CATALYTIC ACTIVITIES OF MAGNETIC
IRON OXIDES IN PHENOL DEGRADATION
Bui Thi Phuong Quynh, Le Thi Kim Anh, Tran Nguyen An Sa*
Ho Chi Minh City University of Food Industry
*Email:
Received: 6 June 2022; Accepted: 5 September 2022
ABSTRACT
Magnetic iron oxide-based materials have attracted great attention in catalysis due to their
high activity, large availability, and easy catalyst collection and recycling. This work reports
catalytic activities of magnetic iron oxides, which were synthesized via two different routes
involving organic stabilizers, for the heterogeneous Fenton-like oxidation of phenol. Two kinds
of catalysts, including crystalline Fe3O4 and amorphous nano-sized iron oxide particles, were
formed according to the XRD and SEM data. Effects of reaction time, hydrogen peroxide
amount, and solid catalyst on phenol degradation efficiency using the as-synthesized materials
were investigated. The results showed that the synthesized crystalline Fe3O4 particles (1–5 μm)
provided a higher overall phenol removal efficiency than the amorphous nano-sized iron oxide
under similar reaction conditions. However, the initial oxidation rate was much faster by using
the amorphous one. More than 98% phenol removal was obtained with the crystalline Fe3O4
after 60 min, while a similar efficiency was also achieved with the amorphous nano-sized iron
oxide after 15 min but at significantly higher catalyst and H2O2 amounts.
Keywords: Fenton reaction, phenol degradation, iron oxides, magnetic.
1. INTRODUCTION
The great development of science and technology has a positive impact on the
enhancement of human life quality these days; however, the world is also facing unexpected
side effects of severe environmental pollution. Therefore, environmental protection and
treatment have become a very urgent and important task for scientists and researchers
worldwide. Phenols and phenol derivatives are very common pollutants discharged from various
industrial processes such as petroleum refining, petrochemicals, production of pharmaceuticals,
paper, plastics, coloring preparations, detergents, pesticides, and herbicides [1, 2]. To remove
phenol compounds from wastewaters, a number of methods, including oxidation by oxygen in
aqueous solution, electrochemical oxidation, adsorption, biodegradation, and Fenton (or Fentonlike) oxidation, have been studied and implemented [1, 3].
Recently, a heterogeneous Fenton-like process has emerged as a powerful solution for
removing organic pollutants such as phenol and phenol derivatives. This process employed
hydrogen peroxide and solid redox catalysts to degrade organic matters [4]. The catalytic
decomposition of H2O2 results in the formation of hydroxyl (·OH) and per hydroxyl radicals
(·HO2), which are robust oxidants to mineralize organic matters into H2O and CO2 [3]. Iron
oxide-based Fenton catalysts have always received great interest for both research and practical
applications, especially in environmental treatment, owing to their effectiveness, large
availability, and reasonable cost [5]. Moreover, the magnetic ferric oxides are more
advantageous for accessible collection and recycling of the used materials. Zelmanov et al.
12
Comparison of catalytic activities of magnetic iron oxides in phenol degradation
reported the high performance of iron oxide-based nanoparticles as catalysts for the degradation
of ethylene glycol and phenol [6]. W. Wang et al. reported the synthesis and utilization of nano
Fe3O4 materials, without using any surfactant or capping agent during the synthesis process, as
a heterogeneous Fenton catalyst to remove phenol at a wide pH range [5]. In another work,
Guohui Qi et al. studied phenol degradation in microbial fuel cells with a Fe3O4-reduced
graphene oxide cathodic catalyst [7].
Many forms of iron oxides (such as goethite, hematite, magnetite, and ferrihydrite) have
been found to be capable of transforming H2O2 into reactive free radicals. According to
literature, this capacity is governed by some important properties such as surface area, particle
size, and crystallinity. These properties depend essentially on the synthesis approach [8]. In this
study, two synthesis routes were adopted to fabricate magnetic iron oxide catalysts and their
application in the Fenton-like oxidation of phenol. Oxalic acid and polyvinyl pyrrolidone (PVP)
were employed as stabilizers in the synthesis process as these substances contain groups that have
a strong coordination affinity to ferric ions and thus possibly prevent them from aggregating into
large crystals [9, 10]. The resulting materials were characterized using XRD and SEM. In
application for phenol degradation, effects of reaction conditions including reaction time,
hydrogen peroxide concentration, and catalyst amount, are investigated in detail.
2. MATERIALS AND METHODS
2.1. Chemicals
Phenol (99%), oxalic acid (99,5%), hydrogen peroxide (30%), iron (II) sunfat
heptahydrate. (99%), potassium ferricyanide (99,5%), 4-aminoantipyrine (99%), ammonia
solution (25%), ammonium chloride (99,5%) and polyvinyl pyrrolidone (PVP) were purchased
from Xilong Chemical Co.Ltd. (Shantou, China).
2.2. Synthesis of iron oxides
In the first method, iron oxide was fabricated by using NH4OH as a precipitating agent and
oxalic acid as an electrostatic stabilizer [9]. Firstly, a solution of 50 mL of H2O containing 2.28 g
C2H2O4.2H20 was stirred, heated to 50 oC, and subsequently mixed with a solution of 50 mL
H2O containing 5.56 g FeSO4.7H2O. Next, the ammonia solution was added drop-wise to the
mixture. The received precipitates were washed several times with DI water until the pH reached
the neutral value before being dried in an oven at 110 °C for 3 h. Finally, the powder was
calcined at 300 °C for 2h and the resulting iron oxide was labeled S1.
In another method, iron oxide was synthesized following the procedure previously used to
fabricate Fe3O4 nanoparticles by J. Liu et al. [10]. A solution of 0.02 M NaOH, 2.78 g
FeSO4.7H2O, and 1.5 g PVP was stirred and heated at 70 oC until the mixture was completely
dissolved. Then, the solution was transferred to a thermostatic bath and stabilized at 70 oC for
2 h. The resulting suspension was centrifuged and collected precipitates were washed with
ethanol and distilled water several times until pH reached the neutral value. Finally, the received
powder was dried in the oven at 50 oC and the resulting iron oxide was labeled S2.
2.3. Evaluation of influencing factors
Experiments for phenol degradation were performed as follows. A determined mass of iron
oxides and a determined volume of H2O2 solution were added together to a 40 mL aqueous
solution of phenol in a conical flask. The mixture was shaken for a predetermined time (KS260,
German) and then the catalyst was separated from the solution by centrifugation at 5000 rpm
for 5 min (HERMLE Z206A, German). The supernatant was collected for phenol analysis
13
Bui Thi Phuong Quynh, Le Thi Kim Anh, Tran Nguyen An Sa
referred to the Vietnam Standard TCVN 6216:1996 (ISO 6439: 1990). The procedure for
analyzing phenol content in the sample is described as follows. A determined amount of phenol
solution, which depended on the dilution factor, was mixed with 0.25 mL of pH = 10 buffer,
0.1 mL of 4-amino antipyrine solution and 0.1 mL of potassium ferricyanide solution to form
red-orange complex. The solution was diluted in a 25-mL volumetric flask, left in dark for 10
min and then subjected to analysis (UV-Vis JENWAY 6305, wavelength of 510 nm). The
calibration curve was constructed in the range 0.5-7 ppm.
To examine the effect of time on catalyst performance, phenol treatment efficiency was
measured at different times within 2h. The H2O2 volume was fixed at 35 µL. The catalyst mass
was fixed at 0.05 g. Influence of H2O2 amount on treatment efficiency was examined in the H2O2
volume range 0–70 µL at the catalyst mass of 0.05 g and reaction time of 30 min. The influence
of varying catalyst mass was examined at three points of 0.0250, 0.0500, and 0.075 g. The initial
concentration of phenol solutions used for all experiments was fixed at 200 ppm (V = 40 mL).
Each experiment was performed 3 times to get mean values.
2.4. Characterization of materials
The scanning electron microscopy imaging was performed on a JSM IT-200 (Japan). X-ray
diffraction analyses were performed with a D2 Phaser. Typical radiation conditions were 30 kV,
10 mA, Cu Kα radiation (λ = 1,54Ao) and 2 theta in range of 5 – 80o. These characterizations were
conducted at Viet Duc Center- Ho Chi Minh City University of Food Industry.
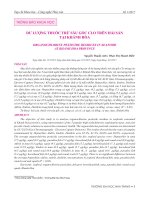
3. RESULTS AND DISCUSSION
3.1. Characteristics of synthesized iron oxides
The iron oxide received from the fabrication route S1 has a dark-brown color and was
strongly attracted by a magnet showing a good magnetic property (Figure 1). The fabrication
route S2 provided the yellow-brown oxide powder, which is likely in hydrated form. S2 was not
as active as S1 under the effect of a magnet. The SEM image of S1 shows the presence of
discrete Fe3O4 particles of 1–5 μm, while S2 has much smaller grains at nano sizes and some
zones indicate the formation of large aggregates (Figure 2).
Figure 1. Iron oxides received from the fabrication route 1 and 2
Figure 2. SEM images of S1 and S2
14
Comparison of catalytic activities of magnetic iron oxides in phenol degradation
The XRD pattern of S1 (Figure 3a) shows typical diffraction peaks of magnetite (Fe3O4)
at 30.15o; 36.27o; 43.32o; 53.89o; 57.13o and 62.29o corresponding to the (220), (311), (400),
(422), (511) and (440) crystalline planes, respectively [11]. In addition, small shoulders around
32o and 49o were detected and could be assigned to the presence of hematite α-Fe2O3 (JCPDS
card No. 33-0664, 19-0629, and 70-1522 for hematite and magnetite, respectively). The XRD
results indicate that the majority phase of S1 is magnetite with a small presence of hematite.
This further explains why the powder does not have the typical black color of the pure magnetite
but has a dark-brown color. A small number of iron species was possibly transformed to separate
hematite phases during the calcination process. The dark-brown color of the mixture of hematite
(minor phase) and magnetite (major phase) was also previously reported by N. Mufti et al. [12].
On the other hand, the amorphous phase is the major phase of S2 and the only crystalline plane
of iron oxides was detected at around 35.8o (Figure 3b).
Figure 3. XRD patterns of S1 (a) and S2 (b)
3.2. Catalytic performance in phenol degradation
3.2.1. Effect of reaction time
For the Fenton-like reaction with S1 catalyst, the phenol degradation rate was fast in the
first 15 min (from around zero level to 87%) and slowed down until remaining almost
unchanged after 60 min (98.2%). Further increasing reaction time to 90 min did not considerably
change the treatment efficiency (Figure 4). The degradation reaction with S2 occurred much
stronger in the first 5 min and the efficiency fluctuated at about 69% from 15 min. S1 and S2
catalysts required 60 and 15 min to reach the highest degradation efficiency. Interestingly,
although S2 had a more kinetic advantage at the beginning, S1 appeared more efficient in
general as the final treatment efficiency reached about 93%, which is about 1.3 times higher
than that obtained with S2. It can be explained that the smaller-sized grains of S2 (according to
SEM image) contribute to the initial fast reaction rate but the majority of the crystalline phase
(according to XRD pattern) allow for the higher overall catalytic performance of S1. This
finding agrees well with the literature indicating the prevailing effect of crystallinity of iron
oxide over the surface area on catalytic activity [8].
15
Bui Thi Phuong Quynh, Le Thi Kim Anh, Tran Nguyen An Sa
S1
S2
40
60
Time (min)
80
100
Efficiency (%)
80
60
40
20
0
0
20
100
Figure 4. Effect of time on phenol degradation efficiency
3.2.2. Effect of H2O2 amount
The effect of increasing H2O2 volume from zero to 70 μL on phenol treatment efficiency is
presented in Figure 5. In general, higher H2O2 content supports higher treatment efficiency for
both catalysts. According to literature, higher content of H2O2 could promote more interaction
between H2O2 and iron oxides, thereby generating more hydroxyl radicals active for phenol
degradation via the following reactions [4]:
Fe(II)surface + H2O2 → Fe(III) surface + •OH + HO (1)
Fe(III)surface + H2O2 → Fe(III) surface(H2O2)
(2)
Fe(III) surface (H2O2)→Fe(II) surface + HO2• + H+
(3)
According to the obtained results, 35 μL H2O2 is at least required for the two catalysts to
achieve significant phenol degradation under the tested reaction conditions. For S1, the
efficiency increased significantly when increasing H2O2 volume to 35 μL and a further addition
to 70 μL did not change the efficiency. For S2, the efficiency increased gradually until 70 μL
but a much stronger effect of H2O2 amount was observed in the range 0‒35 μL. Compared to
the activity of S2, that of S1 was influenced more significantly in the H2O2 range 10–35 μL and
reached a maximum level sooner. However, it should be noted that the excess H2O2 may also
react with the hydroxyl radicals, thereby reducing the oxidizing capacity, when the H2O2 content
is too high [13].
S1
100
S2
Efficiency (%)
80
60
40
20
0
0
20
40
60
80
H2O2 volume (L)
Figure 5. Effect of H2O2 amount on phenol degradation efficiency
3.2.3. Effect of catalyst amount
Effect of catalyst amount on phenol degradation efficiency was investigated at 0.025, 0.05
and 0.075 g (equivalent to 0.0625, 0.125 and 0.1875% (w/v)) with the results shown in Figure 6.
16
Comparison of catalytic activities of magnetic iron oxides in phenol degradation
The degradation efficiency improved significantly as the mass of the two catalysts increased
from 0.025 to 0.05 g as a result of the presence of more active sites for the degradation reaction.
Increases in the efficiency by nearly 23% and 30% were recorded for S1 and S2, respectively,
when the catalyst amount doubled from 0.025 to 0.05 g. Further increase of the catalyst amount
to 0.075 g, however, offered just a slight enhancement in the performance. These results show
that the catalyst mass of 0.05 g, or the solid to solution ratio of 0.125%, is sufficient for phenol
degradation under tested reaction conditions.
Efficiency (%)
100
S1
S2
80
60
40
20
0
0,025
0,05
Catalyst mass (g)
0,075
Figure 6. Effect of catalyst mass on phenol degradation efficiency
3.2.4. Reaction conditions for high removal efficiencies
The reaction conditions for phenol degradation using the two catalysts, including the
catalyst mass/solution volume ratio, H2O2/solution volume ratio, and required time to obtain
more than 98% degradation efficiency (at phenol concentration of 200 ppm) are listed in Table
1. It can be seen that, in order to achieve nearly complete degradation of phenol, the crystalline
Fe3O4 particles (S1) required much less H2O2 amount but a longer reaction time as compared to
the amorphous nano-sized iron oxide (S2). Meanwhile, S2 is more advantageous in terms of
shorter reaction time at the compensation of higher amounts of the catalyst or H2O2.
Table 1. Comparison of the reaction conditions for two catalysts to achieve high phenol
degradation activity
Material
Catalyst amount /
solution volume
ratio (%, w/v)
Reaction time
H2O2 ratio
(minimum required)
(%, v/v)
(min)
Removal
percentage (%)
Crystalline Fe3O4
particles (S1)
0.125
0.0875
60 min
98.29
Crystalline Fe3O4
particles (S1)
0.125
1.75
60 min
99.32
Amorphous nano-sized
iron oxide (S2)
0.125
2.625
15 min
98.41
Amorphous nano-sized
iron oxide (S2)
0.1875
2.625
15 min
99.05
17
Bui Thi Phuong Quynh, Le Thi Kim Anh, Tran Nguyen An Sa
4. CONCLUSION
This study reports the synthesis of iron oxide catalysts for efficient phenol degradation by
using two different synthesis routes. Two kinds of materials, including the crystalline Fe3O4
particles and the amorphous nano-sized iron oxide, were produced according to SEM and XRD
data. Both catalysts were found to exhibit remarkable performance in the Fenton-like oxidation
of phenol. The crystalline Fe3O4 particles required much less H2O2 but longer reaction time
compared to the amorphous nano-sized iron oxide to achieve nearly complete degradation of
phenol. On the other hand, the amorphous nano-sized iron oxide was more advantageous in
terms of shorter reaction time. For approximate 99% removal of phenol, reaction conditions
with the crystalline Fe3O4 were found at the catalyst /solution ratio of 0.125% (w/v),
H2O2/solution volume ratio of 1.75%, and reaction time of 60 min. A similar efficiency was
obtained with the amorphous nano-sized iron oxide at the catalyst/solution ratio of 0.1875%
(w/v), H2O2/solution volume ratio of 2.625%, and reaction time of 15 min.
REFERENCES
1. Said K.A.M, Ismail A.F., Karim Z.A., Abdullah M.S., Hafeez A. - A review of
technologies for the phenolic compounds recovery and phenol removal from
wastewater, Process Safety and Environmental Protection 151 (2021) 257289.
2. Erylmaz C., Genỗ A. - Review of treatment technologies for the removal of phenol from
wastewaters, Journal of Water Chemistry and Technology 43 (2021) 145–154.
3. Dau D.H., Tung L.M., Hai T.H, Ngoan L.V. - Synthesis of Fe3O4 superparamagnetic
nanoparticles and coating process on Fe3O4 nanoparticles, Journal of Science 19a
(2011) 38–46.
4. Zhang S., Zhao X., Niu H., Shi Y., Cai Y., Jiang G. - Superparamagnetic Fe3O4
nanoparticles as catalysts for the catalytic oxidation of phenolic and aniline compounds,
Journal of Hazardous Materials 167 (2009) 560–566.
5. Thomas N., Dionysios D.D., Suresh C.P. - Heterogeneous fenton catalysts: A review of
recent advances, Journal of Hazardous Materials 404 (2021) 124082.
6. Wang W., Mao Q., He H., Zhou M. - Fe3O4 nanoparticles as an efficient heterogeneous
Fenton catalyst for phenol removal at relatively wide pH values, Water Science and
Technology 68 (11) (2013) 2367–2373.
7. Zelmanov G., Semiat R. - Iron (3) oxide-based nanoparticles as catalysts in advanced
organic aqueous oxidation, Water Research 42 (2008) 492–498.
8. Qi G.H., Li X.Q., Cao J. - Research on the phenol degradation in microbial fuel cells
with Fe3O4-reduced graphene oxide cathodic catalyst, Advanced Materials Research
881-883 (2014) 310–314.
9. Zhao L., Lin Z., Ma X., Dong Y. - Catalytic activity of different iron oxides: Insight
from pollutant degradation and hydroxyl radical formation in heterogeneous Fentonlike systems, Chemical Engineering Journal 352 (2018) 343-351.
10. Hassan H., Fatemeh P., Sohaila A. - Carboxylic acid effects on the size and catalytic
activity of magnetite nanoparticles, Journal of Colloid and Interface Science 437 (2015)
1-9.
11. Liu J., Zhao Z., Shao P., Cui P. - Activation of peroxymonosulfate with magnetic Fe3O4–
MnO2 core–shell nanocomposites for 4-chlorophenol degradation, Chemical
Engineering Journal 262 (2015) 854–861.
18
Comparison of catalytic activities of magnetic iron oxides in phenol degradation
12. Wei Y., Han B., Hu X., Lin Y., Wang X., Deng X. - Synthesis of Fe3O4 nanoparticles
and their magnetic properties, Procedia Engineering 27 (2012) 632-637.
13. Mufti N., Atma T., Fuad A., Sutadji E. - Synthesis and characterization of black, red
and yellow nanoparticles pigments from the iron sand, International Conference on
Theoretical and Applied Physics 2013, AIP Conference Proceedings 1617 (2014)
165-169.
14. Ren B., Xu Y., Zhang C., Zhang L., Zhao J., and Liu Z. - Degradation of methylene blue
by a heterogeneous Fenton reaction using an octahedron-like, high-graphitization,
carbon-doped Fe2O3 catalyst, Journal of the Taiwan Institute of Chemical Engineers 97
(2019) 170-177.
TÓM TẮT
SO SÁNH HOẠT TÍNH XÚC TÁC CỦA CÁC OXIT SẮT MANG TỪ TÍNH
TRONG PHẢN ỨNG PHÂN HỦY PHENOL
Bùi Thị Phương Quỳnh, Lê Thị Kim Anh, Trần Nguyễn An Sa*
Trường Đại học Công nghiệp Thực phẩm TP.HCM
*Email:
Các vật liệu mang từ tính trên nền oxit sắt luôn thu hút được sự chú ý lớn trong lĩnh vực
xúc tác do chúng có độ hoạt động hóa học cao, nguồn cung cấp rộng, cũng như dễ thu hồi và tái
sử dụng. Nội dung chính của nghiên cứu này là khảo sát hoạt tính xúc tác của các loại oxit sắt,
được tổng hợp qua hai quy trình khác nhau, trong phản ứng dị thể kiểu Fenton để phân hủy
phenol. Dữ liệu phân tích XRD và SEM cho thấy hai loại oxit sắt là Fe3O4 tinh thể và oxit sắt
vơ định hình kích thước nano đã được tạo thành. Ảnh hưởng của thời gian phản ứng, lượng
hydrogen peroxide và lượng chất xúc tác rắn lên hiệu suất loại bỏ phenol đã được khảo sát chi
tiết. Kết quả cho thấy vật liệu từ tính Fe3O4 tinh thể (1-5 μm) cho hiệu suất xử lý phenol cao
hơn so với vật liệu oxit sắt vơ định hình kích thước nano trong cùng điều kiện phản ứng. Tuy
nhiên, tốc độ oxy hóa phenol ban đầu nhanh hơn nhiều khi dùng vật liệu xúc tác oxit sắt vơ định
hình. Hiệu suất loại bỏ phenol hơn 98% (nồng độ ban đầu 200 ppm) đã đạt được với xúc tác
Fe3O4 tinh thể sau 60 phút. Vật liệu oxit sắt vơ định hình cũng cho hiệu suất tương đồng chỉ sau
15 phút nhưng cần lượng chất xúc tác và lượng hydrogen peroxide cao hơn đáng kể so với xúc
tác Fe3O4 tinh thể.
Từ khóa: Phản ứng Fenton, phân hủy phenol, oxit sắt, từ tính.
19
Journal of Science Technology and Food 22 (4) (2022) 20-27
POTENTIAL OF SPENT COFFEE GROUND
IN Pleurotus sajor-caju CULTIVATION
Truong Thi Dieu Hien
Ho Chi Minh City University of Food Industry
Email:
Received: 12 May 2022; Accepted: 5 September 2022
ABSTRACT
Pleurotus sajor-caju is one of the popular edible mushrooms that contribute to the daily
meals of East Southern Asia countries. Demand for this oyster mushroom is creasing and
triggers challenges to the substrate supply. In this study, spent coffee ground (SCG) collected
from various coffee shops located in Ho Chi Minh City, was employed as the main substrates
in P. sajor-caju cultivation, mixed up with rice bran/sawdust (8% w/w) in different ratios (0,
25, 50, 75, and 100 %). Results showed that the ratio of SCG and rice bran/sawdust (8% w/w)
at 50:50, exhibits the highest quantity of mushrooms (41 gr/embryos), shortening harvest time
and maximizing the economic profit. Therefore, the deployment of spent coffee grounds in P.
sajor-caju cultivation should be expedited, in order to utilize the available sources and to create
the eco-vision in edible mushroom production.
Keywords: Economical profit, Pleurotus sajor-caju, recycle, sawdust, spent coffee grounds.
1. INTRODUCTION
Food production is faced with many challenges such as the land for crops narrowing, the
change in weather, and global warming or topsoil erosion. These are creating more obstacles
to the strategy of food provision in many countries. Edible mushrooms are safe choices for the
environment, which help recycle food wastes and convert high lignocellulose substrate into
protein-enriched food [1]. Pleurotus sajor-caju (grey oyster mushroom) is a mushroom that
fruit bodies shape like oysters and encloses high nutrients such as carbohydrates, proteins,
minerals, and vitamins while enabling serving as the choice for diet foods. The demand for the
mushroom market is leveled up, serving foods and traditional medicine, especially in East
Southern Asia. Many types of ingredients have been employed for P. sajor-caju cultivation
such as rice hull, banana leaf, sugarcane bagasse, or corn cob [1], and resolving the demand
for substrate resources. However, with increasing consumption, substrate supply is the key
step to large-scale cultivation.
Viet Nam is the second producer of coffee, and coffee consumption takes important in
the Vietnamese lifestyle [2]. This practice is releasing a huge amount of spent coffee grounds
(SCG) into the environment. Many innovative ways to recycle the spent coffee ground are testified,
including natural insect repellent [3, 4], cosmetic production [5], homemade fertilizer [6], and
especially SCG serving as the substrate for mushroom cultivation [7]. The compositions of
SCG are cellulose (59.2-62.94%), hemicellulose (5-10 %), lignin (19.8-26.5 %) [8], and some
extra-nutrients such as nitrogen, fat, or carbohydrates. These ingredients prove that SCG could
be an ideal substrate for P. sajor-caju cultivation [9].
Reports showed that coffee-derived substrates have been employed for mushroom
cultivation such as coffee husk or parchment [10]. In addition, SCG is certified as a valuable
20
Potential of spent coffee ground in Pleurotus sajor-caju cultivation
source for edible mushroom cultivation [11-14]. Indeed, Alsanad et al. indicated that SCG as
a nutritional supplement- increases the bio-efficiency of Pleurotus ostreatus in lignocellulose
degradation if mixed up with wheat straw [11]. Furthermore, Carrasco-Cabrera et al. indicated
that caffeine from SCG is metabolized and converted into xanthine by P. ostreatus mycelium,
and the amount of either caffeine or its metabolites is extremely low [12]. Per the estimation
of this study, the caffeine content in the consumption of 250 kg of fresh oyster mushroom is
equivalent to one cup of espresso coffee. This finding guarantees the safety of oyster
mushrooms grown on SCG-mixed substrate regarding health impact. Moreover, Fayssal et al.
suggest that SCG mixed up with olive pruning resides at a low proportion (17% versus the
whole substrate), would enhance nutrients with lower fat, increase proteins, and
monounsaturated fatty acids as well as lower heavy metal accumulation [13]. Thanh et al. also
pointed out that 30% cardboard: 70% SCG in the substrate, significantly increases mycelium
density and the number of primordial formations of P. eryngii versus either cardboard or SCG
alone [14]. Therefore, the potential of SCG recycling in oyster mushroom cultivation is
countless. However, there is no evidence supporting SCG in feasibility for P. sajor-caju
cultivation and different substrates or mushroom strains might generate different body fruit
amounts. In addition, rice bran is a disposable source, believed to support mushroom growth,
and verified by various studies due to its nutrient content [15]. Therefore, this study aimed to
examine the feasibility of SCG recycling in different ratio combinations of sawdust plus rice
bran and address which combination ratio exhibits the best profit. This finding would bring
out the solution that minimizes the capital investment for P. sajor-caju cultivation while
providing a new approach to recycling the SCG.
2. MATERIALS AND METHODS
2.1. Materials
P. sajor-caju, rice seeds, Magnesium Sulfate (MgSO4, Millipore Sigma, MA, USA), and
sawdust were provided by the Center of Scientific Research and Practice, Thu Dau Mot
University, Binh Duong. The spent coffee ground was collected from various coffee shops
located in Ho Chi Minh city. Rice bran C15 was purchased from PROCONCO (Bien Hoa,
Dong Nai, Vietnam).
2.2. Methods
2.2.1. Experiment design
Experiment 1: Determination of rice bran percentage in P. sajor-caju cultivation
Firstly, an experiment was set up to uncover the amount of rice bran supplemented with
the mushroom substrate (rice seeds). Rice seeds were soaked in water for 6h, followed by
washing to get rid of dust. Rice seeds afterward, were cooked by autoclaving at 1210C, 1atm/
15min, and mixed with MgSO4 as a ratio of 0.1% (w/w). This mixture would be added to rice
bran with various percentages (0, 2, 4, 6, 8% w/w). Next, rice seeds and bran mixtures were
autoclaved in a 100 mL glass bottle and proceeded to grow P. sajor-caju. Mycelium length,
time point overcover substrate, and mycelium density to were noted.
Experiment 2: Determination of SCG quantity in P. sajor-caju cultivation
To examine the feasibility of SCG in mushroom cultivation, SCG collected from various
shops, was sterilized with lime 3%, followed by a pH neutralization process. Sawdust was also
treated with lime 3% within 1 day, mixed adequately with rice bran. The level of lime was 3%,
instead of 0.5% as reported by Contreras et al. [16], to reach the pH level that facilitates P.
21
Truong Thi Dieu Hien
sajor-caju growth (pH 5.0-6.0). The mixture was added with SCG in different ratios as
described in Table 1 below and dispensed into embryo bags for autoclave at 121°C, 1 atm. P.
sajor-caju was randomly sown after 24 hours into embryo bags and indoor-grown at 25-30°C,
ventilating with 8 air changes/hour and in the light with 1000-1200 lux. Air humidity was
maintained at 70-95% and monitored by an indoor hygrometer.
Table 1. Combinations of the mixture of rice bran/sawdust and SCG in different groups
Groups
Spent coffee ground (%)
Mixture (Rice bran/ sawdust 8%)
SCG 0
SCG 25
SCG 50
SCG 75
SCG 100
0
25
50
75
100
100
75
50
25
0
2.2.2. Harvest
The expansion of mycelium was measured daily and the time point at body fruiting was
noted. Body fruits in different experiments were collected and weighed. Bio-efficiencies of
each experiment were calculated via the formulation: weight of harvest/weight of dry substrate
(w/w) as proposed by Chang et al. [17]. The profit of experimental groups was evaluated via
the gross and expenses.
2.2.3. Statistical analysis
Experimental differences were examined using ANOVA and Student’s t-tests, as appropriate
by Graphpad Prism 7.0. All values are expressed as mean ± SD (n = 3); P-value < 0.05 were
considered to indicate statistical significance. Each of the experiments was repeated.
3. RESULTS AND DISCUSSION
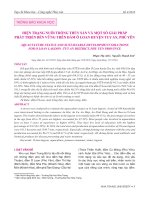
3.1. Supplement of rice bran
Rice bran is believed to enhance the body’s fruiting process [18]. To know which
proportion of rice bran might accelerate mycelium growth, various rice bran amounts were
deployed during material preparation and mycelium expansion was recorded every 3 days
(Day 0-Day 9). Results showed that mycelium is able to grow in all groups from bran 0%
(Br0) to bran 8% (Br8) (Figure 1A). However, the capacity of mycelium expansion is in
contrast to rice on bran percentage. On Day 9, mycelium lengths in Br0, Br2, and Br4 are not
significant to each other, while Br6 is lower than Br0 (P-value = 0.0307 < 0.05) (Figure 1B).
Figure 1. Optimization of rice bran in substrate preparation
22
Potential of spent coffee ground in Pleurotus sajor-caju cultivation
The Br8 group exhibits the slowest mycelium expansion as compared to Br0 (P-value =
0.0018 < 0.01). This result suggests that the supplement of rice bran slows down mycelium
expansion. Nevertheless, it is obvious that mycelia in the Br8 group are dense, and which in
turns facilitates body fruiting processing [19].
3.2. Effects of SCG amendment to mycelium surmounting
To evaluate the potential of SCG recycling in P. sajor-caju cultivation, SCG was blended
with rice bran/sawdust mixture at different ratios (w/w) as described in Table 1. Since, the
mycelium in Br8 (rice bran 8%) presents the highest thickening, rice bran 8% was served as a
supplement for all further experiments. Results showed that the addition of SCG does not alter
the surmounting time at ratios SCG 25, SCG 50, and SCG 75 versus SCG 0 (Figure 2A-B).
By contrast, SCG 100 (100% spent coffee ground) extends the surmounting time of mycelium
significantly (Figure 2, P-value = 0.0026 < 0.01). This result suggests that the addition of SCG
to rice bran/sawdust would not restrain the surmounting process of mycelium and SCG could
be the alternative choice to save the sawdust consumption during P. sajor-caju cultivation.
Figure 2. Mycelium surmounting time in different combinations
Fan et al. indicated that caffeine and tannins in coffee husks might harm mycelial growth
and decrease biomass production [20]. The study has been conducted on P. ostreatus LPB 09
showed that caffeine dose-dependently reduces mushroom production and no growth observed
at 2500 mg/L caffeine. In addition, tannin under 100 mg/L plays a stimulating role in mycelium
expansion, however, the tannin limit should not be over 500 mg/L. Therefore, in large-scale
P. sajor-caju cultivation, it is necessary to analyze the caffeine and tannin amount before
mixing SCG into rice bran/sawdust, in order to guarantee maximal profit.
3.3. Harvest time and body fruits weight
Harvest time and body fruit weight are critical factors determining the efficiency of
mushroom cultivation. Since P. sajor-caju cultivation nowadays is able to conduct in-house,
controlled by the optimal conditions and therefore, shortening the harvest time would allow
for more harvests per year. Furthermore, the quantity of mushroom products is also important
to the cultivation and reflects the success of condition optimization. In this study, we look at
how the combination between SCG and rice bran/sawdust in different ratios, affects harvest
time and mushroom product. Results showed that supplements with the SCG to rice
bran/sawdust at a ratio of 50:50 (SCG 50) exhibited the shortest harvest time, significantly
compared to other combinations (P-value < 0.05, Figure 3B). Moreover, this combination also
created the highest production versus 100% rice bran/sawdust (P-value = 0.0466 < 0.05, Figure
3A-B). Other combinations lower down mushroom harvested (below the baseline, Figure 3B).
The increase in SCG percentage tends to diminish body fruiting, which is partly shown by the
23
Truong Thi Dieu Hien
lower productivity in SCG 75 and SCG 100 (P-value = 0.0053 < 0.01 and < 0.001 respectively,
Figure 3B). These data suggest that a combination of SCG and rice bran/sawdust at a ratio of 1:1
could be the ideal approach to recycling SCG in mushroom cultivation and yield production.
Figure 3. Harvest time and gained mushroom weight
Despite the SCG deployment to P. sajor-caju cultivation would provide a certain amount
of nutrients, however, the effects of SCG on mushroom growth are not fully evaluated in this
study. Since the SCG is highly acidic, that might have negative impacts on P. sajor-caju
growth as reported by Chai et al. [7]. To fix this issue, there is necessary to examine the
feasibility of the adjuvant agents serving as a neutralizer in an acidic substrate environment.
Moreover, Chai et al. also indicated that the limit tolerance to SCG amendment is 30% (w/w),
and over this tolerance would lead to the failure of body fruiting in different mushroom strains,
including P. pulmonarius, and P. floridanus. In this study, P. sajor-caju was employed to
transform SCG and rice bran/sawdust and the ratio at SCG50 exhibits the highest yield. Hence,
it is probable that P. sajor-caju gains higher tolerance to the SCG as compared to the above
mushroom strains and this strain could be a good model for mushroom cultivation regarding
SCG recycling.
3.4. Bio-efficiency and profit
Bio-efficiency is a simple method to grade the effectiveness of one given mushroom
strain in a way of using a single substrate or combination of substrates and transforming them
into a mushroom body. Therefore, bio-efficiency is usually employed to generally compare
among body fruiting of mushroom strain or indicate the capacity of substrate utilization [21].
Among experimental groups, SCG mixed with rice bran/sawdust (1:1) exhibited the highest
profit as compared to SCG 0 baseline (serving as 100% rice bran/sawdust, P-value = 0.0059
< 0.01). However, all the rest of the combinations evidenced a significant deficit versus
baseline (Figure 4). Furthermore, there was not much difference in bio-efficiency among
combinations (Figure 4). These data suggest that SCG50 proved itself the most beneficial
option in terms of recycling spent coffee grounds in mushroom cultivation. Recently, Martinez
et al. pointed out that the fermentation of coffee by microbials could be an answer to the acidic
environment induced by caffeine [22]. Indeed, coffee beans fermented with a yeast starter,
tend to produce volatile compounds while bacterial starter generates organic acid compounds.
This phenomenon allows for predicting and selecting the flavors of coffee beans. Therefore,
the pre-treated SCG with a yeast starter could be the ideal option to deplete the acidic
environment and naturally flavor the mushroom products. Moreover, the addition of the SCGfermentation step prior to being mixed with rice bran/sawdust mixture would probably change
the bio-efficiency and profit. Hence, screening of optimal microbial strains employed for SCG
fermentation is a critical step to maximize bio-efficiency and profit on a large scale.
24