báo cáo hóa học:" Research Article A Bayesian Analysis for Identifying DNA Copy Number Variations Using a Compound Poisson Process" docx
Bạn đang xem bản rút gọn của tài liệu. Xem và tải ngay bản đầy đủ của tài liệu tại đây (1.48 MB, 11 trang )
Hindawi Publishing Corporation
EURASIP Journal on Bioinformatics and Systems Biology
Volume 2010, Article ID 268513, 10 pages
doi:10.1155/2010/268513
Research Article
A Bayesian Analysis for Identifying DNA Copy Number Variations
Using a Compound Poisson Process
Jie Chen,
1
Ayten Yi
˘
giter,
2
Yu-Ping Wang,
3
and Hong-Wen Deng
4
1
Department of Mathematics and Statistics, University of Missouri-Kansas City, Kansas City, MO 64110, USA
2
Department of Statistics, Hacettepe University, 06800 Beytepe-Ankara, Turkey
3
Biomedical Engineering Department, Tulane University, New Orleans, LA 70118, USA
4
Departments of Orthopedic Surgery and Basic Medical Sciences, School of Medicine, University of Missouri-Kansas City,
Kansas City, MO, 64108, USA
Correspondence should be addressed to Jie Chen,
Received 3 May 2010; Revised 29 July 2010; Accepted 6 August 2010
Academic Editor: Yue Joseph Wang
Copyright © 2010 Jie Chen et al. This is an open access article distributed under the Creative Commons Attribution License, which
permits unrestricted use, distribution, and reproduction in any medium, provided the original work is properly cited.
To study chromosomal aberrations that may lead to cancer formation or genetic diseases, the array-based Comparative Genomic
Hybridization (aCGH) technique is often used for detecting DNA copy number variants (CNVs). Various methods have been
developed for gaining CNVs information based on aCGH data. However, most of these methods make use of the log-intensity
ratios in aCGH data without taking advantage of other information such as the DNA probe (e.g., biomarker) positions/distances
contained in the data. Motivated by the specific features of aCGH data, we developed a novel method that takes into account the
estimation of a change point or locus of the CNV in aCGH data with its associated biomarker position on the chromosome using a
compound Poisson process. We used a Bayesian approach to derive the p osteri or probability for the estimation of the CNV locus.
To detect loci of multiple CNVs in the data, a sliding window process combined with our derived Bayesian posterior probability
was proposed. To evaluate the performance of the method in the estimation of the CNV locus, we first performed simulation
studies. Finally, we applied our approach to real data from aCGH experiments, demonstrating its applicability.
1. Introduction
Cancer progression, tumor formations, and many genetic
diseases are related to aberrations in some chromosomal
regions. Chromosomal aberrations are often reflected in
DNA copy number changes, also known as copy number
variations (CNVs) [1]. To study such chromosomal aber-
rations, experiments are often conducted based on tumor
samples from a cell-line-using technologies such as aCGH or
SNP arrays. For instance, in aCGH experiments, a DNA test
sample and a diploid reference sample are first fluorescently
labeled by Cy3 and Cy5. Then, the samples are mixed and
hybridized to the microarray. Finally, the image intensities
from the test and reference samples can be obtained for all
DNA probes (bio-markers) along the chromosome [2, 3].
The log-base-2 ratios of the test and reference intensities,
usually denoted as log
2
T/G, are used to generate an aCGH
profile [4]. To reduce noise, the Gaussian-smoothed profile
is often used. With an appropriate normalization process,
log
2
T/G is viewed as a Gaussian distribution of mean 0 and
variance σ
2
[4, 5]. The deviation from mean 0 and variance
σ
2
in log
2
T/G data may indicate a copy number change.
Therefore, detecting DNA copy number changes becomes
the problem of how to identify significant parameter changes
occurred in the sequence of log
2
T/G observations.
There are a number of computational and statistical
methods developed for the detection of CNVs based on
aCGH data and SNP data. Examples include a finite Gaussian
mixture model [6], pair w ise t-tests [7], adaptive weights
smoothing [8], circular binary segmentation (CBS) [4],
hidden Markov modeling (HMM) [9], maximum likelihood
estimation [10], and many others. A comparison between
several of these methods for the analysis of aCGH data
was given by Lai et al. [11]. There are continued efforts
on developing methods for accurate detection of CNVs.
Nannya et al. [12] developed a robust algorithm for copy
2 EURASIP Journal on Bioinformatics and Systems Biology
number analysis of the human genome using high-density
oligonucleotide microarrays. Price et al. [13] adapted the
Smith-Waterman dynamic programming algorithm to pro-
vide a sensitive and robust approach (SW-ARRAY). More
recently, Shah et al. [14] proposed a simple modification
to the hidden Markov model (HMM) to make it be robust
to outliers in aCGH data. Yu et al. [15] developed an edge
detection algorithm for copy number analysis in SNP data.
An algorithm called reversible jump aCGH (RJaCGH) for
identifying copy number alterations was introduced in Rueda
and D
´
ıaz-Uriarte [16]. This RJaCGH algorithm is based on
a nonhomogeneous HMM fitted by reversible jump MCMC
using Bayesian approach. Pique-Regi et al. [17] proposed to
use piecewise constant (PWC) vectors to represent genome
copy number and used sparse Bayesian learning (SBL) to
detect copy number alterations breakpoints. Rancoita et al.
[18] provided an improved Bayesian regression method for
data that are noisy observations of a piecewise constant
function and used this method for CNV analysis. We have
formulated the problem as a statistical change-point detec-
tion [19] and proposed a mean and variance change-point
model (MVCM), which brought significant improvement
over many existing methods such as the CBS proposed by
Olshen et al. [4].
The above-mentioned algorithms, however, have not
taken advantage of other information such as the positions
of the DNA probes or biomarkers along the chromosome.
Recently, many researchers have begun to consider variations
in the distance between biomarkers, gene density, and
genomic features in the process of identifying increased
or decreased chromosomal region of gene expression [5].
Several notable methods emerged along this line and we list
a few of them here. Levin et al. [5] developed a scan statistics
for detecting spatial clusters of genes on a chromosome based
on gene positions and gene expression data modeled by a
compound Poisson process on the basis of two independent
simple Poisson processes. Daruwala et al. [20] developed a
statistical algorithm for the detection of genomic aberrations
in human cancer cell lines, where the location of aberrations
in the copy numbers was modeled by a Poisson process.
They distinguished genes as “regular” and “deviated”, where
the regular genes refer to those that have not been affected
by chromosomal aberrations while the deviated genes are
those whose log-transformed expression follows a Gaussian
distribution with unknown mean and v ariance [20]. Sun et
al. [21] developed a SNP association scan statistic similar
to that of Levin et al. [5] using a compound Poisson
process, which considers the complex distribution of genome
variations in chromosomal regions with significant clusters
of SNP associations.
Improvements have been made with the above more
sophisticated modeling of the aCGH using both the log-
intensity ratios and biomarker positions. The computation
involved in this type of modeling is usually demanding and
further improvement is needed. Motivated by these existing
works, we propose to use a compound Poisson process
approach to model the genomic features in identifying
chromosomal aberrations. We use a Bayesian approach to
determine an aberration (or a change-point) in the aCGH
profile modeled by a compound Poisson process. In our
model, the occurrences of the biomarkers are modeled by
a homogeneous Poisson process and the aCGH is modeled
by a Gaussian distribution. This novel method is able to
identify the aberr a tion corresponding to the CNVs with
associated distance between biomarkers on the chromosome.
The proposed method is inspired by the scan statistic [5,
21], which is widely used for identifying chromosomal
aberrations. However, our method differs from the work
of Levin et al. [5] in that our method uses a statistical
change-point model with a compound Poisson process for
the identification of CNVs.
2. Methods
2.1. Modeling aCGH Data Using a Compound Poisson Change
Point Model. To describe our approach, we first describe
a change-point model for a compound Poisson process in
terms of the normalized log ratio R
i
and the biomarker
distances along a chromosome, where R
i
= log
2
T
i
/G
i
and T
i
and G
i
are the intensities of the test and reference samples
at locus i on the chromosome (or genome). Based on
probability distribution theories and characteristics of the
hybridization process of aCGH technique, the occurrence
of the biomarkers on the chromosome can be modeled by
a homogeneous Poisson process. Similarly to the notations
adopted in Levin et al. [5] and Sun et al. [21], we denote
{N
t
, t ≥ 0} as a simple (homogeneous) Poisson process with
the rate parameter λ,whereN
t
is the number of biomarkers
occurring over a given base pair length t and λ is the
occurrence rate of biomarkers over a distance of t base pairs
along the chromosome. Let S
1
, S
2
, represent the positions
of the biomarkers on a chromosome and
Y
i
= S
i+1
− S
i
,(1)
represent the distance between the ith biomarker and the
(i + 1)th biomarker. Since
{N
t
, t ≥ 0} is a homogeneous
Poisson process, according to probability distribution the-
ories, Y
i
s are independent and identically distributed (iid)
with exponential variables with parameter λ; furthermore,
S
i
s are gamma distributed with rate parameter λ and scale
parameter i, and the probability density function as follows:
f
S
i
(
s
)
=
⎧
⎪
⎨
⎪
⎩
λ
Γ
(
i
)
(
λs
)
i−1
e
−λs
, s>0,
0, otherwise,
(2)
where Γ(
·) is the gamma function, and Γ(i +1) = i!fora
positive integer i.
Note the fact that the distances Y
i
s are iid exponential
random variables can be used to verify the assumption on
the occurrence of
{N
t
, t ≥ 0} being a simple (homogeneous)
Poisson process.
Assume that the given interval with base pair length t
is divided by the nonoverlapping subintervals with lengths
t
1
, t
2
, , t
. Then, the sequence of the log intensity ratio,
EURASIP Journal on Bioinformatics and Systems Biology 3
R
i
, corresponding to each subinterval can be denoted as X
t
1
,
X
t
2
, , X
t
and clearly
X
t
1
=
N
t
1
i=1
R
i
, X
t
2
=
N
t
2
i=1
R
i
, , X
t
=
N
t
i=1
R
i
. (3)
Given that
{N
t
, t ≥ 0} is a homogeneous Poisson pro-
cess and R
1
, R
2
, follow independent Gaussian (normal)
distributions [5]withmeanμ
i
and variance σ
2
, {X
t
i
,
t
i
≥ 0} is then defined by a compound Poisson process,
where the X
t
1
, X
t
2
, , X
t
are independently and normally
distributed with mean N
t
i
μ
i
and variance N
t
i
σ
2
,respectively.
The number, N
t
i
, of biomarkers in each subinterval of length
t
i
is distributed as a Poisson distribution with parameter λ
i
t
i
(where λ
i
represents the occurrence rate of biomarkers or
SNPs corresponding to subinterval t
i
)fori = 1, 2, , .
The problem is if there is an aberration (increase or
decrease) in the sequence R
i
at an unknown locus ν with base
pair length t
ν
. In statistical change-point modeling theory,
this is to know if there is a change in the parameters of the
distribution of the independent sequence of X
t
1
, X
t
2
, , X
t
at an unknown point ν (change point) contained in the
interval with length t
ν
. Specifically, the change point model
in the compound Poisson process can be formulated as
X
t
i
∼ Normal
N
t
i
μ
1
, N
t
i
σ
2
, i = 1, , ν − 1,
X
t
i
∼ Normal
N
t
i
δ, N
t
i
σ
2
, i = ν,
X
t
i
∼ Normal
N
t
i
μ
2
, N
t
i
σ
2
, i = ν +1, , ,
N
t
i
∼ Poisson
(
λ
1
t
i
)
, i
= 1, , ν − 1,
N
t
i
∼ Poisson
(
λt
t
)
, i
= ν,
N
t
i
∼ Poisson
(
λ
2
t
i
)
, i
= ν +1, , ,
(4)
where μ
1
, δ,andμ
2
are unknown means, σ
2
is unknown
variance of the normal distribution, and λ
1
, λ,andλ
2
are
unknown mean rates of biomarker occurrences in each
subinterval. The goal of the study becomes to estimate the
value of ν.
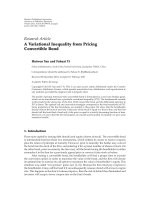
For illustration purpose, in the following Figure 1,
we provide a scatter plot that represents a change in a
sequence of data simulated from a compound Poisson
process described above.
2.2. A Bayesian Analysis for Locating the Change Point.
The change-point model in the compound Poisson process
described above can be viewed as a hypothesis testing
problem. It tests the null hypothesis, H
0
, of no change
in the parameters of the sequence of random variables
X
t
1
, X
t
2
, , X
t
in subintervals with length t
1
, t
2
, , t
H
0
:
N
t
i
μ
i
, N
t
i
σ
2
, λ
i
=
N
t
i
μ, N
t
i
σ
2
, λ
, i = 1, , ,
(5)
versus the alternative hypothesis s X
t
1
, X
t
2
, , X
t
in subin-
tervalswithlengtht
1
, t
2
, , t
H
0
:
N
t
i
μ
i
, N
t
i
σ
2
, λ
i
=
N
t
i
μ, N
t
i
σ
2
, λ
, i = 1, , ,(6)
0123456
×10
5
−0.2
0
0.2
0.4
0.6
Genomic position
log (T/R)
(a)
0123456
×10
5
0
1
2
3
4
×10
4
Genomic position
Length of gene
occurrence interval
(b)
Figure 1: Simulated compound Poisson process data with one
change: The upper panel is a plot of the simulated log ratio
intensities (normally distributed) against the genomic positions,
and the lower panel is a plot of the interval length against the
corresponding genomic positions (distributed with Poisson).
versus the alternative hypothesis
H
1
:
N
t
i
μ
i
, N
t
i
σ
2
, λ
i
=
⎧
⎪
⎪
⎪
⎪
⎨
⎪
⎪
⎪
⎪
⎩
N
t
i
μ
1
, N
t
i
σ
2
, λ
1
, i = 1, , ν − 1,
N
t
i
δ, N
t
i
σ
2
, λ
, i = ν,
N
t
i
μ
2
, N
t
i
σ
2
, λ
2
, i = ν +1, , .
(7)
The alternative hypothesis (7) above defines a change-point
model. For this model, we propose a Bayesian approach for
the estimate of ν. Due to the requirement of occurrence in an
interval, we only consider the search of the change when ν is
between2and
−1. We will obtain the posterior distribution
of ν in the sequel. We first assume that the prior distribution
of ν is taken as an noninformative prior
π
0
(
ν
)
=
⎧
⎪
⎨
⎪
⎩
1
− 2
, ν
= 2, , − 1,
0, otherwise.
(8)
The following joint prior distribution is given for μ
1
, δ,and
μ
2
π
0
μ
1
, μ
2
, δ | σ
2
, ν
∝ e
−1/(2σ
2
)μ
2
1
e
−1/(2σ
2
)μ
2
2
e
−1/(2σ
2
)δ
2
,(9)
and for the common variance σ
2
, the prior distribution is
taken as
π
0
σ
2
| ν
∝
1
σ
2
. (10)
4 EURASIP Journal on Bioinformatics and Systems Biology
Under those assumptions, the likelihood function of
X
t
1
, X
t
2
, , X
t
can be written as
L
1
μ
1
, μ
2
, δ, σ
2
, ν
=
L
1
μ
1
, μ
2
, δ, σ
2
, ν | X
t
i
, N
t
i
, i = 1, 2, ,
=
L
μ
1
, μ
2
, δ, σ
2
, ν, X
t
i
| N
t
i
, i = 1, 2, ,
·
P
N
t
i
= m
i
, i = 1, 2, ,
∝
1
σ
2
exp
⎧
⎨
⎩
−
1
2σ
2
ν
−1
i=1
X
t
i
− m
i
μ
1
m
i
2
⎫
⎬
⎭
·
exp
−
1
2σ
2
X
t
ν
− m
ν
δ
m
ν
2
·
exp
⎧
⎨
⎩
−
1
2σ
2
i=ν+1
X
t
i
− m
i
μ
2
m
i
2
⎫
⎬
⎭
·
P
N
t
i
= m
i
, i = 1, 2, ,
.
(11)
The joint posterior distribution of the parameters μ
1
, δ,
μ
2
, σ
2
,andν is then obtained as
π
1
μ
1
, μ
2
, δ, σ
2
, ν
∝
L
μ
1
, μ
2
, δ, σ
2
, ν, X
t
i
| N
t
i
, i = 1, 2, ,
·
P
N
t
i
= m
i
, i = 1, 2, ,
·
π
0
μ
1
, μ
2
, δ | σ
2
, ν
π
0
σ
2
| ν
π
0
(
ν
)
.
(12)
Integrating (12) above with respect to μ
1
, δ, μ
2
,andσ
2
,we
found that the marginal posterior distribution of the interval
ν that included the change point is proportional to
π
1
(
ν
)
=
(
A + B + C
)
((3−)/2)
1+
ν−1
i=1
m
i
1/2
1+
i=ν+1
m
i
1/2
(
1+m
ν
)
1/2
· P
N
t
i
= m
i
, i = 1, 2, ,
,
(13)
for ν
= 2, , − 1, where the constants A, B, and C in (13)
are obtained as
A
=
ν−1
i=1
X
2
t
i
m
i
−
ν−1
i=1
X
t
i
2
1+
ν−1
i
=1
m
i
,
B
=
i=ν+1
X
2
t
i
m
i
−
i=ν+1
X
t
i
2
1+
i
=ν+1
m
i
,
C
=
X
2
t
ν
m
ν
(
1+m
ν
)
.
(14)
The probability P(N
t
i
= m
i
, i = 1, 2, , )in(13)is
computed from the Poisson distribution with parameter λ
i
t
i
for i = 1, 2, , according to the Poisson model under the
alternative hypothesis H
1
(7), or namely
P
N
t
i
= m
i
, i = 1, 2, ,
=
λ
(
ν−1
i
=1
m
i
)
1
exp
−
λ
1
ν−1
i
=1
t
i
Π
ν−1
i
=1
m
i
!
·
λ
(
i
=ν+1
m
i
)
2
exp
−
λ
2
i=ν+1
t
i
Π
i
=ν+1
m
i
!
·
λ
m
ν
e
−λt
ν
m
ν
!
· Π
i
=1
t
m
i
i
.
(15)
In order to compute the probability given by (15), the
occurrence rates λ
1
, λ,andλ
2
can be estimated with the
maximum likelihood estimator (MLE),
λ
1
,
λ,and
λ
2
, in the
subintervals of lengths
ν−1
i=1
t
i
, t
ν
,and
i=ν+1
t
i
,respectively.
These MLEs are easily obtained as
λ
1
=
ν−1
i
=1
m
i
ν−1
i=1
t
i
,
λ =
m
ν
t
ν
,
λ
2
=
i
=ν+1
m
i
i=ν+1
t
i
. (16)
With these MLEs, (15)becomes
P
N
t
i
= m
i
, i = 1, 2, ,
=
exp
−
i
=1
m
i
Π
i
=1
m
i
!
m
ν
t
ν
m
ν
·
ν−1
i=1
m
i
ν−1
i=1
t
i
ν−1
i
=1
m
i
i=ν+1
m
i
i
=ν+1
t
i
i
=ν+1
m
i
i=1
t
m
i
i
.
(17)
Therefore, with the Poisson probabilities given by (17),
π
1
(ν)in(13)canberewrittenas
π
1
(
ν
)
∝
(
A + B + C
)
((3−)/2)
1+
ν−1
i=1
m
i
1/2
1+
i=ν+1
m
i
1/2
(
1+m
ν
)
1/2
·
exp
i=1
m
i
Π
i
=1
m
i
!
m
ν
t
ν
m
ν
·
ν−1
i
=1
m
i
ν−1
i=1
t
i
ν−1
i
=1
m
i
i
=ν+1
m
i
i
=ν+1
t
i
i
=ν+1
m
i
∝
(
A + B + C
)
((3−)/2)
1+
ν−1
i
=1
m
i
1/2
1+
i
=ν+1
m
i
1/2
(
1+m
ν
)
1/2
·
m
ν
t
ν
m
ν
ν−1
i
=1
m
i
ν−1
i=1
t
i
ν−1
i
=1
m
i
i
=ν+1
m
i
i=ν+1
t
i
i
=ν+1
m
i
π
1
(
ν
)
.
(18)
EURASIP Journal on Bioinformatics and Systems Biology 5
Finally, the marginal posterior distribution of the locus ν
is obtained as
π
∗
1
(
ν
)
=
π
1
(
ν
)
−1
j=2
π
1
j
,forν = 2, , − 1, (19)
where π
1
(·)isgivenin(18). The estimate of the change locus
ν is then given by
ν such that the posterior distribution (19)
attains its maximum at
ν, that is,
π
1
(
ν
)
= max
ν
π
∗
1
(
ν
)
. (20)
Based on the above theoretical results, we provide the
computational implementation of our approach in the next
subsection.
2.3. Computational Implementation of the B ayesian Approach.
To implement our above Bayesian approach to real data,
it is necessary to define the number, , of subintervals at
first. Our numerical experiments show that the number, ,
of subintervals can be chosen such that each subinter val
includes at least one observation (log ratio log
2
T/G)andat
most 300 observations. The lengths, t
1
, t
2
, ,andt
, of the
subintervals can be chosen equally (in this case, the numbers
of biomarkers contained in each subinterval are not equal).
An easier option of choosing the length, t
i
, for subinterval i
is to have each subinterval to contain the same number of
observations. From a practical point of view, the number of
subintervals, , and the size of each subinterval can also be
defined by users according to their prior knowledge about
their data.
Although our approach was given for the single change-
point model in compound Poisson process, it can be easily
extended to the multiple change points (or aberrations) by
using a sliding window approach [21, 22]. Sun et al. [21]
have taken the sliding window sizes as 3 to 10 consecutive
markers in their application. Our numerical experiments
suggest that the sliding window of sizes ranging from 12 to
35 subintervals should be effective in searching for multiple
changes in the aCGH data based on our proposed Bayesian
approach. To avoid intermediate edge problems within
each window, the two adjacent windows have to overlap.
Many of such issues were also discussed in [22]. For the
searching of multiple change points with the sliding window
approach, a practical question is how to set the threshold
value for the maximum posterior probabilities associated
with all windows. In our application, we used the heuristic
threshold of 0.5 (which is popular in probability sense) for
the maximum posterior probabilities.
As a summary of our method, we g ive the following
steps to implement our proposed Bayesian approach to the
compound Poisson change-point model (Bayesian-CPCM).
(1) If it is known that a chromosome has potentially one
aberration region, calculate the posterior probability
(19) and identify the locus
ν according to (20).
(2) If there are multiple aberration regions on a chro-
mosome or genome, choose a total of J sliding
windows with sizes ranging from 12 to 35 such that
each window contains exactly one potential aberra-
tion. Denote these J windows by w
1
,w
2
, ,w
J
,where
J
i
=1
w
i
equals the total number of observations on
the chromosome.
(3) For window j, determine the number of subintervals
j
with lengths t
1
, ,t
j
.
(4) Count the number of biomarkers, m
i
, in each subin-
terval with length t
i
, i = 1, 2, ,
i
.
(5) Compute the posterior probabilities for ν
=
1, 2, ,
i
using (19), find the maximum of the
posterior probability distribution. If the maximum
posterior probability is larger than 0.5 (or larger than
a selected threshold according to practice) at
ν, then
identify
ν according to (20).
(6) Convert the identified change position
ν into the
actual biomarker position S
ν
=
ν
i
=1
t
i
,anddeclare
S
ν
as the position on the chromosome at which the
CNV has changed.
(7) Repeat steps 3
−6aboveforj = 1, 2, , J, where J
is determined by the final window size and the final
window size is determined at the value for which the
posterior probabilities stabilize.
The Matlab code of the Bayesian-CPCM approach has
been written a nd is available upon readers’ request.
3. Results
3.1. Simulation Results. The proposed method provides
a theoretic framework of detecting CNVs using both
biomarker positions and log-intensity ratios. Since there is
no suitable metric that can be used to compare the proposed
approach with all existing algorithms, we carried simulation
studies based on a commonly used approach for evaluating
the estimation of a change point. We simulated sequences as
independent normal distributions with moderate sample size
n (the sequence size) of 12, 20, 32, 40, 80, and 120 for the
scenarios of the changes being located at the front (the n/4th
observation), at the center (the n/2th observation), and at the
end (the 3n/4th observation) of the respective sequence. For
the choices of the mean and variance parameters before and
after the change location, we consider the specific features of
the real aCGH data. Using data from the fibroblast cell lines
as benchmarks, we observed that the segments before and
after a detected change point mostly hav e mean difference
ranging from .36 to .7 (or larger), and a standard deviation
difference ranging mostly from .05 to .2. We, therefore,
investigated the cases when the mean and the standard
deviation are within the above-mentioned ranges. Due to
the page limit of the paper, we only report part of the
simulation results in Ta ble 1.InTable 1, ν denotes the true
change location;
ν is the estimated change location according
to (20); f represents the relative frequency that the estimated
location
ν equals to the true location ν;andMSE is the mean
squared error of the location estimator. Each simulation is
carried out 1,000 times.
6 EURASIP Journal on Bioinformatics and Systems Biology
Table 1: Simulation results. In this table, μ
1
= 0, λ
1
= .0001, λ
2
= .0005, δ = μ
1
, λ = λ
1
,andσ = .05.
When μ
2
= .4 When μ
2
= .5
n ν
ν fMSEν ν fMSE
3 2.8870 0.8210 0.4034 3 2.8960 0.8630 0.2903
12 6 5.9710 0.9040 0.3774 6 5.9510 0.9070 0.4635
9 8.7930 0.8560 1.6906 9 8.9130 0.8940 0.8038
5 5.0010 0.9800 0.0230 5 5.0050 0.9910 0.0150
20 10 10.0180 0.9800 0.0200 10 10.0110 0.9850 0.0150
15 15.0090 0.9800 0.0310 15 15.0130 0.9810 0.0190
8 8.0070 0.9930 0.0070 8 8.0040 0.9960 0.0040
32 16 16.0020 0.9900 0.0100 16 16.0000 0.9980 0.0020
24 24.0020 0.9960 0.0040 24 23.9980 0.9980 0.0020
10 10.0020 0.9980 0.0020 10 10.0030 0.9970 0.0000
40 20 20.0040 0.9960 0.0040 20 20.010 0.9990 0.0010
30 30.0000 1.0000 0.0040 30 30.0010 0.9990 0.0010
20 20.000 1.0000 0.0000 20 20.0000 1.0000 0.0000
80 40 40.0000 1.0000 0.0000 40 40.0000 1.0000 0.0000
60 60.0000 1.0000 0.0000 60 60.0000 1.0000 0.0000
30 30.0030 0.9970 0.0030 30 30.0000 1.0000 0.0000
120 60 60.0000 1.0000 0.0000 60 60.0000 1.0000 0.0000
90 90.0000 1.0000 0.0000 90 90.0000 1.0000 0.0000
The simulation results given in Table 1 indicate that the
derived posterior probability (19) can identify changes in the
front, the center and the end of the sequence, respectively,
with very high certainty—at least 97% for sample sizes
of 20 or larger. The average of the estimated locations is
remarkably close to the true change locus with very small
MSE. The proposed method can be confidently applied to
the identification of DNA copy number changes.
3.2. Applications to aCGH Datasets on 9 Fibroblast Cell
lines. Several aCGH experiments were performed on 15
fibroblast cell lines and the normalized averages of the
log
2
(T
i
/R
i
) (based on triplicate) along positions on each
chromosome were available at the following website [23]:
/>For the missing values in the log ratio values, we imputed
0 into the original data. The DNA copy number alterations
in each of the 15 fibroblast cell lines were verified by
karyotyping [23]. Therefore, these 15 fibroblast cell lines
aCGH datasets can be used as b enchmark datasets to test
our methods.
For the 9 fi broblast cell lines analyzed in many followup
papers of [23], we also used our posterior probabilities (19)
to locate the locus (or loci) on those chromosomes where
the alterations had been identified. It turned out that our
method can identify the locus (or loci) of the DNA copy
number alterations that are exactly corresponding to the
karyotyping results [23]. The CNVs found by our proposed
Bayesian approach (with sliding windows when appropriate)
are summarized in the following Tables 2 and 3.
According to the posterior probability (19), we found
that there was one copy number change on chromosome 5 of
Table 2: Results of the Bayesian approach on chromosomes with
one change identified. The posterior probability shown is the
maximum posterior probability for the chromosome.
Cell line Chromosome S
ν
(kb) π
1
(ν)
GM01535 chromosome 5 176824 .5237
GM01750 chromosome 9 26000 .9666
GM01750 chromosome 14 11545 .7867
GM03563 chromosome 3 10524 .8808
GM03563 chromosome 9 2646 1.000
GM07081 chromosome 7 57971 .6390
GM13330 chromosome 1 156276 .9994
GM13330 chromosome 4 173943 .9999
the cell line GM01535, chromosomes 9 and 14 of the cell line
GM01750, chromosomes 3 and 9 of the cell line GM03563,
chromosome 7 of the cell line GM07081, and chromosomes
1 and 4 of the cell line GM13330. No false positives were
found on these chromosomes with the threshold of 0.5 for
the maximum posterior probability (20). These findings are
consistent with the karyotyping result of Snijders et al. [23].
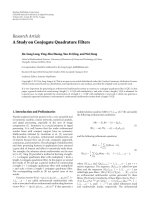
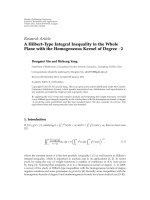
In Figures 2 and 3, we give the scatter plots of the aCGH data
of Chromosome 3 of GM03563, and of Chromosome 7 of
GM07081, along with their respective posterior probability
distributions. The peak posterior indicated a change at
that genomic locus. The beginning point after which the
corresponding log ratio values are increased is circled as red.
Our posterior probability function of (20) combined
with the sliding window approach signals two or more possi-
ble copy number changes on chromosome 6 of GM01524,
chromosome 8 of GM03134, chromosomes 10 and 11 of
EURASIP Journal on Bioinformatics and Systems Biology 7
Table 3: Results of the Bayesian approach on chromosomes with two changes identified. The posterior probability shown is the maximum
posterior probability for the chromosome at the respective loci.
Cell line Chromosome S
ν
(kb) π
1
(ν) Window size
GM01524 chromosome 6 74205, 145965 .9501, .7411 17
GM03134 chromosome 8 99764, 146000 .9397, 9602 20
GM05296 chromosome 10 64187, 110412 .7229, .8955 30
GM05296 chromosome 11 34420, 43357 .8496, .9852 18
GM13031 chromosome 17 50231, 58122 .9434, .7701 20
0
50 100 150 200 250
−0.2
0
0.2
0.4
0.6
0.8
Genomic position, kb/1000
log (T/R)
(a)
0 50 100 150 200 250
0
0.2
0.4
0.6
0.8
1
Genomic position, kb/1000
Posterior probability
(b)
Figure 2: Chromosome 3 of GM03563 [23] with identified change
locus and the posterior probability distribution: A red circle
indicates a significant DNA copy number change point such that the
segment before this red circle (inclusive of the red circle) is different
from the successor segment after the red circle (exclusive of the red
circle).
GM05296, and chromosome 17 of GM13031. These results
were given in Table 2. Figures 4 and 5 give the findings
on Chromosome 6 of GM01524 and Chromosome 17 of
GM13031, respectively, with a sliding window approach
used. These findings are again consistent with the karyotyp-
ing result of [23].
3.3. Comparison of the Performances of the Proposed Bayesian-
CPCM with CBS on the Fibroblast Cell-Lines Datasets. There
are many approaches (computational or statistical) now
available for analyzing aCGH data in the relative literature.
But many of those approaches, especially CBS [4], have
targeted on modeling the log ratio intensity in aCGH data.
Now, in this paper, we have used a new concept to model
both the gene position and the log ratio intensity in aCGH
data. That is, the most distinct feature of the proposed
Bayesian-CPCM approach, among other existing methods
in the literature, is its usage of the information of the gene
positions (hence gene distances) and the log ratio intensities
in the model.
0
20 40 60 80 100 120 140 160 180
−0.5
0
0.5
1
Genomic position, kb/1000
log (T/R)
(a)
0 20 40 60 80 100 120 140 160 180
0
0.2
0.4
0.6
0.8
Genomic position, kb/1000
Posterior probability
(b)
Figure 3: Chromosome 7 of GM07081 [23] with identified change
locus and the posterior probability distribution: A red circle
indicates a significant DNA copy number change point such that the
segment before this red circle (inclusive of the red circle) is different
from the successor segment after the red circle (exclusive of the red
circle).
Although there is no suitable met ric that can be used to
compare all the existing methods for CNV data analysis, we
used the specificity and sensitivity as comparison metr ic to
evaluate the performance of our proposed method with one
of the most popularly used CBS method. The comparison
results are given in the following Table 4.InTable 4,“Yes”
means the change was found by the specific method (CBS
or Bayesian-CPCM) for the known alteration verified by
spectral karyotyping in Snijders et al. [23] on the specific
chromosome in the cell line at the given α level (for the
case of using CBS or MVCM) or with maximum posterior
probability larger than 0.5 (for the case of using Bayesian-
CPCM), “No” means the change was not found by a specific
method, but was identified by spectral karyotyping; and
“Number of false positives” gives the number of changes
found by the specific method for a cell line while there were
no known alterations actually found by spectral karyotyping
[4, 23].
From Ta ble 4, it is evident that the new Bayesian-
CPCM approach can detect the CNV regions w ith highest
8 EURASIP Journal on Bioinformatics and Systems Biology
Table 4: Comparison of the changes found using CBS and the proposed Bayesian-CPCM on the nine fibroblast cell lines.
Cell line/chromosome CBS Bayesian-CPCM approach
α
= 0.01 α = 0.001
GM01524/6 Yes Yes Yes
Number of false positives 6 2 0
Specificity 72.7% 90.9% 100%
Sensitivity 100% 100% 100%
GM01535/5 Yes Yes Yes
GM01535/12 No No No
Number of false positives 2 0 0
Specificity 90.5% 100% 100%
Sensitivity 50% 50% 100%
GM01750/9 Yes Yes Yes
GM01750/14 Yes Yes Yes
Number of false positives 1 0 0
Specificity 95.2% 100% 100%
Sensitivity 100% 100% 100%
GM03134/8 Yes Yes Yes
Number of false positives 3 1 3
Specificity 86.4% 95.5% 97.9%
Sensitivity 100% 100% 100%
GM03563/3 Yes Yes Yes
GM03563/9 No No Yes
Number of false positives 8 5 0
Specificity 61.9% 76.2% 100%
Sensitivity 50% 50% 100%
GM05296/10 Yes Yes Yes
GM05296/11 Yes Yes Yes
Number of false positives 3 0 2
Specificity 88% 100% 99.3%
Sensitivity 100% 100% 100%
GM07081/7 Yes Yes Yes
GM07081/15 No No No
Number of false positives 1 0 0
Specificity 95.2% 100% 100%
Sensitivity 50% 50% 100%
GM13031/17 Yes Yes Yes
Number of false positives 5 3 1
Specificity 79.2% 87.5% 98.8%
Sensitivity 100% 100% 100%
GM13330/1 Yes Yes Yes
GM13330/4 Yes Yes Yes
Number of false positives 8 5 0
Specificity 61.9% 76.2% 100%
Sensitivity 100% 100% 100%
specificities and sensitivities. The false positives of the
Bayesian-CPCM on two of the chromosomes are due to
outliers and noise in the original data.
It is worth noting that the CNV or aberration regions
in these 9 fibroblast cell lines that were found using our
proposed Bayesian-CPCM approach are also consistent with
those identified in Olshen et al. [4], Chen and Wang [19],
Venkatraman and Olshen [24]. However, our new approach,
Bayesian-CPCM, neither involve heavy computations as
that of CBS algorithm in Olshen et al. [4], nor any
asymptotic distribution as required in our earlier work
[19].
EURASIP Journal on Bioinformatics and Systems Biology 9
0 0.2 0.4 0.6 0.8 1 1.2 1.4 1.6 1.8 2
−0.5
0
0.5
1
Genomic position, kb/1000
×10
5
log (T/R)
(a)
0 0.2 0.4 0.6 0.8 1 1.2 1.4 1.6 1.8 2
×10
5
0
0.2
0.4
0.6
0.8
Genomic position, kb/1000
Posterior probabilit
y
(b)
Figure 4: Chromosome 6 of GM01524 [23] with identified
change loci (indicated by red arrows) and the posterior probability
distributions with a window size of 20.
0123456789
×10
4
−1
−0.5
0
0.5
Genomic position, kb/1000
log (T/R)
(a)
0123456789
×10
4
0
0.2
0.4
0.6
0.8
1
Genomic position, kb/1000
Posterior probability
(b)
Figure 5: Chromosome 17 of GM13031 [23] with identified change
loci (indicated by red arrows, while the green arrow indicates a false
positive) and the posterior probability distributions with a window
size of 20.
4. Conclusion
A Bayesian approach for identifying CNVs in aCGH profile
modeled by a compound Poisson process is proposed in
this paper. Theoretical results of the Bayesian analysis are
obtained and the algorithm has been implemented with
Matlab. Applications of the proposed method to several
aCGH data sets have demonstrated its effectiveness. Exten-
sive simulation results indicate that the proposed method can
work effectively for various cases. The most distinct feature
of the proposed Bayesian-CPCM approach, when compared
with existing methods in the literature, is its use of both
biomarker positions (hence distances) and the log-intensity
ratio information in the model. Another important aspect of
the proposed approach is that it characterizes the posterior
probability of the loci being a CNV. With the common
knowledge of probability, the users can easily judge if there is
a CNV at a locus by using the posterior probability together
with their biological knowledge.
There are many computational and statistical approaches
now available for analyzing aCGH data in the literature.
But those approaches, especial ly the CBS of Olshen et al.
[4] and MVCM of Chen and Wang [19], are all targeted
on modeling the log ratio in aCGH data. In this paper, we
have used a new approach to model both the biomarker
position and the log ratio intensity in aCGH data. In other
words, the most distinct feature of the proposed Bayesian-
CPCM approach, among other existing methods, is the use of
both biomarker position information (hence distances) and
the log-intensity ratios in the model. The size of the sliding
window is very important in search multiple change p oints
in a whole sequence. The criterion of choosing the optimal
window size remains to be done in the future.
Acknowledgments
Part of the paper was done wh ile A. Yi
˘
giter was on leave from
Hacettepe University and was a visiting scholar at the Univer-
sity of Missouri-Kansas City with financial support provided
by the Scientific and Technological Research Council of
Turkey (TUBITAK). J. Chen was supported in part by a 2009
University of Missouri Research Board (UMRB) research
Grant. H W. Deng was partially supported by grants from
NIH (nos. P50 AR055081, R01AR050496, R01AR45349, and
R01AG026564) and by Dickson/Missouri endowment.
References
[1] R. Redon, S. Ishikawa, K. R. Fitch et al., “Global variation in
copy number in the human genome,” Nature, vol. 444, no.
7118, pp. 444–454, 2006.
[2] D. Pinkel, R. Seagraves, D. Sudar et al., “High resolution
analysis of DNA copy number variation usingcomparative
genomic hybridization to microarrays,” Nature Genetics, vol.
20, pp. 207–211, 1998.
[3] J. R. Pollack, C. M. Perou, A. A. Alizadeh et al., “Genome-
wide analysis of DNA copy-number changes using cDNA
microarrays,” Nature Genetics, vol. 23, no. 1, pp. 41–46, 1999.
[4] A. B. Olshen, E. S. Venkatraman, R. Lucito, and M. Wigler,
“Circular binary segmentation for the analysis of array-based
DNAcopynumberdata,”Biostatistics, vol. 5, no. 4, pp. 557–
572, 2004.
[5] A. M. Levin, D. Ghosh, K. R. Cho, and S. L. R. Kardia,
“A model-based scan statistic for identifying extreme chro-
mosomal regions of gene expression in human tumors,”
Bioinformatics, vol. 21, no. 12, pp. 2867–2874, 2005.
[6] G. Hodgson, J. H. Hager, S. Volik et al., “Genome scanning
with array CGH delineates regional alterations in mouse islet
carcinomas,” Nature Genetics, vol. 29, pp. 459–464, 2001.
10 EURASIP Journal on Bioinformatics and Systems Biology
[7] J. R. Pollack, T. Sørlie, C. M. Perou et al., “Microarray analysis
reveals a major direct role of DNA copy number alteration
in the transcriptional program of human breast tumors,”
Proceedings of the National Academy of Sciences of the United
States of A merica, vol. 99, no. 20, pp. 12963–12968, 2002.
[8] P. Hup
´
e,N.Stransky,J P.Thiery,F.Radvanyi,andE.Barillot,
“Analysis of array CGH data: from signal ratio to gain and
loss of DNA regions,” Bioinformatics, vol. 20, no. 18, pp. 3413–
3422, 2004.
[9] X. Zhao, B. A. Weir, T. LaFramboise et al., “Homozygous
deletions and chromosome amplifications in human lung
carcinomas revealed by single nucleotide polymorphism array
analysis,” Cancer Research, vol. 65, no. 13, pp. 5561–5570,
2005.
[10] F. Picard, S. Robin, M. Lavielle, C. Vaisse, and J J. Daudin,
“A statistical approach for array CGH data analysis,” BMC
Bioinformatics, vol. 6, article 27, 2005.
[11] W. R. Lai, M. D. Johnson, R. Kucherlapati, and P. J. Park,
“Comparative analysis of algorithms for identifying amplifi-
cations and deletions in array CGH data,” Bioinformatics, vol.
21, no. 19, pp. 3763–3770, 2005.
[12] Y. Nannya, M. Sanada, K. Nakazaki et al., “A robust algorithm
for copy number detection using high-density oligonucleotide
single nucleotide polymorphism genotyping arrays,” Cancer
Research, vol. 65, pp. 6071–6079, 2005.
[13] T. S. Price, R. Regan, R. Mott et al., “SW-ARRAY: a dynamic
programming solution for the identification of copy-number
changes in genomic DNA using array comparative genome
hybridization data,” Nucleic Acids Research, vol. 33, no. 11, pp.
3455–3464, 2005.
[14] S. P. Shah, X. Xuan, R. J. DeLeeuw et al., “Integrating copy
number polymorphisms into array CGH analysis using a
robust HMM,” Bioinformati cs, vol. 22, no. 14, pp. e431–e439,
2006.
[15] T. Yu, H. Ye, W. Sun et al., “A forward-backward fragment
assembling algorithm for the identification of genomic ampli-
fication and deletion breakpoints using high-density single
nucleotide polymorphism (SNP) array,” BMC Bioinformatics,
vol. 8, article 145, 2007.
[16] O. M. Rueda and R. D
´
ıaz-Uriarte, “Flexible and accurate
detection of genomic copy-number changes from aCGH,”
PLoS Computational Biology, vol. 3, no. 6, pp. 1115–1122,
2007.
[17] R. Pique-Regi, J. Monso-Varona, A. Ortega, R. C. Seeger,
T. J. Triche, and S. Asgharzadeh, “Sparse representation and
Bayesian detection of genome copy number alterations from
microarray data,” Bioinformatics, vol. 24, no. 3, pp. 309–318,
2008.
[18] P. M. V. Rancoita, M. Hutter, F. Bertoni, and I. Kwee, “Bayesian
DNA copy number analysis,” BMC Bioinformatics, vol. 10,
article 10, 2009.
[19] J. Chen and Y P. Wang, “A statistical change point model
approach for the detection of DNA copy number variations in
array CGH data,” IEEE/ACM Transactions on Computational
Biology and Bioinformatics, vol. 6, pp. 529–541, 2009.
[20] R S. Daruwala, A. Rudra, H. Ostrer, R. Lucito, M. Wigler, and
B. Mishra, “A versatile statistical analysis algorithm to detect
genome copy number variation,” Proceedings of the National
Academy of Sciences of the United States of America, vol. 101,
no. 46, pp. 16292–16297, 2004.
[21] Y. V. Sun, A. M. Levin, E. Boerwinkle, H. Robertson, and S.
L. R. Kardia, “A scan statistic for identifying chromosomal
patterns of SNP association,” Genetic Epidemiology, vol. 30, no.
7, pp. 627–635, 200 6.
[22] V. E. Ramensky, V. Ju. Makeev, M. A. Roytberg, and V.
G. Tumanyan, “DNA segmentation throughthe Bayesian
approach,” Journal of Computational Biology, vol. 7, no. 1-2,
pp. 215–231, 2000.
[23] A. M. Snijders, N. Nowak, R. Segraves et al., “Assembly of
microarrays for genome-wide measurement of DNA copy
number ,” Nature Genetics, vol. 29, no. 3, pp. 263–264, 2001.
[24] E. S. Venkatraman and A. B. Olshen, “A faster circular binary
segmentation algorithm for the analysis of array CGH data,”
Bioinformatics, vol. 23, no. 6, pp. 657–663, 2007.
Photographȱ©ȱTurismeȱdeȱBarcelonaȱ/ȱJ.ȱTrullàs
Preliminaryȱcallȱforȱpapers
The 2011 European Signal Processing Conference (EUSIPCOȬ2011) is the
nineteenth in a series of conferences promoted by the European Association for
Signal Processing (EURASIP, www.eurasip.org). This year edition will take place
in Barcelona, capital city of Catalonia (Spain), and will be jointly organized by the
Centre Tecnològic de Telecomunicacions de Catalunya (CTTC) and the
Universitat Politècnica de Catalunya (U P C ) .
EUSIPCOȬ2011 will focus on key aspects of signal processing theory and
li t i
li t d
b l
A t
f
b i i
ill
b
b d
lit
OrganizingȱCommittee
HonoraryȱChair
MiguelȱA.ȱLagunasȱ(CTTC)
GeneralȱChair
AnaȱI.ȱPérezȬNeiraȱ(UPC)
GeneralȱViceȬChair
CarlesȱAntónȬHaroȱ(CTTC)
TechnicalȱProgramȱChair
XavierȱMestreȱ(CTTC)
Technical Program Co
Ȭ
Chairs
app
li
ca
ti
ons as
li
s
t
e
d
b
e
l
ow.
A
ccep
t
ance o
f
su
b
m
i
ss
i
ons w
ill
b
e
b
ase
d
on qua
lit
y,
relevance and originality. Accepted papers will be published in the EUSIPCO
proceedings and presented during the conference. Paper submissions, proposals
for tutorials and proposals for special sessions are invited in, but not l i mited to,
the following areas of interest.
Areas of Inte r e s t
• Audio and electroȬacoustics.
• Design, implementation, and applications of signal processing systems.
l d
l
d
d
Technical
ȱ
Program
ȱ
Co
Chairs
JavierȱHernandoȱ(UPC)
MontserratȱPardàsȱ(UPC)
PlenaryȱTalks
FerranȱMarquésȱ(UPC)
YoninaȱEldarȱ(Technion)
SpecialȱSessions
IgnacioȱSantamaríaȱ(Unversidadȱ
deȱCantabria)
MatsȱBengtssonȱ(KTH)
Finances
Montserrat Nájar (UPC)
• Mu
l
time
d
ia signa
l
processing an
d
co
d
ing.
• Image and multidimensional signal processing.
• Signal detection and estimation.
• Sensor array and multiȬchannel signal processing.
• Sensor fusion in networked systems.
• Signal processing for communications.
• Medical imaging and image analysis.
• NonȬstationary, nonȬlinear and nonȬGaussian signal processing
.
Submissions
Montserrat
ȱ
Nájar
ȱ
(UPC)
Tutorials
DanielȱP.ȱPalomarȱ
(HongȱKongȱUST)
BeatriceȱPesquetȬPopescuȱ(ENST)
Publicityȱ
StephanȱPfletschingerȱ(CTTC)
MònicaȱNavarroȱ(CTTC)
Publications
AntonioȱPascualȱ(UPC)
CarlesȱFernándezȱ(CTTC)
I d i l Li i & E hibi
Submissions
Procedures to submit a paper and proposals for special sessions and tutorials will
be detailed at www.eusipco2011.org
. Submitted papers must be cameraȬready, no
more than 5 pages long, and conforming to the standard specified on the
EUSIPCO 2011 web site. First authors who are registered students can participate
in the best student paper competition.
ImportantȱDeadlines:
P l f i l i
15 D 2010
I
n
d
ustr
i
a
l
ȱ
Li
a
i
sonȱ
&
ȱ
E
x
hibi
ts
AngelikiȱAlexiouȱȱ
(UniversityȱofȱPiraeus)
AlbertȱSitjàȱ(CTTC)
InternationalȱLiaison
JuȱLiuȱ(ShandongȱUniversityȬChina)
JinhongȱYuanȱ(UNSWȬAustralia)
TamasȱSziranyiȱ(SZTAKIȱȬHungary)
RichȱSternȱ(CMUȬUSA)
RicardoȱL.ȱdeȱQueirozȱȱ(UNBȬBrazil)
Webpage:ȱwww.eusipco2011.org
P
roposa
l
sȱ
f
orȱspec
i
a
l
ȱsess
i
onsȱ
15
ȱ
D
ecȱ
2010
Proposalsȱforȱtutorials 18ȱFeb 2011
Electronicȱsubmissionȱofȱfullȱpapers 21ȱFeb 2011
Notificationȱofȱacceptance 23ȱMay 2011
SubmissionȱofȱcameraȬreadyȱpapers 6ȱJun 2011