Báo cáo hóa học: " Dielectric Relaxation of La-Doped Zirconia Caused by Annealing Ambient" pptx
Bạn đang xem bản rút gọn của tài liệu. Xem và tải ngay bản đầy đủ của tài liệu tại đây (344.57 KB, 6 trang )
NANO EXPRESS Open Access
Dielectric Relaxation of La-Doped Zirconia Caused
by Annealing Ambient
CZ Zhao
1,2*
, M Werner
2,3
, S Taylor
2
, PR Chalker
3
, AC Jones
4
, Chun Zhao
1,2
Abstract
La-doped zirconia films, deposited by ALD at 300°C, were found to be amorphous with dielectric constants
(k-values) up to 19. A tetragonal or cubic phase was induced by post-deposition annealing (PDA) at 900°C in both
nitrogen and air. Higher k-values (~32) were measured following PDA in air, but not after PDA in nitrogen.
However, a significant dielectric relaxation was observed in the air-annealed film, and this is attributed to the
formation of nano -crystallites. The relaxation behavior was modeled using the Curie–von Schweidler (CS) and
Havriliak–Negami (HN) relationships. The k-value of the as-deposited films clearly shows a mixe d CS and HN
dependence on frequency. The CS dependence vanished after annealing in air, while the HN dependence
disappeared after annealing in nitrogen.
Introduction
Amorphous ZrO
2
is one of the most promising dielec-
trics (dielectric constant k-value ~20) to re place SiO
2
in
MOSFETs at the 45-nm node CMOS technologies. Due
to the aggressive down-scaling of MOSFET, higher
dielectric constant materials and higher mobility semi-
conductors other than silicon are introduced [1-11].
Germanium is considered to be a good candidate to
replace silicon in the channel of next-generation high-
performance CMOS devices, while rare earth oxides
belonging to another class of materials offer good passi-
vation of germanium to reduce the density of interface
states, as it has recently been suggested [5,7,10]. On the
other hand, theoretical studies have reported that the
metastable tetragonal and cubic phases (t- and c-phases)
of ZrO
2
have higher k-values [12,13]. The addition of
rare earth e lements, such as La, Gd, Dy, or Er, is
reported to stabilize these phases and k-values of up to
40 have been obtained [7-11,14].
In order to induce the t- and c-phases in the La-doped
ZrO
2
, dielectric post-deposition annealing (PDA) is
needed, otherwise the layers grown by atomic layer
deposition (ALD) at relatively low temperatures
(<450°C) have an amorphous microstructure [15,16].
However, the transformation from amorpho us to t- and
c-phases can cause both dielectric relaxation and an
adverse increase in the leakage current [14,17]. Leakage,
which is the quantity defined in the ITRS Roadmap,
depends on the combination of k-value and energy off-
set values between the energy bands of the high-k mate-
rial and the silicon crystal. For example, 1 × 10
-8
A/cm
2
is a value required for DRAM capacitors [18] (much
higher values are accepted for gate oxides in CMOS).
Since the purpose t o introduce high-k dielectrics is to
reduce the leakage current of gate oxides, a lot of inves-
tigations on the leakage current of high-k dielectrics
have been carried out [19-23].
However, there is little information about dielectric
relaxation of La-doped ZrO
2
dielectrics. Since loss due
to the dielectric relaxation can cause MOSFET
deterioratio n, the aim in this s tudy was therefore to
investi gate the effect of PDA on the relaxation behavior
of La-doped ZrO
2
. In this paper, we report the influence
of the annealing ambient on the dielectric relaxation
processes, which can be described by both the
Havriliak–Negami (HN) and Curie–von Schweidler (CS)
relationships [24-27] in the frequency range of 10 MHz.
Experimental
La-doped ZrO
2
films, with a thickness of 35 nm, were
deposited on n-type Si(100) substrates by liquid injec-
tion ALD at 300°C, using a modified Aixtron AIX
200FE AVD reactor configured for liquid injection [28].
Both Zr and La sources are Cp-based precursors
* Correspondence:
1
Department of Electrical and Electronic Engineering, Xi’an Jiaotong,
Liverpool University, 215123, Suzhou, Jiangsu China.
Full list of author information is available at the end of the article
Zhao et al. Nanoscale Res Lett 2011, 6:48
/>© 2010 Zhao et al. This is an Open Access article distributed under the terms of the Creative Comm ons Attribution License
( which permits unrestricted use, distribution, and reproduction in any medium, provided
the original work is properly cited.
([(MeCp)
2
ZrMe(OMe)] and [(
i
PrCp)
3
La]) [15,16]. The
composition of the La-doped ZrO
2
films was estimated
to be La
0.35
Zr
0.65
O
2
from Auger electron spectroscopy
(AES). Selected films were annealed at 700°C or 900°C
for 15 min, in an N
2
or air ambient.
The effects of PDA on the physical and electrical prop-
erties of the La
0.35
Zr
0.65
O
2
films have been investigated
using c ross-section transmission electron microscopy
(XTEM), X-ray diffraction (XRD), high– low frequency
capacitance–voltage (C–V), capacitance–frequency (C–f),
and current–voltage (I–V) measurements, respectively.
In order to perform the C–V, C–fandI–Vmeasure-
ments, metal (Au) gate electrodes were evaporated to
form metal– oxide– semiconductor capacitors (Au/
La
0.35
Zr
0.65
O
2
/IL/n-Si, where IL stands for interfacial
layer) with an effective contact area of 4.9 × 10
-4
cm
2
.
The backside of the Si wafer was cleaned with a buf-
fered HF solution, and subsequently a 200-nm-thick
film of Al was deposited to form an ohmic back contact.
AthermalSiO
2
sample was grown using dry oxidation
at 1100°C to provide a comparison with the high-k
stacks. Its back-side cont act was prepared in exactly the
same way as for all other La
0.35
Zr
0.65
O
2
samples: depos-
iting Al after HF treatment.
Results and Discussion
XRD was carried out using a Rikagu Miniflex X-ray dif-
fractometer with nickel-filtered Cu Ka radiation (l =
1.5405 Å) and a 2θ increment of 0.2° per minute, and
the results are shown in Figure 1. Results from the
as-deposited samples and samples annealed at 700°C
showed that the films were amorphous. XRD spectra
from both samples annealed at 900°C show two clear
diffract ion peaks at 29.3° and 33.9°, suggesting that crys-
tallization starts between 700 and 900°C. These peaks
correspond to the t- or c- phases, but it is difficult to
distinguish between them. Selected area diffraction
results (not shown) obtained using a TEM would sug-
gest that the cubic phase is the most likely.
XTEM was carried out on both the 900°C PDA sam-
ples using a JEOL 2000FX operated at 200 kV. XTEM
images in Figure 2 show that equiaxed nano-crystallites
of ~4 nm diameter were formed in the air-annealed
sample, in comparison with larger ~15-nm crystals
for the N
2
-annealed sample. The thickness of the
La
0.35
Zr
0.65
O
2
layersandtheILwasalsoobtainedby
XTEM. The 35-nm-thick La
0.35
Zr
0.65
O
2
layers retained
their thickness after PDA, but the IL increased from
1.5 nm on the as-deposited samples to 4.5 nm and
6 nm after PDA at 900°C in N
2
and in air, respectively,
which is attributed to either an internal or external oxi-
dation mechanism. Previous medium energy ion scatter-
ing (MEIS) results [16] showed the incorporation of
some La in the IL, which is reported to increase the
k-value of the IL from 3.9 (pure SiO
2
) to ~10 [29].
C–V and C–f measur ements were carried out using a
HP4192 impedance analyzer and an Agilent E4980A
LCR meter at various frequencies (20 Hz– 13 MHz) in
parallel mode. C–f measurements were performed at a
strong accumulation region (Vg = + 3 V). C–V mea-
surements were carried out from strong inversion
toward strong accumulation and vice versa. Three typi-
cal sets of C– V curves of the as-deposited and PDA
samples were shown i n Figure 3. PDA was found to
As-deposited
900
°
C in N
2
900
°
C in air
2
θ/
/
θ
(degree)
Intensity (arb. unit)
700
°
C in air
(101)
Figure 1 X-ray diffraction data for La
0.35
Zr
0.65
O
2
films
deposited by ALD and then annealed in air or N
2
for 15 min at
different temperatures.
900
°
C in N
2
900
°
C in air
Si
La
0.35
Zr
0.65
O
2
Si
20 nm
Figure 2 XTEM images from La
0.35
Zr
0.65
O
2
samples, which were
annealed in air and N
2
at 900°C for 15 min, respectively.
Zhao et al. Nanoscale Res Lett 2011, 6:48
/>Page 2 of 6
significantly reduce the hysteresis to ~10 mV (counter-
clockwise), independent of the annealing ambient. PDA
in air caused a negative shift of the C–V curves due to
positive charge generat ion and also caused an enhanced
accumulation capacitance, which originated from a
k-valueincreaseintheLa
0.35
Zr
0.65
O
2
layer. Positive
charge generation will be discussed first, and then the k-
value increase.
From the early days of silicon technology, thermal
oxidation of Si has been known to introduce fixed
positive charge at the Si/SiO
2
interface [30]. Posit ive
charge generation during high-temperature processing
is not new to thin film SiO
2
physics; its presence has
been detected ever since the pioneering era of Si oxi-
dationintheformoffixedoxidechargethatoften
develops during the oxidation process [31]. The pre-
sence of positively charged, over-coordinated oxygen
centers in SiO
2
has been suggested previously in the
work of Snyder and Fowler [32]. They showed that the
positive charge involved with the E’ oxygen-vacancy
center is in fact associated with over-coordination of
an O. Warren et al. suggested that the formation of
positively charged over-coordinated O defects is near
the Si/SiO
2
interface [33,34]. The effect of post-deposi-
tion oxidation of SiOx/Zr O
2
gate dielectric stacks at
different temperatures (500–700°C) on the density of
fixed charge was proposed by Houssa et al. [35]. They
indicated that increasing oxidation temperature, the
density of negative fixed charge is reduced. The net
positive charge observed after oxidation at >500°C
resembles the charge generated at the Si/SiO
2
interface
by hydrogen in the same temperatures range. They
proposed that the observed oxidation-induced positive
charge in the SiOx/ZrO
2
gate stack may be related to
over-coordinated oxygen centers induced by hydrogen.
This also matches our previous observations at the Si/
SiO
2
and Si/SiO
2
/HfO
2
structures [36,37].
Before discussing the k-value increase, the causes of fre-
quency dispersion must be totally understood. Figure 4 (a)
indicates that a large frequency dispersion was observed
during C– V measurements in the air-annealed sample.
There are five reasons that may ca use the frequ ency dis-
persion observed: (1) series resistances, (2) parasitic effects
(including back contact imperfection and cables and con-
nections), (3) leakage currents, (4) the interlayer between
La
0.35
Zr
0.65
O
2
layer and semiconductor silicon substrate,
or (5) a k-value dependence on frequency of the
La
0.35
Zr
0.65
O
2
dielectric. To obtain the genuine intrinsic
properties and permittivity of the La
0.35
Zr
0.65
O
2
dielectric
from the CV measurements, the first four effects must be
eliminated.
The effects of series resistances and parasitic effects
were reported in our previous work [38]. To minimize
the effects of series resistances and back conta ct imper-
fections (including contact resistance R, contact capaci-
tance C, or parasitic R– C coupled in series, etc.),
aluminum back contacts were deposited over a large
area of the substrate wafer that was cleaned with a buf-
feredHFsolutionbeforealuminumcontactswere
formed. The same procedure was carried out for all as-
deposited, N
2
-annealed, and air-annealed samples. All
samples tested had the same or very similar substrate
area (~2 × 2 cm
2
) to ensure that the effects of series
resistance and back contact imperfections were the
same for all samples. Furthermore, measurement cables
and connections were kept short to further minimize
parasitic capacitance effects and were the same for all
samples. To provide a comparison with Figure 4a, a
C– V measurement on a thermal SiO
2
sample with the
same HF treatment and Al deposition on its back w as
carried out from the same test system; the results are
shown in Figure 4b. It is clear that no frequency disper-
sion was observed on the thermal SiO
2
sample. There-
fore, the effects of se ries resistances and parasitic effects
are negligible.
The leakage current characteristics of the La-doped
films were evaluated from the I– V measurem ents,
as shown in Figure 5. At lo w oxid e fields (E
ox
at
0 to +2MV/cm), the leakage current density is improved
under positive gate biases after annealing, which is
attributed to the thicker IL. However, PDA also causes
crystallization that introduces leakage current pat hs and
reduces the break-down voltage. The leakage current
densities at +2MV/cm are 1.6 × 10
-5
Acm
-2
for as-
deposited samples, but below 5 × 10
-8
Acm
-2
after the
900°C PDA either in N
2
or in air. This suggests that the
0
50
100
150
200
250
300
-3 -2 -1 0 1 2 3 4
Vg (V)
C (pF)
f = 1kHz
900
°
C, N
2
, 15min
900
°
C, Air, 15min
as-
deposited
Figure 3 C–V measurements were carried out at frequency = 1
kHz for as-deposited and PDA samples.
Zhao et al. Nanoscale Res Lett 2011, 6:48
/>Page 3 of 6
effect of leakage currents on frequency dispersion is
negligible during C–V measurements.
Before k-value of the La
0.35
Zr
0.65
O
2
dielectric is
extracted from the strong accumulation capa citance
at +3 V (<+1MV/cm), the effect of the presence of the
lossy interlayer must be taken into account. The effect
was also reported in our previous work [38].
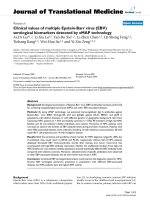
The relationship between the extracted k-value and
test frequency shown in Figure 6 indicates that signifi-
cant dielectric relaxation only occurs in the air-annealed
sample. Parasitic effects could not be the cause of the
frequency dispersion observed because of the sample
preparation and measurement procedures described
earlier. Significant frequency dispersion was not seen in
other MOSCs fabricated using the same substrates pre-
pared and measured in exactly the same way. We con-
clude therefore that the frequency dispersion observed
in the La
0.35
Zr
0.65
O
2
film annealed in air is a real mate-
rial property of this dielectric. There are two important
observations in Figure 6: (1) PDA in air increases the
01234567
Eox (MV/cm)
Jg (A/cm
2
)
V
BD
=+19V
As-deposited:
10
0
10
-2
10
-4
10
-6
10
-8
V
BD
=+21V
900
°
C in N
2
900
°
C in Air
V
BD
=+17.6V
Figure 5 The relationship between leakage current density (Jg)
and electric field (E
ox
) applied across the La
0.35
Zr
0.65
O
2
/IL (IL
stands for interfacial layer) stacks for as-deposited and PDA
samples. Break-down voltages (V
BD
) were indicated.
0
5
10
15
20
25
30
35
Frequency (Hz)
Real Permittivity
900
°
C in Air:
HN law
(
α
=0.1,
β
=0.6)
(
τ
=10
-5
s)
900
°
C in N
2
:
CS law (n=0.98)
as-deposited:
CS and HN laws
10
1
10
3
10
5
10
7
Figure 6 Frequency dependence of k-value of La
0.35
Zr
0.65
O
2
dielectric for as-deposited and PDA samples. Significant
dielectric relaxation was observed in the air-annealed sample. Solid
lines are the fitting results using equations (1) and (2).
0
50
100
150
200
250
300
-3 -2 -1 0 1 2 3 4
Vg(V)
C (pF)
1kHz
10kHz
100kHz
1MHz
900
°
C in Air
(a)
(b)
Figure 4 (a) C–V results at different frequencies from the air-
annealed sample. Significant frequency dispersion was observed.
(b) No frequency dispersion in C–V measurements was observed in
the thermal oxide (SiO
2
) sample with the back-side contact
prepared in the same way as for the LaZrO sample shown in (a).
Zhao et al. Nanoscale Res Lett 2011, 6:48
/>Page 4 of 6
k-value of the La
0.35
Zr
0.65
O
2
dielectric significantly
(k-value reaches 32 at 1 kHz), along with a signif icant
dielectric relaxation. (2) There is less of an effect on the
k-value for the film annealed in N
2
,withasmall
increase in k-value at some frequencies and a flatter fre-
quency response compared to the as-deposited sample.
Both effects of temperature/ambient and causes of
dielectric relaxation are discussed later.
Annealing at a high temperat ure is employed to
induce the t- and c-phases in the La-doped ZrO
2
dielec-
tric from the amorphous samples [15,16]. The addition
of La is to stabilize these phases, and the stabilized tet-
ragonal/cubic ZrO
2
phase gives a higher k-value [7-14].
Annealing temperature was reported to range from 400
to 1,050°C, depending on the deposition conditions and
substrates of high-k dielectrics that determine the
microstructure of the as-deposited samples. It was
reported that the germanium substrate requires lower
annealing temperatures ranging from 400 to 600°C
[7-11]. If the microstructure of the as-deposited LaZrO
2
samples had already been tetragonal/cubic, annealing at
high temperatures would not be necessary [9].
It has been shown previously that dielectric relaxation
in the time domain can be described by a power-law
time dependence, t
-n
[26,27], or a stretched exponent ial
time dependence, exp[-(t/t
0
)
m
] [39,40], where n and m
are parameters ranging between 0 and 1, and t
0
is a
characteristic relaxation time.
In the frequency domain, after a Fourier transform,
the corresponding dielectric response of t
-n
dependence
is well described in terms of Curie–von Schweidler (CS)
behavior [24,26,27], while the Fourier transform of exp
[-(t/t
0
)
m
] function into frequency domain can be
approximated by a Havriliak–Negami (HN) relationship
[25] , after a great deal of work [41-43]. The CS law and
HN relationship can be, respectively, expressed as
CS
n
Ai() ( )−=
∞
−1
(1)
HN s
i() ( )/−=− +
()
⎡
⎣
⎢
⎤
⎦
⎥
∞∞
−
1
1
(2)
where ε
s
and ε
∞
, are the static and high-frequency
limit permittivities, respectively; τ is the HN relaxation
time; ω =2πf is the angular frequency; and n, a,andb
are the relaxation parameters.
A theoretical description of the slow relaxation in
complex condensed systems is still a topic of active
research despite the great effort made in recent years.
There exist two alternative approaches to the interpreta-
tion of dielectric relaxation: the parallel and series mod-
els [44]. The parallel mode l represents the classical
relaxation of a large assembly of individual relaxing
entities such as dipoles, each of which relaxes with an
exponential probability in time but has a different
relaxation time t
k
. The total relaxation process corre-
sponds to a summation over the available modes k,
given a frequency domain response function, which can
be approximated by the HN relationship.
The alternative ap proach is the series model, which
can be used to describe briefly the origins of the CS law
(the t
-n
behavior). Consider a system divided into two
interacting sub-systems [45]. The first of these responds
rapidly to a stimulus generating a change in the interac-
tion which, in turn, causes a much slower response of
the second sub-system. The state of the total system
then corresponds to the excited first system together
with the unresponded second system and can be consid-
ered as a transient or metastable state, which slowly
decays as the second system responds.
In some complex condensed systems, neither the pure
parallel nor the pure series approach is accepted and
instead interpolates smoothly between these extremes
[46]. The CS behavior has to be faster than the HN
function at short times and slower than the HN func-
tion at long times.
Based on the discussion above, the dielectric relaxa-
tion results (shown in Figure 6) have been modeled with
the CS and/or HN relationships (see solid lines in
Figure 6). The relaxation of the as-deposited film obeyed
a mixed CS and HN relationships. After the 900°C PDA,
the relaxation behavior of the N
2
-annealed film was
dominated by the CS law, whereas the air-annealed film
was predominantly modeled by the HN relationship that
was accompanied by a sharp drop in the k-value.
Although the exact microstructural c ause of these
relaxation processes is not clearly known, several
mechanisms for the dielectr ic relaxation have been pro-
posed, including distribution of relaxation time [47], dis-
tribution of hopping probabilities [48], space charge
trapping [49], self-similar multi-well potential for ionic
configurations [45], or double potential well occupied by
one electron [50]. However, it has been reported that a
decrease in crystal grain size can cause an increase in
the dielect ric relaxati on in ferroelectric relaxor ceram ics
[51,52]. This relaxation effect has been attributed to
higher stresses in the smaller grains [51]. A similar
effect appears to have occ urred with these La-doped
dielectric films, with the 900°C air anneal producing
4-nm diameter equiaxed na no-crystallites within the
film, and suffering from a severe dielectric relaxation.
The 900°C N
2
-annealed film contains much larger
~15- nm crystals and does not suffer from seve re dielec-
tric relaxation. Therefore, the physical processes behind
the relaxation are probably related to the size of the
crystal grains formed during annealing.
Zhao et al. Nanoscale Res Lett 2011, 6:48
/>Page 5 of 6
Conclusions
PDA at 900°C either in N
2
or in air causes crystalliza-
tion (t- or c-phases) of the La
0.35
Zr
0.65
O
2
dielectric. Lar-
ger crystal grain sizes were observed in the N
2
-annealed
sample than in the air-annealed sample. Following PDA
in N
2
, the k-value was maintained and the dielectric
relaxation was reduced. However, PDA in air causes a
significant increase in k-value (32 at 1 kHz) and a signif-
icant dielectric relaxation , probably associated with
smaller crystal grain sizes. The relaxation behavior of
the as-deposited sample can be modeled using the
mixed CS and HN relationships. PDA in N
2
suppressed
the HN law, while the CS law was removed following
PDA in air.
Acknowledgements
This research was funded in part from the Engineering and Physical Science
Research Council of UK under the grant EP/D068606/1, the National Natural
and Science Foundation of China under the grant no. 60976075, and the
Suzhou Science and Technology Bureau of China under the grant
SYG201007.
Author details
1
Department of Electrical and Electronic Engineering, Xi’an Jiaotong,
Liverpool University, 215123, Suzhou, Jiangsu China.
2
Department of
Electrical Engineering and Electronics, University of Liverpool, Liverpool, L69
3GJ, UK.
3
Department of Engineering, Materials Science and Engineering,
University of Liverpool, Liverpool, L69 3GH, UK.
4
Department of Chemistry,
University of Liverpool, Liverpool, L69 3ZD, UK.
Received: 13 April 2010 Accepted: 9 September 2010
Published: 30 September 2010
References
1. Boscke TS, Govindarajan S, Fachmann C, Heitmann J, Avellan A, Schroder U,
Kirsch PD, Krug C, Hung PY, Song SC, Ju BS, Price J, Pant G, Gnade BE,
Krautschneider W, Lee B-H, Jammy R: Tech Dig Int Electron Devices Meet
2006, 255.
2. Lu N, Li H-J, Peterson JJ, Kwong DL: Appl Phys Lett 2007, 90:082911.
3. Darmawan P, Lee PS, Setiawan Y, Ma J, Oscipowicz T: Appl Phys Lett 2007,
91:092903.
4. Lopes JMJ, Littmark U, Roeckerath M, St Lenk , Schubert J, Mantl S,
Besmehn A: J Appl Phys 2007, 101:104109.
5. Mavrou G, Galata S, Tsipas P, Sotiropoulos A, Panayiotatos Y, Dimoulas A,
Evangelou EK, Seo JW, Dieker Ch: J Appl Phys 2008, 103:014506.
6. Abermann S, Bethge O, Henkel C, Bertagnolli E: Appl Phys Lett 2009,
94:262904.
7. Abermann S, Henkel C, Bethge O, Pozzovivo G, Klang P, Bertagnolli E:
Applied Surface Science 2010, 256:5031.
8. Mavrou G, Tsipas P, Sotiropoulos A, Galata S, Panayiotatos Y, Dimoulas A,
Marchiori C, Fompeyrine J: Appl Phys Lett 2008, 93:212904.
9. Tsoutsou D, Apostolopoulos G, Galata S, Tsipas P, Sotiropoulos A, Mavrou G,
Panayiotatos Y, Dimoulas A: Microelectron Eng 2009, 86:1626.
10. Tsoutsou D, Lamagna L, Volkos SN, Molle A, Baldovino S, Schamm S,
Coulon PE, Fanciulli M: Appl Phys Lett 2009, 94:053504.
11. Lamagna L, Wiemer C, Baldovino S, Molle A, Perego M, Schamm-Chardon S,
Coulon PE, Fanciulli M: Appl Phys Lett 2009, 95:122902.
12. Vanderbilt D, Zhao X, Ceresoli D: Thin Solid Films 2005, 486:125.
13. Zhao X, Vanderbilt D: Phys Rev B 2002, 65:233106.
14. Govindarajan S, Boscke TS, Sivasubramani P, Kirsch PD, Lee BH, Tseng H-H,
Jammy R, Schroder U, Ramanathan S, Gnade BE: Appl Phys Lett 2007,
91:062906.
15. Gaskell JM, Jones AC, Aspinall HC, Taylor S, Taechakumput P, Chalker PR,
Heys PN, Odedra R: Appl Phys Lett 2007, 91:112912.
16. Gaskell JM, Jones AC, Chalker PR, Werner M, Aspinall HC, Taylor S,
Taechakumput P, Heys PN: Chem Vap Deposition 2007, 13 :684.
17. Boscke TS, Govindarajan S, Kirsch PD, Hung PY, Krug C, Lee BH, Heitmann J,
Schroder U, Pant G, Gnade BE, Krautschneider WH: Appl Phys Lett 2007,
91:072902.
18. Mueller W, Aichmayr G, Bergner W, Erben E, Hecht T, Kapteyn C, Kersch A,
Kudelka S, Lau F, Luetzen J, Orth A, Nuetzel J, Schloesser T, Scholz A,
Schroeder U, Sieck A, Spitzer A, Strasser M, Wang PF, Wege S, Weis R: Tech
Dig –Int Electron Devices Meet 2005, 34.
19. Fu Chung-Hao, Chang-Liao Kuei-Shu, Wang Tien-Ko, Tsai WF, Ai CF:
Microelectronic Engineering 2010, 87:2014.
20. Xiong Yuhua, Tu Hailing, Du Jun, Ji Mei, Zhang Xinqiang, Wang Lei: Appl
Phys Lett 2010, 97:012901.
21. Southwick GRichard, Reed Justin, Buu Christopher, Butler Ross,
Bersuker Gennadi, Knowlton BWilliam: IEEE Tran Device and Materials
Reliability 2010, 10:201.
22. Kim Joo-Hyung, Ignatova AVelislava, Kücher Peter, Weisheit Martin,
Zschech Ehrenfried: Current Applied Physics 2009, 9:e104.
23. Martin Dominik, Grube Matthias, Weber MWalter, Rüstig Jürgen,
Bierwagen Oliver, Geelhaar Lutz, Riechert Henning: Appl Phys Lett 2009,
95:142906.
24. Jonscher AK: Dielectric Relaxation in Solids Chelsea Dielectric Press, London;
1983.
25. Havriliak S, Negami S: Polymer 1967, 8:161.
26. Curie J: Ann Chim Phys 1889, 18:203.
27. von Schweidler E: Ann Phys 1907, 24:711.
28. Potter RJ, Chalker PR, Manning TD, Aspinall HC, Loo YF, Jones AC,
Smith LM, Critchlow GW, Schumacher M: Chem Vap Deposition 2005,
11:159.
29. Watanabe H, Ikarashi N, Ito F: Appl Phys Lett 2003, 83:3546.
30. Cheng YC: Prog Surf Sci 1977, 8:181, and references therein.
31. Deal BE, Sklar M, Grove AS, Snow EH: J Electrochem Soc 1967, 114:266.
32. Synder KC, Fowler WB: Phys Rev B 1993, 48:13238.
33. Warren WL, Vanheusden K, Schwank JR, Fleetwood DM, Winokur PS,
Devine RAB: Appl Phys Lett 1996, 68:2993.
34. Warren WL, Vanheusden K, Fleetwood DM, Schwank JR, Shaneyfelt MR,
Winokur PS, Devine RAB: IEEE Tran Nuclear Science 1996, 43:2617.
35. Houssa M, Afanas’ev VV, Stesmans A, Heyns MM: Appl Phys Lett 2000,
77:1885.
36. Zhang JF, Zhao CZ, Groeseneken G, Degraeve R, Ellis JN, Beech CD: J Appl
Phys 2001, 90:1911.
37. Zhao CZ, Zhang JF, Chang MH, Peaker AR, Hall S, Groeseneken G,
Pantisano L, De Gendt S, Heyns M: J Appl Phys 2008, 103:014507.
38. Taechakumput P, Zhao CZ, Taylor S, Werner M, Chalker PR, Gaskell JM,
Jones AC, Drobnis M: In “Origin of Frequency Dispersion in High-k Dielectrics”,
Semiconductor Technology Conference (ISTC2008), Proceeding of the 7th
International Conference on Semiconductor Technology Edited by: Ming Yang
2008, 20-26, ISBN 978-988-17408-1-6.
39. Kohlrausch F: Pogg Ann Phys 1863, 119:352.
40. Williams G, Watts DC: Trans Faraday Soc 1970, 66 :80.
41. Alvarez F, Alegria A, Colmenero J: Phys Rev B 1991, 44:7306.
42. Bello A, Laredo E, Grimau M: Phys Rev B 1999, 60:12764.
43. Bokov AA, Mahesh Kumar M, Xu Z, Ye Z-G: Phys Rev B 2001, 64:224101.
44. Jonscher AK: Universal Relaxation Law–A sequel to Dielectric Relaxation in
Solids Chelsea Dielectrics Press, London; 1996.
45. Dissado LA, Hill RM: Nature 1979, 279:685.
46. Hunt A: J Non-Crystalline Solids 1995, 183:109.
47. Waser R, Klee M: Inter Ferro 1992, 2:257.
48. Scher H, Montroll EW: Phys Rev B 1975, 12:2455.
49. Wolters SR, Van Der Schoot JJ: J Appl Phys 1985, 58:831.
50. Reisinger H, Steinlesberger G, Jakschik S, Gutsche M, Hecht T, Leonhard M,
Schroder U, Seidl H, Schumann D: Tech Dig –Int Electron Devices Meet 2001,
267.
51. Yu H, Liu H, Hao H, Guo L, Jin C, Yu Z, Cao M: Appl Phys Lett 2007,
91:222911.
52. Sivakumar N, Narayanasamy A, Chinnasamy CN, Jeyadevan B: J Phys:
Condens Matter 2007, 19:386201.
doi:10.1007/s11671-010-9782-z
Cite this article as: Zhao et al.: Dielectric Relaxation of La-Doped
Zirconia Caused by Annealing Ambien t. Nanoscale Res Lett 2011 6:48.
Zhao et al. Nanoscale Res Lett 2011, 6:48
/>Page 6 of 6