Báo cáo hóa học: " Research Article Impact of LQI-Based Routing Metrics on the Performance of a One-to-One Routing Protocol for IEEE 802.15.4 Multihop Networks" docx
Bạn đang xem bản rút gọn của tài liệu. Xem và tải ngay bản đầy đủ của tài liệu tại đây (1.98 MB, 20 trang )
Hindawi Publishing Corporation
EURASIP Journal on Wireless Communications and Networking
Volume 2010, Article ID 205407, 20 pages
doi:10.1155/2010/205407
Research Article
Impact of LQI-Based Routing Metrics on
the Performance of a One-to-One Routing Protocol for
IEEE 802.15.4 Multihop Networks
Carles Gomez,
1
Antoni Boix,
2
and Josep Paradells
3
1
Escola Polit
`
ecnica Superior de Castelldefels, Universitat Polit
`
ecnica de Catalunya (UPC),
C/Esteve Terradas, 7, 08860 Castelldefels, Spain
2
Wireless Networks Group (WNG), Fundaci
´
o i2cat, C/Gran Capit
`
a2-4,EdificiNexusI,
2
a
Planta, Despatx 203, 08034 Barcelona, Spain
3
Escola T
`
ecnica Superior d’Enginyeria de Telecomunicaci
´
o de Barcelona,
Universitat Polit
`
ecnica de Catalunya (UPC), C/Jordi Girona 1-3, 08034 Barcelona, Spain
Correspondence should be addressed to Carles Gomez,
Received 13 February 2010; Revised 16 June 2010; Accepted 26 July 2010
Academic Editor: Dan Wang
Copyright © 2010 Carles Gomez et al. This is an open access article distributed under the Creative Commons Attribution License,
which permits unrestricted use, distribution, and reproduction in any medium, provided the original work is properly cited.
The quality of an IEEE 802.15.4 link can be estimated on the basis of the Link Quality Indication (LQI), which is a parameter offered
by the IEEE 802.15.4 physical layer. The LQI has been recommended by organizations such as the ZigBee Alliance and the IETF
as an input to routing metrics for IEEE 802.15.4 multihop networks. As these networks evolve, one-to-one communications gain
relevance in many application areas. In this paper, we present an in-depth, experimental study on the impact of LQI-based routing
metrics on the performance of a one-to-one routing protocol for IEEE 802.15.4 multihop networks. We conducted our experiments
in a 60-node testbed. Experiments show the spectrum of performance results that using (or not) the LQI may yield. Results also
highlight the importance of the additive or multiplicative nature of the routing metrics and its influence on performance.
1. Introduction
The IEEE 802.15.4 standard [1, 2] specifies the Physical layer
(PHY) and Medium Access Control (MAC) functionality of a
Low-power, low-rate Wireless Personal Area Network (LoW-
PAN) technology conceived for a wide variety of control and
monitoring applications. IEEE 802.15.4 is primarily targeted
at simple and low-cost devices, including several types of
embedded systems, sensors, and actuators.
IEEE 802.15.4 supports star and peer-to-peer topologies.
The peer-to-peer topology is based on a multihop paradigm
and is suitable for a plethora of scenarios, including indus-
trial, agricultural, forest, urban, and vehicular environments,
among others. For practical reasons, ad hoc, self-configuring,
and self-healing routing functionality is commonly used in
these application spaces [3–9].
The requirements for routing techniques in low-power
environments are highly dependent on applications. Several
routing protocols have been specifically developed for data-
collection sensor networks [5–7], which are characterized
by a many-to-one (or many-to-few) paradigm. Nevertheless,
applications that exhibit one-to-one communication needs
are gaining relevance. Some examples include interdevice
communication in home automation, building automation
and query and control in industrial, structural, and urban
monitoring [3, 8, 9]. Many routing protocols that are
currently used for this application space are descendants of
the Ad hoc On-demand Distance Vector (AODV) routing
protocol [10]. Examples of these are the mesh routing func-
tionality of the ZigBee stack [4], the one-to-one mechanism
of the IPv6 Routing Protocol for Low-power and lossy
networks (RPL), which is being specified by the IETF ROLL
Working Group (WG) [11],andotherapproachesfoundin
commercial platforms and in the literature [12–15].
One of the key factors for network performance in
a wireless multihop network is the routing metric. The
2 EURASIP Journal on Wireless Communications and Networking
consideration of link quality as an input to routing has
proved to be a powerful approach in IEEE 802.11-based mesh
environments [16, 17]. In the IEEE 802.15.4 context, many
research efforts have already been devoted to link quality
estimation [18–22]. Most of these efforts have focused on
the link quality indication (LQI), which is a parameter
offered by the IEEE 802.15.4 PHY. The aim of the LQI
is to represent the quality of a link, as perceived by the
receiver of a frame at the moment of frame reception.
Hence, the LQI is a good candidate for consideration as
an input to routing metrics. In fact, the ZigBee standard
[4], the IETF 6LoWPAN WG [23], and recent proposals
within the IETF ROLL WG [24] recommend its use.
However, this approach has received little attention, with a
few exceptions which did not focus on one-to-one routing
[21, 25].
In this paper, we present an in-depth, experimental
study on the impact of using the LQI in routing metrics
for a routing protocol based on AODV, which is called
Not So Tiny-AODV (NST-AODV) [26]. The experiments
conducted show the spectrum of performance results that
using (or not) LQI-based metrics may yield and allow
to derive guidelines for the design of LQI-based rout-
ing metrics. While our work focuses on NST-AODV, we
believe that the study will contribute to understanding the
influence of LQI-based routing metrics on other routing
approaches.
The remainder of the paper is organized as follows.
Section 2 gives an overview of the routing protocol used in
our experiments. Section 3 reviews link quality estimation
techniques in low-power wireless networks. Section 4 surveys
the main link quality-based routing metrics for the same
environments. Section 5 describes the 60-node testbed used
in this work. Section 6 presents an experimental characteri-
zation of the LQI parameter and discusses the use of LQI for
routing metrics. Section 7 evaluates the performance of NST-
AODV using the Hop count metric and three LQI-based
routing metrics, which were selected from those examined in
Section 4: (i) PATH-DR [21], which is aimed at choosing the
paths with the maximum delivery ratio; (ii) the link quality-
based metric for ZigBee mesh routing [4]; (iii) a metric
called LETX, which aims to select the paths that require
the minimum number of transmission attempts. Section 8
studies the performance of these routing metrics in the
presence of background traffic. Finally, Section 9 concludes
the paper with the main remarks and a discussion of future
work.
2. Routing Protocol
The routing protocol we consider in our study is NST-AODV,
an adaptation of AODV for IEEE 802.15.4 environments.
This section first provides background on AODV. Then, it
summarizes the particular features of NST-AODV.
2.1. AODV Overview. AODV is a reactive routing protocol.
When a node requires a route, it initiates a route discovery
procedure by broadcasting Route Request (RREQ) messages.
Each node rebroadcasts RREQs, unless it has a valid route
entry to the destination or it is the destination itself. In
this case, it sends a Route Reply (RREP) message back to
the originator node and ignores any subsequent RREQs
that are transmitted through alternative routes. Backward or
forward next-hop routing entries are created at each node
that receives an RREQ or an RREP, respectively. Route entries
expire after a specified time if the route becomes inactive
(i.e., it is not used for data transmission). For each route
entry of a node, there is a precursor list that contains the
nodes that use this one as the next hop in the path to a
given destination. The loop-freedom of routes towards a
destination is guaranteed by means of a destination sequence
number, which is updated when new information about that
destination is received.
When a link in an active path breaks, the upstream node
that detects this break may try to locally repair the route
if the destination is close to the node. This is an optional
mechanism. If local repair cannot be completed successfully
or it is not supported, the node that detects the link break
creates a Route Error (RERR) message, which reports the
set of unreachable destinations. This message is sent to
precursor nodes. Then, the source of the active path starts a
new route discovery phase if a route to the destination is still
needed. Data packets waiting for a route should be buffered
during route discovery.
An AODV node that belongs to an active route may
periodically broadcast local Hello messages for connectivity
management. However, this approach may be expensive if
nodes are battery-powered. Other strategies include link
layer mechanisms. For example, unsuccessful layer two
transmissions may be used as an indication of a link break
for AODV. This method is known as Link Layer Notification
(LLN).
2.2. NST-AODV. NST-AODV is a routing solution which
was implemented in nesC language for devices running
TinyOS [27]. It was developed on the basis of TinyAODV
(Release 3) [28], to which several features were added
to improve its reliability and to better support dynamic
topologies [26]. The main characteristics of NST-AODV are
summarized below.
(i) An LLN mechanism is enabled by default. This
requires the protocol to run on top of the IEEE
802.15.4 reliable mode (where a node that correctly
receives a data frame sends an acknowledgement
frame to the sender).
(ii) After an unsuccessful link layer transmission, up to
two additional retries triggered by layer three can be
performed.
(iii) When a packet leads to link failure detection due to
three consecutive, unsuccessful layer three transmis-
sion attempts, it is buffered and transmitted if a new
route can be found. This may happen either if the
node that detects the break is the originator itself or
if it is an intermediate node that locally repairs the
route.
EURASIP Journal on Wireless Communications and Networking 3
The implementation consumes 957 bytes of RAM and 4664
bytesofROM.ForadetailedcomparisonofNST-AODVand
other routing solutions, the reader can refer to the literature
[26].
3. Link Quality Estimation in
Low-Power Wireless Networks
Wireless communications suffer from a plethora of phe-
nomena that make correct reception of transmitted data an
uncertain event in many cases. Ideally, a routing protocol for
a wireless multihop network should favor the use of good-
quality links. The quality of the link between a sender and a
receiver is generally modeled by the probability of successful
frame transmission of that link. We denote this probability
the Link Delivery Ratio (LDR). The main techniques for esti-
mating link quality in low-power networks can be classified
into (i) packet-based techniques and (ii) radio hardware-
based techniques. Recent studies have experimented with
combinations of both techniques [22].
3.1. Packet-Based Techniques. Packet-based approaches esti-
mate the LDR (or related performance metrics) of a link
by computing the ratio between the number of received
and expected packets during a given time window. There
are two main options for implementing this scheme: (i)
active techniques, in which control packets are transmitted
for this purpose [29, 30] and (ii) passive techniques, also
known as snooping, in which data packets are assumed to use
sequence numbers, and nodes keep track of the number of
lost messages during a given time interval [4, 5, 31]. Despite
their benefits, these two approaches require time and state to
produce a result [19, 20, 31]. Furthermore, the first one may
lead to additional energy consumption.
3.2. Radio Hardware-Based Techniques: LQI versus RSSI.
To overcome the time and state limitations of existing
schemes, many researchers considered the use of PHY
parameters from off-the-shelf radio hardware [18–21]. Many
radio chips that implement proprietary radio technologies
provide the received signal strength indicator (RSSI), which
is the strength of a received radiofrequency (RF) signal.
Furthermore, IEEE 802.15.4-compliant radio chips, like the
widely used Chipcon CC2420 [32], also offer the LQI. As
defined by the standard, measurement of the LQI may be
implemented by means of receiver energy detection, signal-
to-noise ratio estimation, or a combination of these methods
[4].
The CC2420, which has become the de facto IEEE
802.15.4 radio chip, measures the RSSI based on the average
energy level of eight symbols of the incoming packet.
Since the use of RSSI to calculate the LQI may lead to
spurious quality indications, the CC2420 chip also provides
a correlation value that is based on the first eight symbols of
the incoming packet. This correlation value is in the range
of 50 to 110, where 50 corresponds to the lowest quality
frames detectable by the chip and 110 indicates a maximum
quality frame. According to the standard, the LQI value is
Table 1: Summary of experiment results reported in various
papers.
Wor k
Correlation coefficient
Average LQI and LDR/PER Average RSSI and LDR/PER
[17] 0.73 0.43
[25] 0.90 0.56
[34] 0.80 0.55
represented by one byte. For this reason, Chipcon suggested
the use of a linear conversion of the correlation values into a
range of 0 to 255, using empirical methods based on Packet
Error Rate (PER) measurements. In addition, the LQI value
may be obtained by combining the correlation and RSSI
values. However, the LQI values have been assumed to be the
correlation values in the relevant literature, without the range
conversion [18–21].
Since the advent of CC2420, many efforts have been
devoted to the comparison of the LQI and the RSSI
as parameters for link quality estimation under different
conditions [16–19, 25, 33]. All these studies agree that the
average LQI has a greater correlation with LDR or with the
Packet Error Rate (PER) than the RSSI. Ta bl e 1 summarizes
some of the results.
These results are reasonable, as several phenomena
may increase the RSSI measured by the receiver, while
they may reduce the actual link quality. Some examples
are the superposition of multipath components arriving
from different paths [19] and the presence of narrowband
interference [32]. Consequently, we will use the LQI for link
quality estimation.
4. Link Quality-Based Routing Metrics for
Low-Power Wireless Networks
This section surveys the most relevant link quality-based
routing metrics that are suitable for low-power wireless
networks. Routing metrics based on other principles (e.g.,
energy-aware ones) are outside the scope of this paper. For
comparison purposes, the Hop count metric is included
in the survey. We are interested in selecting a set of link
quality metrics that fulfil the following requirements: (i) they
can be implemented easily, based on the LQI; (ii) they are
appropriate for the nature of NST-AODV (i.e., they do not
require transmission of additional control messages); and
(iii) they take into account the qualities of all the links of a
path in the computation of the path cost.
4.1. Hop Count. Hop count was the default routing metric of
the first routing protocols for wireless (and wired) networks.
This metric is simple, which is an interesting property for
networks composed of constrained devices. If the quality
of all links in the network is the same, the Hop count
metric selects the best paths. Unfortunately, real networks
are typically composed of links of varying quality. Hence,
this metric favors the use of short paths (in hops), even if
4 EURASIP Journal on Wireless Communications and Networking
these paths may offer poorer performance than longer paths
of higher quality.
4.2. Shortest Path with Link Quality Threshold. The metric
defined as SP(t)[5] is based on a shortest path (i.e., hop
count) approach that excludes links whose quality is below
a threshold t. Link quality is estimated using snooping
techniques. This metric avoids the use of bad quality links,
but it does not distinguish the quality of the links that are
considered for path selection.
4.3. Link Quality Routing. One of the first attempts at rout-
ing based on link qualities in a low-power wireless network
[35] was carried out using the Destination Sequenced Dis-
tance Vector (DSDV) routing protocol [36]. The quality of a
link was obtained as the minimum snooped Path Delivery
Ratio (PDR) in each direction between a pair of nodes.
To calculate the link cost, each link quality was categorized
into one of four classes. Then, it was converted into a link
cost by transforming the average PDR of the corresponding
category to the log scale, and then normalizing to the integer
domain. The path cost was calculated as the sum of the costs
of the links that compose the path. As adding link costs is
equivalent to multiplying the packet delivery rates of each
link, the principle behind this routing metric is to maximize
the PDR. However, the computation of the link cost leads to
a loss of accuracy of the metric.
4.4. ETX. The expected transmission count (ETX) metric
[17] was one of the first attempts to increase performance in
high rate (e.g., IEEE 802.11-based) wireless mesh networks,
as an alternative to the Hop count metric. ETX estimates the
expected number of transmissions of a packet through a link.
This metric has been widely adopted in such environments,
as a node only needs to compute the packet error probability
in transmission and reception, denoted as d
f
and d
r
in
(1), respectively. Both link directions are considered, since
layer two acknowledgment-based Automatic Repeat reQuest
(ARQ) mechanisms are used in many technologies. The cost
of a path is the sum of the ETX values of the links of the
path. Hence, the ETX metric aims to select the path with
the smallest number of total link layer transmission attempts,
which favors the selection of high throughput paths, by using
the link cost defined as follows:
ETX
=
1
d
f
×d
r
. (1)
The computation of the ETX metric of a link is usually based
on the periodic transmission of broadcast probe messages
to neighbors and a count of the related replies in defined
time intervals [17]. It is typically implemented with Hello
messages [30, 37]. Low-power environments cannot afford
to use periodic transmission of control messages at a certain
rate, since this may lead to premature battery depletion.
In some cases, ETX has been adopted as a mechanism for
estimating link quality during specific training periods in
many-to-one sensor network schemes [29]. In low-power
networks, the same metric has been renamed as Minimum
Transmission (MT) and implemented using snooping tech-
niques, under the assumption of a minimum data transmis-
sion rate for each node to allow for a link quality estimation
[5].
4.5. MultiHopLQI. One of the first attempts at a link quality
estimator for a routing protocol based on the LQI was
MultiHopLQI [6], which was actually an evolution of the
aforementioned many-to-one scheme proposed in [5]. A
path cost metric is computed as the sum of the link costs of
the path. The cost of a link is inversely proportional to the
LQI.
4.6. ZigBee Metric. The ZigBee specification defines a path-
cost metric which is computed as the sum of the link costs of
the path. Let φ(l) be an estimate of the LDR of a link l.The
link cost, denoted by C(l) of link l is defined as follows [4]:
C
(
l
)
=
⎧
⎪
⎪
⎪
⎨
⎪
⎪
⎪
⎩
7,
min
7, round
1
φ
(
l
)
4
.
(2)
In effect, the ZigBee specification provides implementers
with two options for computing the link cost: (i) the link
cost is always equal to 7 or (ii) the link cost is related to
the reciprocal of the LDR of the link. The first option is
equivalent to the Hop count metric. The second one, which
hereafter we will refer to as the ZigBee routing metric, was
designed to reflect the number of expected transmission
attempts required to get a packet through on that link, which
is actually emphasized, since the exponent in the formula is
4. In this case, cost values are integer numbers in the interval
between 1 and 7, in which an ideal link has a link cost value
equal to 1. A drawback of this second option is that, though
the quality of each link of a path is taken into account, the
round() function introduces quantification error, which may
preclude the metric from achieving the best performance.
Note that this error grows with the path hop count. Finally,
the ZigBee specification does not mandate the method for
computing the LDR estimation, but it suggests two options:
the first one is based on counting received beacons and data
frames and observing the appropriate sequence numbers;
the second one is based on the use of average LQI, which
is mentioned as “the most straightforward method” in the
specification [4].
4.7. Hop Count While Avoiding Weak Links. The hop count
while avoiding weak links metric aims to select the path with
the smallest number of “weak” links, that is, links whose LQI
is below a certain threshold value [38].Themetricisdefined
as follows. Let WL and HC denote the number of weak links
and the hop count of a path, respectively. The route cost is a
tuple of (WL, HC), which is ordered lexicographically. That
is, the path with the minimum WL is selected by the metric.
If more than one path has the same WL value, then the one
with the smallest HC is chosen. This metric was proposed as
an adaptation of AODV for LoWPANs.
EURASIP Journal on Wireless Communications and Networking 5
The main drawbacks of this metric are that it does not
distinguish the qualities of the good links of a path, and the
fact that it may not take into consideration the hop count of
a path.
4.8. MAX-LQI and RQI. In the MAX-LQI metric [21], the
path with the best worst link is selected. This is the path with
the highest minimum LQI over the links of the path. The
formal definition of the metric is as follows. Let P be the set
of available paths between the sender and receiver. Let p be a
path such that p
∈ P.LetL
p
be the set of links of the path p.
The path p
∗
is selected as
p
∗
= arg max
p∈P
min
l∈L
p
LQI
(
l
)
. (3)
This metric was defined to enhance the performance of
the adaptive demand-driven multicast routing (ADMR)
protocol [39]. It was implemented using the LQI values of the
control messages involved in the route discovery procedure.
Another metric, called the Route Quality Indicator
(RQI), is equivalent to MAX-LQI. The RQI of a path is
defined as the minimum LQI of the links of that path. The
path with the greatest RQI between the sender and receiver is
selected [40].
MAX-LQI/RQI is not an accurate metric, since it only
considers the quality of the worst link of a path. It does not
explicitly take into account the other characteristics of the
path, such as the hop count or the LQI of the rest of the links.
4.9. PATH-DR. PATH-DR is a metric defined to select the
path with the greatest PDR between a sender and a receiver
[21]. This metric requires an estimation of the LDR of each
link. It selects a path p
∗
as
p
∗
= arg max
p∈P
l∈L
P
φ
(
l
)
,(4)
φ(l) was obtained as a function of the LQI values of the link l.
The metric was also used for ADMR. The PATH-DR metric
aims to choose the paths with the highest PDR, regardless of
the number of hops. Note that the metric takes into account
the quality of all the links of a path.
4.10. LETX. We introduce a routing metric called LQI-based
ETX (LETX), which defines the link cost as follows:
LETX
(
l
)
=
1
φ
(
l
)
,(5)
where φ(l) is obtained as a function of the LQI of the link.
The link cost is an estimate of the number of transmission
attempts required for successful frame delivery in a link.
The path cost is the sum of the link costs of the path. The
metric takes into consideration the quality of all the links of
a path.
Note that LETX has the same aim as ETX. However,
ETX requires frequent (generally, periodic) transmission of
control messages or data packets through all links in order
to estimate the quality of those links. Hence, even if no data
transmissions are carried out in a network, ETX requires a
minimum amount of transmissions in the network. Instead,
LETX relies on LQI-based LDR estimation, which can be
done by using a single LQI value (as we argue in Section 6.3).
This is adequate for a reactive routing approach (e.g., the
one considered in this paper), because the LETX metric can
be computed “on the fly” during route discovery, without
additional transmission of packets for LDR estimation. We
evaluate the performance of LETX for NST-AODV in this
paper.
4.11. Summary of Link Quality Routing Metric s for Low-Power
Wireless Networks. Ta bl e 2 summarizes the main features
of the link quality-based routing metrics presented in this
section. Packet-based estimation schemes are generally used
in proactive approaches, since link quality can be estimated
by measuring the reception rates of control messages.
Reactive approaches exploit the use of the LQI values of
the control messages involved in route discovery procedures.
ZigBee, PATH-DR, and LETX routing metrics enable the
calculation of the cost of a path, based on the LQI values of
all links. Therefore, we chose to evaluate the performance of
these LQI-based routing metrics for NST-AODV. Note that
the PATH-DR metric was originally designed for a one-to-
many routing protocol. However, it can easily be adapted to
a one-to-one approach.
5. Testbed Description
We conducted an experimental evaluation of LQI-based
routing metrics for NST-AODV on an indoor, two-
dimensional wooden grid to which 60 TelosB motes [33]
are attached. The size of the grid is 4.5 m
× 8.1 m. The
testbed can be considered a 6
× 10-node matrix, in which
the distance between two consecutive motes is 0.9 m either
in a row or in a column. The grid hangs from the ceiling of
our laboratory with nylon strings, at a distance of 2.5 m from
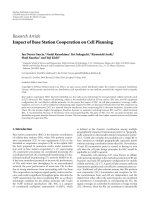
the ground and 0.5 m from the ceiling. We took advantage of
the Universal Serial Bus (USB) interface of the TelosB motes
to allow communication between them and a desktop. For
this purpose, we designed a three-level tree topology USB
network composed of active hubs and cables. Since the hubs
are active, all the nodes are mains-powered, which prevents
two undesired effects: (i) battery replacement of the nodes
and (ii) a decrease in the transmission power of the nodes as
the experiments are carried out. In particular, the prevention
of the second effect ensures that the same conditions can
bemetateachnode.Figure 1 shows a picture of the grid.
Other testbeds which were developed with similar goals are
MoteLab [41]andMirage[34].
The TelosB motes use the Chipcon CC2420 radio chip,
which operates in the 2.4 GHz band. The TinyOS version
running in the motes for all the experiments was 2.1.1 and
the IEEE 802.15.4 beaconless mode was used. The channel
selected was number 26, since this minimizes interference
with other systems operating in the same band (e.g., IEEE
802.11) [42]. In order to better understand transmission
performance, all motes were positioned in the same way,
since the TelosB antenna is not omnidirectional.
6 EURASIP Journal on Wireless Communications and Networking
Table 2: Comparison of the main characteristics of routing metrics used in low-power wireless networks.
Routing metric
Properties of the metric
Hop count
Awareness of link
quality
Quality of all links
is distinguished
Link quality
estimation method
Nature of the
routing protocol
Hop count Yes No No — —
Shortest path with
link quality
threshold [5]
Yes, (considers
only good quality
links)
Ye s N o
Packet-based
techniques
Proactive,
one-to-one
Link quality
routing [35]
Yes (implicitly) Yes
Ye s
(quantification)
Packet-based
techniques
Proactive,
one-to-one
ETX [17]/MT [5] Yes (implicitly) Yes Yes
Packet-based
techniques
Proactive,
one-to-one and
many-to-one
MultiHopLQI [6] Yes (implicitly) Yes Yes LQI
Proactive,
many-to-one
ZigBee (link
quality) [4]
Yes (implicitly) Yes
Ye s
(quantification)
Packet-based
techniques/average
LQI
Reactive,
one-to-one
Hop count while
avoiding weak
links [38]
Only when
considered paths
have the same
number of weak
links
Ye s N o LQ I
Reactive,
one-to-one
MAX-LQI
[21]/RQI [40]
No Yes No LQI
Reactive,
one-to-many
PATH-DR [21] Yes (implicitly) Yes Yes LQI
Reactive,
one-to-many
LETX Yes (implicitly) Yes Yes LQI
Reactive,
one-to-one
Figure 1: A picture of the testbed used in our experiments.
6. LQI Experimental Characterization
In this section we present an experimental study of the use of
the LQI as an estimator of the LDR, to identify the potential
advantageous and adverse characteristics of the LQI for its
use in routing metrics. We also present and justify our LQI-
based link quality estimation solution for NST-AODV.
6.1. Relationship between the LDR and the Average LQI. We
conducted a set of experiments as follows. One thousand
broadcast packets were sent from the mote at one corner of
the grid. The number of packets and the LQI of each received
packet were obtained at each of the remaining motes. The
LDR was calculated for all the receivers. The same procedure
was repeated three times, and the sender was placed at
each of the other three corners, producing similar results.
The transmission power was set at
−25 dBm. Packets were
transmitted at a rate of 3 Hz.
Figure 2 plots the LDR against the average LQI of each
receiver. The results are consistent with those found by other
researchers [20, 21]. Inspired by previous work [21], we
obtain a piecewise linear model of LDR as a function of
average LQI, which is also plotted in Figure 2. We will use this
model to implement the metrics considered for evaluation
in Section 7.However,asshowninFigure 2, the accuracy
of the average LQI as a good estimator of the LDR varies
depending on the quality of the link. Large and small average
LQI values can be used to estimate the LDR with only a small
degree of error. However, medium average LQI values are not
as reliable. For instance, a link with an average LQI of 78.1
showed an LDR of 61.5% whereas another link with an aver-
age LQI of 78.2 showed an LDR of 94.5%. Note that, in some
cases, the average LQI could overestimate the transmission
performance by not including the LQI of lost packets [19].
6.2. Variability of the LQI of a Link. Figure 3 depicts the
standard deviation of the LQI against the average values of
EURASIP Journal on Wireless Communications and Networking 7
0
10
20
30
40
50
60
70
80
90
100
LDR (%)
50 60 70 80 90 100 110
Average LQI
Experiment
Model
Figure 2: Plot of LDR against average LQI for each sender-receiver
pair. A piecewise linear approximation model is shown.
0
2
4
6
8
10
12
14
16
Standard deviation of LQI
50 60 70 80 90 100 110
Average LQI
Figure 3: Standard deviation of the LQI against the average LQI
values.
the LQI measured in each link. The LQI is almost constant for
high average LQI values. For instance, the standard deviation
is below 2 for average LQI values beyond 105 (which lead
to LDR values between 99.9% and 100%). As the average
LQI decreases, the standard deviation of LQI increases, to
reach a peak value of 13.8 for an average LQI of 79.1.
From this point, as the average LQI decreases further, the
standard deviation of LQI exhibits a decreasing tendency,
with greater scattering of the values than that shown on the
right edge of the plot. The main conclusion from Figure 3
is that LQI is fairly constant with time for very high or
very low link qualities, while it varies for medium link
qualities.
Figure 4 further illustrates the LQI variation with time in
four example links that show different LDR values. While the
LQI is almost constant for a link with LDR
= 100%, it exhibits
large variations in a link with LDR
= 77.4%. The range of
LQI values obtained decreases as the link quality decreases,
as shown in links with LDR
= 48.0% and LDR = 13.7%.
Our results differ from those of a study which focused
on the temporal characteristics of the LQI [19]. Authors of
the cited work concluded that the LQI was stable with time
and exhibited a maximum standard deviation of 1.2. The
explanation is that their experiments were carried out in very
good channel conditions, since an LQI between 103.1 and
107.0 was reported.
6.3. Considerations for Routing. Ideally, a link quality esti-
mator for a routing protocol should be accurate, agile, and
stable, and should add minimum overhead to the routing
protocol. Below, we discuss the trade-offs in the fulfillment
of the previous requirements when an LQI-based estimator
is used.
The main drawback of an LQI-based link quality esti-
mator is the fact that it may provide spurious link quality
indications in a medium quality link. If such a link appears
to temporarily exhibit better quality than the steady state one,
any path containing this link may experience early problems
(e.g., end-to-end connectivity gaps). In the opposite case,
the link quality estimation mechanism might induce the
path selection algorithm to select other worse performing
links. Averaging techniques could reduce the impact of LQI
variations, but some of these are slow to adapt to changes
[20, 31]. Furthermore, as already shown in Subsection 6.1,
even the average of a large number of LQI samples does not
assure accurate prediction of the LDR in medium-quality
links. Hence, averaging LQI may result unnecessary in this
zone of link qualities.
On the other hand, LQI-aware routing favors the use of
the available links with the highest quality, that is, those links
with most temporarily stable quality characteristics. High-
quality links exhibit high and relatively constant LQI values,
suggesting that such links can be detected using a window of
a single LQI sample. We investigated this possibility as fol-
lows. For each LQI sample from our experiments, we studied
the probability of it corresponding to a link with a measured
LDR greater than or equal to a given value. The results are
plotted in Figure 5, which shows that a single LQI sample
with a high value is a reliable estimator of a good quality link.
Finally, note that LQI-aware routing favors the use of
high quality links, and hence tends to avoid the use of
medium quality links (whose quality might in some cases
be inaccurately estimated based on LQI). As will be shown
in Section 7, adequate LQI-based routing metrics provide
better performance than the Hop count routing metric.
6.4. Use of LQI for NST-AODV. In view of the previous
observations, we designed a simple LQI-based route selection
mechanism for NST-AODV as follows. During route discov-
ery, each node that receives an RREQ message converts the
LQI of that message into the estimated LDR, by applying
the piecewise linear model shown in Figure 2. The estimated
LDR of each link is then used to calculate the cost of the link,
according to the routing metric used. The accumulated cost
of the path is written in the RREQ before being rebroadcast
and the destination sends a RREP through the route with the
best cost. Once a path is found, the qualities of the links of the
network are not sampled again until the selected path breaks,
which leads to a new route discovery process. Note that this
approach neither adds a control message overhead nor adds
state at the nodes, in comparison with the use of the default
NST-AODV (which uses theHop count metric).
8 EURASIP Journal on Wireless Communications and Networking
50
60
70
80
90
100
110
LQI
Packet
Link of LDR
= 100%
(a)
50
60
70
80
90
100
110
LQI
Packet
Link of LDR
= 77.4%
(b)
50
60
70
80
90
100
110
LQI
Packet
Link of LDR
= 48%
(c)
50
60
70
80
90
100
110
LQI
Packet
Link of LDR
= 13.7%
(d)
Figure 4: LQI values for links with different LDR: (a) Link of LDR = 100%, (b) link of LDR = 77.4%, (c) link of LDR = 48%, and (d) link of
LDR
= 13.7%.
0
0.1
0.2
0.3
0.4
0.5
0.6
0.7
0.8
0.9
1
Probability
90 95 100 105 110
LQI
LDR
= 100%
LDR
≥ 99%
LDR
≥ 97%
LDR
≥ 94%
LDR
≥ 85%
LDR
≥ 84%
Figure 5: For each LQI value, the probability of corresponding to a
link with an LDR greater than or equal to a given bound.
7. Experimental Comparison of
Routing Metrics
This section presents the main part of the extensive set of
experiments that we conducted to evaluate the performance
of NST-AODV with the Hop count, PATH-DR, ZigBee, and
LETX routing metrics. Since these metrics have different
objectives, we expected to obtain the spectrum of perfor-
mance results that the use (or not) of LQI in the routing
metric may yield. As an additional contribution of the paper,
the code in nesC of NST-AODV with the four routing metrics
can be found in our website [43].
7.1. Definition of Experiments. The experiments were per-
formed on the testbed presented in Section 5,withlow
presence of people in the laboratory. We forced multihop
communications by setting the transmission power so that
the maximum transmission range was 2 m (recall that the
TelosB antenna is not omnidirectional). We investigated
the influence of each routing metric on the following
performance parameters: path hop count, path lifetime,
PDR, and cost of data packet delivery.
In each experiment, 1000 packets were transmitted peri-
odically at a rate of 3 Hz from a sender to a receiver, without
any other concurrent flows. Thus, the obtained results were
isolated from network congestion effects (the reader may
note that Section 8 is a study on the influence of background
traffic on the routing metrics). All the experiments were
carried out for the four routing metrics considered.
In order to better understand the performance of each
routing metric depending on the distance and relative
position between sender and receiver, two different scenarios
were defined, as shown in Figure 6. In the first one, the sender
is a mote placed at one corner of the grid and the different
receivers are the 28 motes in the two rows and columns that
EURASIP Journal on Wireless Communications and Networking 9
R
R
R
R
R
R
R
R
R
R
R
R
R
R
R
R
R
R
R
R
R
R
R
R
R
R
R
R
S
Long-path scenario
R
S
Not a receiver
Receiver
Sender
(a)
R
R
R
R
R
R
R
R
R
R
R
R
R
R
R
R
R
R
R
R
R
R
R
R
R
Short-path scenario
Not a receiver
Receiver
Sender
R
S
(b)
Figure 6: Long-path (a) and short-path (b) scenarios.
0
1
2
3
4
5
6
7
8
Path hop count
Hop count PATH-DR ZigBee LETX
Routing metric
Long paths
Short paths
All paths
Figure 7: Average values and standard deviation intervals for the
path hop count with each routing metric.
are furthest from the sender. In the second one, the receivers
are the 24 motes closest to the sender. Hereafter, the first and
second scenarios will be referred to as long-path and short-
path scenarios,respectively.
7.2. Path Hop Count. We first study the hop count of
the paths found in the experiments. Figure 7 depicts the
average and standard deviation of the path hop count for
each routing metric in the long- and short-path scenarios.
Figure 8 illustrates the PDF of the path hop count for each
routing metric. As expected, the Hop count metric selects
the paths with minimum length in hops. However, the LETX
metric, which takes into account link qualities, performs very
closely to the Hop count metric in terms of path length.
This is because the additive nature of the metric makes it
similar to a Hop count metric for paths with good quality
links. In contrast, the PATH-DR metric aims to select the
paths with the highest PDR (see Section 7.4) and these paths
are on average one hop longer, as shown in Figure 7. In the
short-path scenario, the ZigBee metric exhibits a path hop
count performance similar to that of LETX and the Hop
count metric, because it is also an additive metric. However,
in the long-path scenario, the ZigBee metric yields a greater
path hop count than LETX. Although the ZigBee metric loses
accuracy due to the quantification that it applies to calculate
the link cost (e.g., a link of LDR
= 85% has the same cost
as a link of LDR
= 100%), it tends to avoid bad links (see
the exponent equal to 4 in (2)) and search for longer routes
composed of good links.
7.3. Path Lifetime. The next performance parameter we
study is path lifetime. We define path lifetime as the
length of each period during which an end-to-end path
does not suffer link failures. This performance parameter is
relevant, since a link or path failure triggers routing protocol
messages in many routing techniques and may lead to route
changes. Furthermore, a stable topology should make higher-
level operations, such as scheduling, aggregation [5], and
transport layer protocols easier to design and implement.
Recall that NST-AODV decides that a link has failed after
three consecutive unsuccessful frame transmission attempts.
Note that, although the motes in our testbed are static,
link failures occur due to link quality changes because mote
receivers are close to the signal-to-noise threshold [5, 21].
Figure 9 illustrates the average and standard deviation of
path lifetime for each routing metric, measured as the total
time between the instant in which a path delivers its first
packet and the instant at which the last packet delivered by
the same path reaches the destination. Figure 10 shows the
CDF of path lifetime in the short-path and long-path sce-
narios, respectively. As shown in Figures 9 and 10, the paths
selected by the Hop count metric suffer link failures earlier
than the paths selected by LQI-based metrics. This occurs
because the Hop count metric is insensitive to the quality
10 EURASIP Journal on Wireless Communications and Networking
0
0.05
0.1
0.15
0.2
0.25
0.3
0.35
0.4
Probability distribution
function
1 2 3 4 5 6 7 8 9 1011121314
Number of hops
Hop count
(a)
0
0.05
0.1
0.15
0.2
0.25
0.3
0.35
0.4
Probability distribution
function
1 2 3 4 5 6 7 8 9 1011121314
Number of hops
PATH-DR
(b)
0
0.05
0.1
0.15
0.2
0.25
0.3
0.35
0.4
Probability distribution
function
1 2 3 4 5 6 7 8 9 1011121314
Number of hops
ZigBee
(c)
0
0.05
0.1
0.15
0.2
0.25
0.3
0.35
0.4
Probability distribution
function
1 2 3 4 5 6 7 8 9 1011121314
Number of hops
LETX
(d)
Figure 8: PDF of the path hop count for the routing metrics considered. The PDF is plotted on the basis of an analysis of all paths.
0
20
40
60
80
100
120
140
160
180
Path lifetime (s)
Hop count PATH-DR ZigBee LETX
Routing metric
Long paths
Short paths
All paths
Figure 9: Average values and standard deviation intervals of path
lifetime for the different routing metrics.
of the links in the network. In contrast, PATH-DR gives the
largest path lifetimes. As this metric aims at maximizing
PDR, it selects routes composed of good links. As shown
in the previous subsection, this results in choosing many
safe links (i.e., links whereby the receiving end operates well
beyond the signal-to-noise ratio threshold) for communica-
tion between two nodes, rather than using a few fragile links.
LETX and ZigBee are sensitive to link quality and therefore
offer larger path lifetimes than the Hop count metric. How-
ever, they do not perform as well as the PATH-DR metric,
due to their additive nature, which enforces a tendency to
select short paths in number of hops and to use nodes which
operate close to the signal-to-noise ratio threshold.
7.4. Path Delivery Ratio. The performance of a routing
metric in terms of PDR in NST-AODV can be explained by
the performance of the metric in path lifetime. The reason
for this is that, after a path failure, a connectivity gap takes
place, during which the protocol tries to find a new route for
the data. The connectivity gap ends when the first data packet
reaches the receiver after the path failure by using a new path.
Remarkably, the connectivity gap duration is inde-
pendent of the routing metric (we measured an average
connectivity gap duration of 1.7 s, which depends on the
protocol settings and the data sending rate). The reason for
this is that, after route discovery, the first route obtained
by the sender (via the first RREP it receives) is used for
data transmission. If better routes are found later (i.e.,
subsequent RREPs from the same route discovery reach the
sender via better paths), these routes are used for the next
data packets. Nevertheless, the first data packet transmission
after route discovery is always carried out through the first
available path, which does not depend on the routing metric
used.
EURASIP Journal on Wireless Communications and Networking 11
0
0.1
0.2
0.3
0.4
0.5
0.6
0.7
0.8
0.9
1
Cumulative distribution
function
0 40 80 120 160 200 240 280 320
Path lifetime (s)
Short paths
PATH-DR
ZigBee
LETX
Hop count
(a)
0
0.1
0.2
0.3
0.4
0.5
0.6
0.7
0.8
0.9
1
Cumulative distribution
function
0 40 80 120 160 200 240 280 320
Path lifetime (s)
Long paths
PATH-DR
ZigBee
LETX
Hop count
(b)
Figure 10: CDF of path lifetimes for the different routing metrics: short-path scenario (a) and long-path scenario (b).
70
75
80
85
90
95
100
PDR (%)
Hop count PATH-DR ZigBee LETX
Routing metric
Long paths
Short paths
All paths
Figure 11: Impact of the routing metric on PDR.
Figure 11 illustrates the average PDR measured in the
experiments with each routing metric. Figure 12 plots the
CDF of the PDR of all the flows. The PATH-DR metric yields
the highest PDR. This result is consistent with that expected
theoretically, since the metric is specifically designed for this
purpose. The overall PDR of PATH-DR is from 5.5% to
10.0% higher than that obtained with the rest of the metrics.
LETX and ZigBee metrics yield greater PDR than the Hop
count metric and provide similar performance, which can be
explained by the similar behavior of these metrics in terms of
path lifetime (see Section 7.3). The Hop count metric suffers
frequent path failures and yields the lowest PDR among the
considered metrics.
In the short-path scenario, the differences between the
metrics in terms of PDR are small. The lowest PDR, which
is given by the Hop count metric, is equal to 94.6% whereas
PATH-DR provides the highest PDR, which is equal to 97.5.
In the long-path scenario, PATH-DR also obtains the best
performance, with a PDR of 95.1%, whereas the Hop count
metric provides only a PDR of 81.3%. As shown in Figure 12,
in this scenario the differences between the performance of
the metrics under consideration become clearer than in the
short-path one.
7.5. Topological and Spatial Study. We next study the influ-
ence of the location of the sender and receiver on the
measured PDR and path hop count for each routing metric.
7.5.1. PDR. Figures 13 and 14 depictthePDRmeasuredat
the receiver of each flow for the four routing metrics. As the
physical distance between sender and receiver increases, the
PDR tends to decrease, as expected. However, this tendency
is not monotonical.
In fact, the quality of a route not only depends on the
physical distance between sender and receiver, but also on
how various factors affect the radio signal at the receiver
of each link composing the route. One of these factors
is multipath propagation (which is found in indoor and
some outdoor scenarios), whereby the transmitted signal and
its reflection on surfaces (e.g., walls, tables, ceiling, floor,
etc.) reach the receiver by different physical paths. These
signal components have different amplitudes and phases,
and hence multipath propagation can lead to constructive or
destructive interference. In the 2.4 GHz band, which is the
one used in the experiments, the quality of the signal received
by a node may vary significantly as the node’s position
changes by a few centimeters, because the signal wavelength
is 12.5 cm [44]. Other factors that affect the quality of a given
link include obstacle attenuation; the fact that the TelosB
antenna is not omnidirectional [33], and even differences
in radio hardware manufacturing. In consequence, the PDR
that can be obtained for some receivers may be greater than
the PDR obtained for other receivers which are physically
closer to the sender.
Furthermore, LETX and ZigBee metrics contribute to
the phenomenon mentioned above, as these metrics are not
12 EURASIP Journal on Wireless Communications and Networking
0
0.1
0.2
0.3
0.4
0.5
0.6
0.7
0.8
0.9
1
Cumulative distribution
function
0 1224364860728496
PDR (%)
Short paths
PATH-DR
ZigBee
LETX
Hop count
(a)
0
0.1
0.2
0.3
0.4
0.5
0.6
0.7
0.8
0.9
1
Cumulative distribution
function
0 1224364860728496
PDR (%)
Long paths
PATH-DR
ZigBee
LETX
Hop count
(b)
Figure 12: CDF of flows for different routing metrics with default routing protocol settings: short-path scenario (a) and long-path scenario
(b).
S
Hop count
(a)
S
ZigBee
(b)
S
PATH-DR
PDR (%)
95–100
90–95
85–90
80–85
75–80
65–75
55–65
40–55
Not a
receiver
SenderS
(c)
S
LETX
PDR (%)
95–100
90–95
85–90
80–85
75–80
65–75
55–65
40–55
Not a
receiver
SenderS
(d)
Figure 13: PDR for the Hop count, PATH-DR, ZigBee, and LETX metrics: long-path scenario.
intended to maximize PDR, and hence may select routes that
offer a PDR below the maximum achievable for some nodes.
Figure 15 illustrates an example of this behavior. The routes
selected by LETX and ZigBee metrics from node A to nodes
F and D are AEF and ABCD, respectively, which offer PDR
values of 84% and 100%, respectively (i.e., PDR grows even if
the distance to the destination grows, and nodes F and D are
neighbors). Note that LETX and ZigBee discard the ABCDF
path, which gives a PDR of 100%. This behavior may con-
tribute to the fact that in Figure 14 (ZigBee and LETX), there
EURASIP Journal on Wireless Communications and Networking 13
S
Hop count
(a)
S
ZigBee
(b)
S
PATH-DR
PDR (%)
99–100
97–99
94–97
90–94
85–90
79–85
72–79
65–72
Not a
receiver
SenderS
(c)
S
LETX
PDR (%)
99–100
97–99
94–97
90–94
85–90
79–85
72–79
65–72
Not a
receiver
SenderS
(d)
Figure 14: PDR for the Hop count, PATH-DR, ZigBee, and LETX metrics: short-path scenario.
1
A
1
E
B
1
C
F
0.84
1
1
D
(a)
AEFD
ABCD
AEF
ABCDF
3
3
2
4
Hop count
0.84
1
0.84
1
PATH-DR
4
3
3
4
ZigBee
3.19
3
2.19
4
LETX
(b)
Figure 15: Example of route selection based on LETX and ZigBee metrics, whereby PDR grows as the distance between sender and receiver
grows. The number placed next to a link indicates the LDR of that link. The shaded boxes indicate the cost of the path selected by each
routing metric between node A and nodes D and F.
are nodes that obtain a PDR greater than 99%, and which are
surrounded by nodes that obtain lower PDR values.
7.5.2. Path Hop Count. As shown in Figures 16 and 17,
the average hop count of the flows does not monotoni-
cally increase as the distance between sender and receiver
increases, due to the radio signal propagation issues men-
tioned in Section 7.5.1. Figure 18 plotsthePDRofeachflow
against its average number of hops for the four routing
metrics.
7.6. Cost of Data Packet Delivery. Finally, we study the
influence of each routing metric on the cost of data packet
delivery, defined as the average number of packet transmis-
sions in the network per delivered data packet. Note that
packet transmissions in the network include the transmission
of AODV messages as well as data packet transmissions and
retransmissions. We also test a Best-Effort (BE) approach for
NST-AODV, in which only the initial route discovery takes
place for a flow, and no data retransmissions are performed.
Thus, we can evaluate how the routing metric affects the
cost with the default and BE settings. The latter allows us to
obtain a lower bound on the cost with NST-AODV, which
can only be measured when the mechanisms of the protocol
for connectivity maintenance and reliability are disabled.
Of course, the cost benefits of this protocol variant are
14 EURASIP Journal on Wireless Communications and Networking
S
Hop count
(a)
S
ZigBee
(b)
S
PATH-DR
Average hop count
6-7
5-6
4-5
3-4
2-3
1-2
Not a
receiver
SenderS
(c)
S
LETX
Average hop count
6-7
5-6
4-5
3-4
2-3
1-2
Not a
receiver
SenderS
(d)
Figure 16: Average number of hops for the Hop count, PATH-DR, ZigBee, and LETX metrics: long-path scenario.
traded for PDR performance. With this version of the routing
protocol, we measured an average PDR of between 51.9%
(with the Hop count metric) and 62.9% (with the PATH-DR
metric).
Figure 19 illustrates the cost using NST-AODV in its
default and BE forms. In default NST-AODV, a link failure
triggers a new route discovery. In consequence, the number
of messages related with route discovery dominates the
total number of transmissions in our experiments. PATH-
DR yields the lowest cost because it leads to the min-
imum number of route discoveries per delivered packet
among the considered routing metrics (note that PATH-
DR provides the highest PDR). As shown in Figure 19,
the number of data packet retransmissions is significantly
smaller than the number of control messages (i.e., NST-
AODV messages). In BE NST-AODV, the cost is dominated
by the hop count of the paths. For this reason, the Hop
count metric obtains the lowest cost with this protocol
variant.
8. Performance of Routing Metrics in
the Presence of Background Traffic
This section presents an experimental evaluation of the
routing metrics under consideration in the presence of
background (BG) traffic. First, we present a study on the
sensitivity of the LQI to BG traffic.Then,weevaluatethe
impact of BG traffic on the performance of default NST-
AODV with the routing metrics considered in Section 7.The
radio chip settings for the experiments were those used in the
previous section. In order to make sure that data transmis-
sions were affected by BG traffic, the BG transmitters were set
to broadcast packets continuously, that is, these transmission
attempts could only be delayed by medium access con-
tention. Note that these are severe background trafficcon-
ditions, which are unlikely to be found in real deployments,
but which allow us to derive conclusions in a worst case
scenario.
8.1. Sensitivity of the LQI to Background Traffic. We investi-
gated the impact of BG traffic on the LQI of two different
links, denoted Link 1 and Link 2, which offered good and
moderate quality, respectively, in the absence of BG traffic.
The sender and receiver of these links, as well as the BG
traffic transmitters, are shown in Figure 20. Two scenarios
were tested for each link. In scenario A (see Figures 20(a) and
20(b)), five different BG traffic configurations were tested for
each link: (i) no BG traffic; (ii) all nodes labeled B1 trans-
mitting simultaneously; (iii) all nodes labeled B2 transmit-
ting simultaneously; (iv) all nodes labeled B3 transmitting
EURASIP Journal on Wireless Communications and Networking 15
S
Hop count
(a)
S
ZigBee
(b)
S
PATH-DR
Average hop count
>4.5
4-4.5
3.5-4
3-3.5
2.5-3
2-2.5
1.5-2
1-1.5
Not a
receiver
SenderS
(c)
S
LETX
Average hop count
>4.5
4-4.5
3.5-4
3-3.5
2.5-3
2-2.5
1.5-2
1-1.5
Not a
receiver
SenderS
(d)
Figure 17: Average number of hops for the Hop count, PATH-DR, ZigBee, and LETX metrics: short-path scenario.
simultaneously; (v) all nodes B1, B2, and B3, transmitting
simultaneously. In scenario B (see Figures 20(c) and 20(d)),
four different configurations were considered: (i) no BG
traffic; (ii) all nodes labeled B4 transmitting simultaneously;
(iii) all nodes labeled B5 transmitting simultaneously; (iv) all
nodes B4 and B5 transmitting simultaneously. Figures 21 and
22 depict the LQI and LDR results from five thousand data
packet transmissions for each considered link in scenarios A
and B, respectively.
As shown in Figures 21 and 22 (for Link 1), the LQI is
sensitive to background traffic, but the decrease of average
LQI, and the increase of LQI standard deviation with
background traffic are low. However, LQI-based routing
metrics may yield good performance, as the sensitivity
of the LQI to background traffic accumulates over all the
hops of a path (see Section 8.2). Note that, in Scenario
B, Link 2 is severely affected by BG traffic and no packet
is correctly delivered (and hence, no LQI values are
obtained).
Finally, it is worth mentioning that when a contention-
based MAC scheme is used (e.g., as in the beaconless mode,
and in the Contention Access Period of the beacon enabled
mode of IEEE 802.15.4), two phenomena may contribute to
data packet loss in scenarios like the considered ones, due to
background transmissions.
(i) If the RSSI measured by the sender during Clear
Channel Assessment (CCA) is greater than the energy
detection threshold, after the random backoff, the
sender will wait for another random period before
trying to access the channel again [1]. This procedure
will be repeated up to a maximum number of times
before a channel access failure is declared.
(ii) Otherwise, a background transmission will appear as
interference at the receiver, which can corrupt the
received data signal.
Whereas both phenomena may contribute to data packet
loss, LQI is only sensitive to the second one. Nevertheless, the
TinyOS 2.1.1 IEEE 802.15.4 implementation for the CC2420
radio chip does not limit the number of backoff periods for
a sender in a transmission attempt. Due to this reason, the
packet losses occurred during our experiments were only due
to the second phenomenon indicated.
8.2. Impact of Background Traffic on the Performance of
Routing Metrics. Wecarriedoutasetofdatapackettrans-
missions by using NST-AODV with the Hop count, PATH-
DR, ZigBee, and LETX metrics in the presence of BG traffic.
Figure 23 illustrates the sender, the three different receivers,
and the BG transmitters used (which are denoted B1 or B2).
16 EURASIP Journal on Wireless Communications and Networking
0
10
20
30
40
50
60
70
80
90
100
PDR (%)
02468
Average number of hops
Hop count
(a)
0
10
20
30
40
50
60
70
80
90
100
PDR (%)
02468
Average number of hops
ZigBee
(b)
0
10
20
30
40
50
60
70
80
90
100
PDR (%)
02468
Average number of hops
PATH-DR
(c)
0
10
20
30
40
50
60
70
80
90
100
PDR (%)
02468
Average number of hops
LETX
(d)
Figure 18: PDR as a function of the average number of hops, as measured in the experiments.
0
2
4
6
8
10
12
14
Transmissions per delivered packet
Hop count PATH-DR ZigBee LETX
Routing metric
Default NST-AODV
Retx. packets
Control packets
Data packets
(a)
0
2
4
6
8
10
12
14
Transmissions per delivered packet
Hop count PATH-DR ZigBee LETX
Routing metric
BE NST-AODV
Control packets
Data packets
(b)
Figure 19: Average number of packet transmissions in the network per delivered packet for each routing metric, with default (a) and BE (b)
NST-AODV.
EURASIP Journal on Wireless Communications and Networking 17
B3
B2
B1
B3
B2
B1
S
R
B3
B2
B1
B3
B2
B1
B3
B2
B1
Link 1, scenario A
(a)
B1
B2
B3
B1
B2
B3
B2
B3
R
S
B1
B3
B2
B1
B3
B2
B1
Link 2, scenario A
(b)
B4
B5
B5
B5
B5
B4
B4
B4
B4
B4
B4
B4
B4
B5
S
R
B5
B4
B4
B5
B5
B5
B5
B4
B4
B4
B4
B4
B4
B4
Link 1, scenario B
Not a receiver
ReceiverR
Sender
S
B
∗
BG traffic
sender
(c)
B4
B5
B5
B5
B5
B4
B4
B4
B4
B4
B4
B4
B4
B5
R
S
B5
B4
B4
B5
B5
B5
B5
B4
B4
B4
B4
B4
B4
B4
Link 2, scenario B
Not a receiver
ReceiverR
SenderS
B
∗
BG traffic
sender
(d)
Figure 20: Testbed configurations for evaluating the sensitivity of LQI to background traffic.
70
75
80
85
90
95
100
105
110
Average LQI
No
traffic
B1 B2 B3
B1+B2
B3
Background trafficconfiguration
0
10
20
30
40
50
60
70
80
90
100
Link delivery ratio (%)
Average LQI-link 1
Average LQI-link 2
LDR-link 1
LDR-link 2
Figure 21: Influence of background trafficonLQIandLDRfortwo
different links in scenario A. For the LQI, the standard deviation
intervals are depicted.
Three different BG conditions were considered: (i) no BG
traffic, (ii) B1 nodes transmitting BG traffic, and (iii) B2
nodes transmitting BG traffic. We decided to configure the
nodes in the columns adjacent to those of the sender and
receivers as routers-only, for a better evaluation of the paths
selected in each case. For each routing metric, and for each
receiver, one thousand packets were sent at a rate of 3 Hz.
70
75
80
85
90
95
100
105
110
Average LQI
No
traffic
B4 B4+B5 B5
Background trafficconfiguration
0
10
20
30
40
50
60
70
80
90
100
Link delivery ratio (%)
Average LQI-link 1
Average LQI-link 2
LDR-link 1
LDR-link 2
Figure 22: Influence of background trafficonLQIandLDRfortwo
different links in scenario B. For the LQI, the standard deviation
intervals are depicted.
Figures 24–26 show the PDR, the average path hop count
and the cost of data packet delivery for each routing metric
as a function of the background traffic conditions.
As shown in Figure 24, all LQI-based routing metrics
outperform the Hop count metric in terms of PDR under
all BG traffic conditions. The PDR decreases and the path
hop count increases as the BG traffic transmitters are closer
18 EURASIP Journal on Wireless Communications and Networking
B1
B1
B1
B1
B1
B1
B1
B1
B1
B1
B2
B2
B2
B2
B2
B2
B2
B2
B2
B2
S
R
R
R
Not a receiver
ReceiverR
SenderS
B
∗
BG trafficsender
Figure 23: Background trafficscenario.
65
70
75
80
85
90
95
100
PDR (%)
Hop count PATH-DR ZigBee LETX
Routing metric
No BG traffic
B1
B2
Figure 24: Impact of the routing metric on PDR, under various
background traffic conditions.
0
0.5
1
1.5
2
2.5
3
3.5
4
4.5
5
Hop count
Hop count PATH-DR ZigBee LETX
Routing metric
No BG traffic
B1
B2
Figure 25: Impact of the Hop count metric on PDR, under various
background traffic conditions.
0
5
10
15
20
Transmissions per delivered packet
Hop count PATH-DR ZigBee LETX
Routing metric
No BG traffic
B1
B2
Figure 26: Average number of packet transmissions in the network
per delivered packet for each routing metric, under different
background conditions.
to the sender/receiver pair and as the interference level at
the receiving end of each link becomes greater. PATH-DR
yields the largest paths because it aims at maximizing the
PDR, as we also observed in Section 7. The Hop count metric
minimizes the path length. However, this metric selects paths
that may not include good quality links and may be affected
by BG traffic. LETX and ZigBee do not yield the same PDR
as PATH-DR, but select shorter paths than those chosen by
PATH-DR (see Figure 25).
As shown in Figure 26, in the absence of BG traffic,
the PATH-DR metric gives the highest delivery cost. This
happens because route failures do not happen often, and
hence the number of control packet messages transmitted is
low, which benefits the Hop count metric. However, under
BG traffic conditions, LQI-based metrics, and in particular
PATH-DR, outperform the Hop count metric. In fact, in
these conditions, control packets due to route failure and
discovery dominate the delivery cost, which benefits the
metrics that provide good PDR.
9. Conclusions and Future Work
This paper presents an in-depth, experimental evaluation
of LQI-based routing metrics for NST-AODV, which is a
one-to-one routing protocol for IEEE 802.15.4 multihop
networks.
From a characterization of the LQI, we conclude that a
single LQI sample per link is sufficient for route discovery,
since high-quality links provide stable LQI values and
averaging the LQI for medium quality links does not assure
reliable link estimation. The LQI values of route discovery
messages are used to estimate link qualities, which are in turn
the input for various routing metrics. The metrics considered
are the Hop count (which does not take into account link
quality), PATH-DR, ZigBee (link quality), and LETX metrics.
The measurements were carried out in a 60-node test-bed
EURASIP Journal on Wireless Communications and Networking 19
over 52 different sender/receiver pairs. The influence of
background traffic on the routing metrics was also tested.
Results show that PATH-DR obtains the highest PDR
and maximizes path lifetime. The good performance of
PATH-DR is due to the fact that it tends to select long
paths composed of many robust links. LETX and ZigBee
metrics are also sensitive to link quality and give a better
performance than the Hop count metric, which selects the
shortest paths regardless of their quality and suffers frequent
path failures. However, both LETX and ZigBee are additive
metrics, and therefore tend to select short paths, which may
be composed of links that are not as robust as those used by
PATH-DR.
With regard to minimizing the number of network
transmissions per delivered packet, the best metric depends
on the routing protocol settings. If a path failure triggers a
route discovery procedure, then PATH-DR compensates its
large paths with good stability. Otherwise, under a low rate
of routing protocol messages, PATH-DR trades path stability
for energy consumption.
The sensitivity of LQI to background trafficislowbut
sufficient, since the LQI-based routing metrics considered
also perform well in the presence of background trans-
mitters.
Although this study has been carried out using NST-
AODV as the routing protocol, we believe that it will
contribute to understanding the influence of LQI-based
routing metrics for other routing paradigms for IEEE
802.15.4 multihop networks.
In future studies, we plan to evaluate the performance of
LQI-based routing metrics in a network of battery-powered
motes. According to preliminary results, the LQI values mea-
sured at a receiver decrease with the remaining energy level
of the sender. In consequence, LQI-based routing metrics are
also power-aware and can improve network lifetime.
Acknowledgments
This work is supported in part by the Spanish Government
through project TEC2009-11453 and by the i2cat Founda-
tion through the TRILOGY project. The authors would like
to thank Sara Berzosa, Ra
´
ul Gim
´
enez, Tom
´
as Garc
´
ıa, and
Omar Garc
´
ıa for their contributions, and the anonymous
reviewers for their valuable comments, which helped to
improve the quality of the paper.
References
[1] IEEE 802.15.4-2003, “Wireless Medium Access Control
(MAC) and Physical Layer(PHY) Specifications for Low-
Rate Wireless Personal Area Networks (LR-WPANs),” IEEE
Computer Society, October 2003.
[2] IEEE 802.15.4-2006, “Wireless Medium Access Control
(MAC) and Physical Layer(PHY) Specifications for Low-
Rate Wireless Personal Area Networks (LR-WPANs),” IEEE
Computer Society, September 2006.
[3]E.Kim,N.Chevrollier,D.Kaspar,andJ.P.Vasseur,
“Design and Application Spaces for 6LoWPANs,” draft-ietf-
6lowpan-usecases-05, IETF Internet Draft (Work in Progress),
November 2009.
[4] ZigBee specification, version r17, ZigBee Alliance, January
2008.
[5] A. Woo, T. Tong, and D. Culler, “Taming the underlying
challenges of reliable multihop routing in sensor networks,”
in Proceedings of the 1st ACM International Conference on
Embedded Networked Sensor Systems (SenSys ’03), Los Angeles,
Calif, USA, November 2003.
[6] MultiHopLQI source code, />tos/lib/MultiHopLQI.
[7] MultiHopLQI source code, />doc/txt/tep123.
[8] M. Dohler, T. Watteyne, T. Winter, and D. Barthel, “Urban
WSNs Routing Requirements in Low Power and Lossy
Networks,” RFC 5548, May 2009.
[9] J. Martocci, P. de Mil, W. Vermeylen, and N. Riou, Building
Automation Routing Requirements in Low Power and Lossy
Networks, Internet Draft (work in progress), January 2010.
[10] C. Perkins, E. M. Belding-Royer, and S. Das, “Ad hoc On
Demand Distance Vector Routing (AODV),” RFC 3561, July
2003.
[11] M. Goyal, “Mechanisms to Support Point-to-Point Routing
in Low Power and Lossy Networks,” Internet Draft (work in
progress), April 2010.
[12] Project Sun SPOT documentation, spotworld
.com/docs/.
[13] T. Stathopoulos, L. Girod, J. Heidemann, and D. Estrin, “Mote
herding for tiered wirelesssensor networks,” Tech. Rep. 58,
CENS, December 2005.
[14] H. J. Kim, E. Kim, W. J. Song, and W. J. Lee, “Architectural
design and optimization ofIPv6-based sensor protocols for
wireless personal area networks,” in Proceedings of the 23rd
International Conference on Circuits/Systems, Computers and
Communications (ITC-CSCC ’08), Yamaguchi Japan, July
2008.
[15] C. Chen and J. Ma, “Simulation study of AODV performance
over IEEE 802.15.4 MAC in WSN with mobile sinks,” in
Proceedings of the 21st International Conference on Advanced
Information Networking and Applications Workshops/Symposia
(AINAW ’07), vol. 1, pp. 159–164, Niagara Falls, Canada, May
2007.
[16] R. Draves, J. Padhye, and B. Zill, “Routing in multi-radio,
multi-hop wireless mesh networks,” in Proceedings of the 10th
Annual International Conference on Mobile Computing and
Networking (MobiCom ’04), pp. 114–128, Philadelphia, Pa,
USA, October 2004.
[17] S. J. de Couto, D. Aguayo, J. Bicket, and R. Morris, “A
high-throughput path metric formulti-hop wireless routing,”
in Proceedings of the 9th Annual International Conference on
Mobile Computing and Networking (MobiCom ’03),SanDiego,
Calif, USA, September 2003.
[18] J. Polastre, R. Szewczyk, and D. Culler, “Telos: enabling ultra-
low power wireless research,” in Proceedings of the 4th Interna-
tional Symposium on Information Processing in Sensor Networks
(IPSN ’05), pp. 364–369, Los Angeles, Calif, USA, April 2005.
[19] L. Tang, K C. Wang, Y. Huang, and F. Gu, “Channel
characterization and link quality assessment of IEEE 802.15.4-
compliant radio for factory environments,” IEEE Transactions
on Industrial Informatics, vol. 3, no. 2, pp. 99–110, 2007.
[20] K. Srinivasan and P. Levis, “RSSI is under appreciated,” in
Proceedings of the 3rd ACM Workshop on Embedded Networked
Sensors (EmNets ’06), Cambridge, Mass, USA, May 2006.
20 EURASIP Journal on Wireless Communications and Networking
[21] B. Chen, K K. Muniswamy-Reddy, and M. Welsh, “Ad-hoc
multicast routing on resource limited sensor nodes,” in
Proceedings of the 2nd International Workshop on Multi-Hop
Adhoc Networks: From Theory to Reality (REALMAN ’06),
Florence, Italy, May 2006.
[22] R. Fonseca, O. Gnawali, K. Jamieson, and P. Levis, “Four-bit
wireless link estimation,” in Proceedings of the 6th Workshop
onHotTopicsinNetworks(HotNets’06), Atlanta, Ga, USA,
November 2007.
[23] E. Kim, D. Kaspar, C. Gomez, and C. Bormann, “Problem
Statement and Requirements for 6LoWPAN routing,”
draft-ietf-6lowpan-routing-requirements-04, IETF Internet
Draft(work in progress), July 2009.
[24]A.Tavakoli,S.Dawson-Haggerty,J.Hui,andD.Culler,
“HYDRO: A Hybrid Routing Protocol for Lossy and Low
Power Networks,” Internet Draft (work in progress), March
2009.
[25] V. C. Gungor, C. Sastry, Z. Song, and R. Integlia, “Resource-
aware and link quality based routing metric for wireless sensor
and actor networks,” in Proceedings of the IEEE International
Conference on Communications (ICC ’07), pp. 3364–3369,
Glasgow, Scotland, June 2007.
[26] C. Gomez, P. Salvatella, O. Alonso, and J. Paradells,
“Adapting AODV for IEEE 802.15.4 mesh sensor networks:
theoretical discussion and performance evaluation in a
real environment,” in Proceedings of the 7th International
Symposium on a World of Wireless, Mobile and Multimedia
Networks (WoWMoM ’06), vol. 2006, pp. 159–167, Niagara
Falls, NY, USA, June 2006.
[27] TinyOS Community Forum, .
[28] TinyAODV implementation, TinyOS source code repo-
sitory, />contrib/hsn.
[29] Q. Cao, T. He, L. Fang, T. Abdelzaher, J. Stankovic, and S.
Son, “Efficiency centric communication model for wireless
sensor networks,” in Proceedings of the 25th Conference
on ComputerCommunications (INFOCOM ’06), pp. 1–12,
Barcelona, Spain, April 2006.
[30] OLSRD implementation, .
[31] A. Woo and D. Culler, “Evaluation of efficient link reliability
estimators for low-power wireless networks,” Tech. Rep.
UCB/CSD-03-1270, University of California, Berkeley, Calif,
USA, November 2003.
[32] “2.4 GHz IEEE 802.15.4 compliant and ZigBee ready RF
transceiver,” CC2420 Datasheet, March 2007.
[33] TelosB Datasheet, />Datasheet
.pdf.
[34] B. N. Chun et al., “Mirage: a microeconomic resource
allocation system for sensornet testbeds,” in Proceedings of the
2nd IEEE Workshop on Embedded Networked Sensors (EmNetS
’05), Sydney, Australia, May 2005.
[35] M. D. Yarvis, W. S. Conner, L. Krishnamurthy, A. Mainwaring,
J. Chhabra, and B. Elliott, “Real-world experiences with an
interactive ad hoc sensor network,” in Proceedings of the
International Conference on Parallel Processing Workshops,
Vancouver, Canada, August 2002.
[36] C. E. Perkins and P. Bhagwat, “Highly dynamic destination-
sequenced distance-vector routing (DSDV) for mobile
computers,” in Proceedings of the ACM Conference
onCommunications Architectures, Protocols and Applications
(SIGCOMM ’94), London, UK, September 1994.
[37] K. Ramachandran, M. Buddhikot, G. Chandranmenon, S.
Miller, E. Belding-Royer, and K. Almeroth, “On the design
and implementation of infrastructure mesh networks,” in
Proceedings of the IEEE Workshop on Wireless Mesh Networks
(WiMesh ’05), Santa Clara, Calif, USA, September 2005.
[38] K. Kim, S. Daniel Park, G. Montenegro, S. Yoo, and N. Kushal-
nagar, “6LoWPAN Ad HocOn-Demand Distance Vector
Routing (LOAD),” draft-daniel-6lowpan-load-adhocrouting-
03.txt, IETF Internet Draft (work in progress), June 2007.
[39] J. G. Jetcheva and D. B. Johnson, “Adaptive demand-driven
multicast routing in multi-hop wireless ad hoc networks,” in
Proceedings of the ACM International Symposium on Mobile
Ad Hoc Networking and Computing (MobiHoc ’01), pp. 33–44,
Long Beach, Calif, USA, October 2001.
[40] B. Chen, D. Pompili, and I. Marsic, “Continuous vital sign
monitoring via wireless sensor network,” in Proceedings
of Malignant Spaghetti—Wireless Technologies in Hospital
Healthcare, NewYork, NY, USA, November 2008.
[41] G. Werner-Allen, P. Swieskowski, and M. Welsh, “MoteLab:
a wireless sensor network testbed,” in Proceedings of 4th
International Symposium on Information Processing in Sensor
Networks (IPSN ’05), vol. 2005, pp. 483–488, April 2005,
Special Track on Platform Tools and Design Methods for
Network Embedded Sensors (SPOTS).
[42] “Avoiding RF interference between WiFi and ZigBee,”
http : / /www.mobiusconsulting.com/papers/ZigBeeandWiFi -
Interference.pdf.
[43] “URL of the implementation of NST-AODV with Hop
Count, PATH-DR, ZigBee (link quality) and LETX,” http://
www-entel.upc.edu/carles.gomez.
[44] S. Farahani, ZigBee Wireless Networks and Transceivers,
Elsevier, Amsterdam, The Netherlands, 2008.