Báo cáo hóa học: " Research Article A Simulation Study: The Impact of Random and Realistic Mobility Models on the Performance of Bypass-AODV in Ad Hoc Wireless Networks" pdf
Bạn đang xem bản rút gọn của tài liệu. Xem và tải ngay bản đầy đủ của tài liệu tại đây (908.36 KB, 10 trang )
Hindawi Publishing Corporation
EURASIP Journal on Wireless Communications and Networking
Volume 2010, Article ID 239370, 10 pages
doi:10.1155/2010/239370
Research Article
A Simulation Study: The Impact of Random and Realistic
Mobility Models on the Performance of Bypass-AODV in
Ad Hoc Wireless Networks
Ahed Alshanyour
1
and Uthman Baroudi
2
1
Electrical and Computer Engineering Department, Concordia University, Montreal, QC, Canada H3G 1MB
2
Computer Engineering Department, King Fahd Unive rsity of Petroleum and Minerals, Dhahran 31261, Saudi Arabia
Correspondence should be addressed to Uthman Baroudi,
Received 13 October 2009; Revised 2 April 2010; Accepted 6 August 2010
Academic Editor: Kameswara Rao Namuduri
Copyright © 2010 A. Alshanyour and U. Baroudi. This is an open access article distributed under the Creative Commons
Attribution License, which permits unrestricted use, distribution, and reproduction in any medium, provided the original work is
properly cited.
To bring VANET into reality, it is crucial to devise routing protocols that can exploit the inherited characteristics of VANET
environment to enhance the performance of the running applications. Previous studies have shown that a certain routing
protocol behaves differently under different presumed mobility patterns. Bypass-AODV is a new optimization of the AODV
routing protocol for mobile ad-hoc networks. It is proposed as a local recovery mechanism to enhance the performance of the
AODV routing protocol. It shows outstanding performance under the Random Waypoint mobility model compared with AODV.
However, Random Waypoint is a simple model that may be applicable to some scenarios but it is not sufficient to capture some
important mobility characteristics of scenarios where VANETs are deployed. In this paper, we will investigate the performance
of Bypass-AODV under a wide range of mobility models including other random mobility models, group mobility models,
and vehicular mobility models. Simulation results show an interesting feature that is the insensitivity of Bypass-AODV to the
selected random mobility model, and it has a clear performance improvement compared to AODV. For group mobility model,
both protocols show a comparable performance, but for vehicular mobility models, Bypass-AODV suffers from performance
degradation in high-speed conditions.
1. Introduction
Research has gained a significant advance in the develop-
ment of routing protocols for wireless ad hoc networks
[1, 2]. The movement pattern of mobile nodes plays an
important role in the performance analysis of mobile and
wireless networks. Additionally, mobility has a major effect
on the route stability and availability. For example, to
maintain communication, signaling traffic is needed for
route construction and subsequent route maintenance. The
extra signaling traffic over the air interface consumes radio
resources, and it increases the interferences that affect the
performance of other mobile nodes. Therefore, movement
modeling is an essential building block in analytical and
simulation-based studies of such systems. Moreover, some
researchers [3, 4] have observed that the performance of
routing algorithms may be influenced by the choice of
mobility models. For example, random models are not a
good choice to simulate the real-world mobility scenarios
because usually mobile users either move toward certain
attraction points such as classrooms or train stations, or
move in certain directions such as vehicles. Some attempts
have been made to implement specific mobility scenarios
that are more realistic [5–7]. However, implementing a
generic and a realistic mobility model is challenging because
the mobility requirement in MANET changes due to the
application environments. Indeed, devising a realistic mobil-
ity model that accurately reflects actual user mobility is a
key challenge in evaluating the performance of any routing
algorithm, and it has a significant effect on the obtained
results. If the model is unrealistic, invalid conclusions may
be drawn.
2 EURASIP Journal on Wireless Communications and Networking
The Ad hoc On-demand Distance Vector (AODV) [1]
is a distributed reactive routing protocol. It reacts relatively
fast to the topological changes, and it saves storage space as
well as energy. AODV performs better than other reactive
protocols [8] in more stressful situations, such as a large
number of nodes and highly mobile environments, but
it suffers from high routing overhead compared to the
Dynamic Source Routing (DSR) protocol. Bypass-AODV [9]
is one of the recently developed routing protocols. It is an
optimization of the AODV for mobile ad hoc networks,
which uses a specific strategy, cross-layer MAC-notification,
to identify mobility-related packet loss, and then it sets
up a bypass between the node at which the route failure
occurred and its old successor via an alternative node. By
restricting the bypass to a very small topological radius, route
adaptations occur only locally and communication costs are
small. This approach has two main properties: simplicity
and very promising performance compared to other existing
approaches.
The Random Waypoint (RWP) [3] mobility model was
used to evaluate the performance of Bypass-AODV, which
has shown a clear performance gain over the conventional
AODV [9], but RWP does not reflect the mobile nodes’
movement patterns in real-life applications. Therefore, to
analyze the performance of any new routing protocol
thoroughly and systemically, there is a need to use mobility
models that emulate the real-life applications. Otherwise,
the observations made and the conclusions drawn from the
simulation studies may be misleading. This study has the
following two main objectives.
(1) To study the impact of other well-known random
mobility models, Random Walk (RW) [5]and
Random Direction Mobility (RDM) [3], on the
performance of the Bypass-AODV routing protocol.
In these two models, users move individually in
random directions with random velocities.
(2) To evaluate the performance of the proposed pro-
tocol with real-life applications by using one of
the group mobility models, Reference Point Group
Mobility (RPGM) [10], and two vehicular mobility
models: Freeway (FRW) and Manhattan (MAN) [5].
For RPGM, users move in groups toward certain
attraction points, while for FRW and MAN they
move like groups in certain directions with controlled
velocities.
To evaluate mobility impacts, we opt to simulation method-
ology for the following reasons. First, carrying out real
experimental verification on the same scale as we carried out
our simulation in is very difficult. Second, the theoretical
analysis is not tractable for these networks with such
complex mobility settings. The simulation results show that
the Bypass-AODV routing protocol is insensitive to the
random mobility pattern used in simulation. Under group
mobility models, Bypass-AODV and AODV have similar
performance. Although Bypass-AODV is a suitable choice
for VANET applications at low to moderate speeds, it
shows performance degradation at high speeds due to the
unnecessary increase in the route length.
Our findings in this paper shall help the research
community in understanding better the behavior of the
studied protocols and their implications on new applications
such as VANET networks. Moreover, this paper provides
future directions for new studies in this interesting area.
The remainder of this paper is organized as follows. In
Section 2, we briefly present the AODV routing protocol, and
then we present our enhanced local recovery routing scheme,
Bypass-AODV, and we outline its advantages. Section 3
describes commonly used mobility models and their appli-
cations. Section 4 presents the network simulator (nss’) [11]
simulation environment used to evaluate the performance
of routing protocols under the selected mobility models.
Section 5 discusses the performance of Bypass-AODV and
original AODV. Finally, Section 6 summarizes the paper and
suggests future research directions.
2. AODV and Bypass-AODV
In this section, we shall summarize the basics of AODV and
Bypass-AODV routing protocols.
2.1. AODV Routing Protocol. AODV is a reactive routing
protocol used for dynamic wireless networks where nodes
might enter and leave the network frequently. It is an on-
demand routing algorithm that builds routes when desired
by source nodes. When a source node desires a route to a
destination for which it does not already have a route, it
broadcasts a route request message (RREQ) to its immediate
neighbors. If any of its neighbors has a valid route to the
destination, it replies with a route reply message (RREP).
Otherwise, nodes, neighbors rebroadcast the RREQ. This
process of broadcasting continues until the RREQ reaches
the requested destination or reaches a node with a fresh
enough route to that destination. As a result, several RREPs
may be sent back to the source node, which in turn chooses
the suitable route. To ensure loop-free and route-freshness
properties, a combination of sequence numbers and hop
counts is associated with the RREQ. Sequence numbers and
hop counts are used by intermediate nodes to decide either
to rebroadcast the RREQ or to discard it.
AODV has a local maintenance scheme to maintain the
routes as long as they are active. When a link break in an
active route occurs, the node upstream of that break tries
to repair the route if it is closer to the destination than the
source node. To repair the link break, the node broadcasts
an RREQ for that destination. Otherwise, the node makes a
list of unreachable destinations consisting of the unreachable
neighbor and any additional destinations in its local routing
table that use the unreachable neighbor as the next hop.
Then, the node broadcasts a route error message (RERR) to
notify its neighbors to invalidate the routes using the broken
link.
2.2. Bypass-AODV Routing Protocol. Bypass-AODV uses
cross-layer MAC notification to identify mobility-related
EURASIP Journal on Wireless Communications and Networking 3
Original route
Connectivity
S
I
J
K
M
L
D
Figure 1: Route maintenance using Bypass-AODV.
packet loss, and then it triggers the routing layer to start a
local repair process. It allows the upstream node of the bro-
ken link to set up a bypass to connect with the downstream
node via an alternative node. The MAC-notification message
is used to distinguish between mobility-related packet loss
and other source-related packet losses (signal interference,
packet error rate, fading environment, and packet collision).
Unlike AODV, the bypassing mechanism minimizes routing
overheads by limiting the area of route bypass search based
on spatial locality where a node cannot move too far too
soon. Thus, with high probability, the new distance between
the broken links end nodes will not exceed 2 hops. Moreover,
bypass-AODV minimizes packet losses because it has the
ability to repair the broken link regardless of its location.
However, packet losses occur when route bypassing does
not work, specifically when the distance between broken
links end nodes is > 2 hops. In such a case, Bypass-AODV
follows AODV link invalidation scheme. Several bypasses for
the same route may lead to an unnecessary increase in the
route hop count. To handle this issue, the bypassed-route
is a temporary route that lasts for a period long enough to
transmit packets that left the source node.
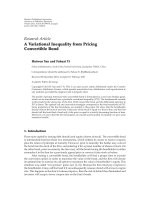
Figure 1 gives a brief illustration of route bypassing.
Initially, the flow from source S to destination D goes through
nodes I, J, K, and L.ThenodeK will detect a break in the
link that connects it with L. As a consequence, K will initiate
a limited route discovery cycle to search for a bypass to L.
Neighbors of K will receive the RREQ and rebroadcast it to
their neighbors. Assuming the new distance between K and
L is 2 hops; L will receive the RREQ and then unicasts an
RREP to K. Figure 1 shows a situation where the RREQ is
unicasted to K via node M. Our simulation results show that,
in most cases, no need to bypass the broken link because
the detected route failure is a factious one that results from
network congestion.
3. Mobility Models
Mobility models can be categorized into two categories:
entity and group mobility models. The entity mobility
models represent the behavior of an individual node or
group of nodes independently from other nodes. On the
other hand, the group mobility models take into account the
interaction among individual mobile nodes. Group mobility
P1
P6
P3
P2
P5
P4
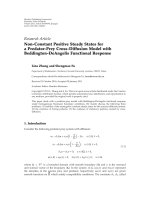
Figure 2: Example of node movement in the Random Waypoint
Model.
models are more suitable for some ad hoc network scenarios
such as groups of soldiers in military actions or a group of fire
fighters in action. In this section, in addition to RWP model,
we will discuss two other random mobility models: RW and
RDM. Next, we discuss the RPGM, FRW and MAN mobility
models.
3.1. Random Walk Mobility Model (RW). This model was
originally proposed to emulate the unpredictable movement
of particles in physics. In this model, a node moves from
its current position to a new position by selecting a random
direction and a random speed. The node randomly and uni-
formly selects its new direction θ(t)from(0,2π] and speed
v(t)from(0,V
max
]. During the time interval t, the node
moves with the velocity vector (v(t)cosθ(t), v(t)sinθ(t)). As
the node reaches the boundary of the simulation region,
it bounces back to the simulation region with an angle of
θ(t)orπ
− θ(t). The Random Walk model is memoryless it
generates an unrealistic movement pattern, and hence it does
not match real-life applications.
3.2. Random Waypoint Mobility Model (RWP). In RWP, each
node randomly selects a new target location and then moves
to that location with a constant speed chosen uniformly
and randomly from (0,V
max
], where V
max
represents the
maximum allowable speed for the mobile node. Once the
mobile node reaches that location, it becomes stationary for
a predefined pause time, T
pause
. After that it selects another
random location within the simulation region and moves
into it. The whole process is continuously repeated until the
end of the simulation time. Figure 2 shows an example for
the movement trace of a node. Two key parameters, V
max
and T
pause
, define the mobility behavior of the mobile nodes.
If V
max
is small and T
pause
is large, the network topology is
expected to be stable. On the other hand, large V
max
and
small T
pause
will produce a highly dynamic network topology
[12].
RWP is widely accepted, mainly due to its simplicity
of implementation and analysis. However, RWP fails to
4 EURASIP Journal on Wireless Communications and Networking
capture the characteristics of temporal dependency (i.e.,
the velocities at two different time slots are dependent)
spatial dependency (i.e., the movement pattern of mobile
nodes may be influenced by and correlated with nodes
in its neighborhood), and geographic constraints (nodes’
movements are restricted by obstacle, along streets and
freeways) [5].
3.3. Random Direction Mobility Model (RDM). The spatial
node distribution of RWP is transformed from uniform node
distribution to nonuniform distribution as the simulation
time elapses and finally it reaches a steady state. In steady
state, the mobile nodes are concentrated at the central
region and are almost zero around the boundaries [12, 13].
The RDM model [14]wasproposedtoovercomesuch
phenomenon. In RDM, the node randomly and uniformly
chooses a direction and moves along that direction until
it reaches a boundary. After reaching the boundary and
stopping for some T
pause
, it randomly and uniformly chooses
another direction to travel. Therefore, the resultant node
distribution from this model is more stable than that of RWP.
3.4. Reference Point Group Mobility Model (RPGM). The
RPGM model emulates group movement patterns. In
RPGM, mobile nodes inside the simulated region form cer-
tain groups. Each group has a group leader that determines
the group members’ motion behavior. It acts as a reference
point for that group. Group members’ mobile nodes ran-
domly move about their own predefined reference points
with a speed vector V
member
(t) and direction vector θ
member
(t)
that is derived by randomly deviating from that of the
group leader’s velocity and direction, (V
leader
(t), θ
leader
(t)),
respectively. A Speed Deviation Ratio (SDR) and an Angle
Deviation Ration (ADR) are used to control the deviation of
the velocity vector of group members from that of the leader.
−→
V
member
=
−→
V
leader
+rand
(
·
)
∗ SDR ∗ max
s
,
−→
Θ
member
=
−→
Θ
leader
+rand
(
·
)
∗ ADR ∗ max
a
,
(1)
where 0
≤ SDR, ADR ≥ 1. max
s
and max
a
are used to limit
the maximum speed and the maximum angle the group
member can take, respectively. Since the movements of
the group’s members are controlled by the group leader’s
movement, this mobility model is expected to have high
spatial dependency for small values of SDR and ADR. As
shown in Figure 3,attimet, the mobile nodes deviate
from their estimated reference points, RP(t), (the five black
dots). At time t + 1, five new reference points are estimated,
RP(t + 1). Also, mobile nodes deviated from their new
estimated reference points.
−→
V
i
(
t +1
)
=
−→
V
i
(
t
)
+rand
(
·
)
∗
−→
a
i
(
t
)
∀
i, j, t, D
i,j
(
t
)
≤ SD =⇒
−→
V
i
(
t
)
≤
−→
V
j
(
t
)
,
(2)
3.5. Freeway Mobility Model (FRW). The FRW is proposed to
emulate the motion behavior of mobile nodes on a freeway
RP(t)
MN1
MN2
MN3
MN4
Leader
RP(t +1)
MN1
MN2
MN4
MN3
Leader
Figure 3: Example: a group of five mobile nodes movements using
the RPGM model.
Figure 4: Example of node movement in the Freeway Model.
(exchange the traffic status or track a vehicle on a freeway). In
this model, each freeway has several lanes in both directions.
Thus, the mobile node movement is restricted to its lane
on the freeway (a strict geographic restriction on the node
movement) and its velocity at different instants of time is
temporally dependent. Moreover, mobile nodes’ movement
in the same lane is spatially dependent (the vehicle’s speed is
constrained by the speed of vehicles ahead of it. The vehicle
adjusts its speed and position to keep a Safe Distance (SD)
from the one ahead of it). Figure 4 illustrates the maps used
for simulating the FRW mobility model.
3.6. Manhattan Mobility Model (MAN). MAN is proposed
to emulate the movement of mobile nodes on streets defined
by maps. In this model, there are horizontal and vertical
streets, and each street has two lanes for each direction.
EURASIP Journal on Wireless Communications and Networking 5
Figure 5: Example of node movement in the Manhattan model.
A mobile node can probabilistically move straight, turn right,
or turn left at the intersections with probabilities of 0.5,
0.25, or 0.25, respectively. In this model, the mobile node
movement has the same restrictions as in FRW, and the same
velocity equations are applicable. MAN is expected to have
spatial dependency, strong temporal dependency, and strict
geographic restrictions on the node movements. Figure 5
illustrates the maps used for simulating the MAN mobility
model.
4. Simulation Environment
We implement a simulation model using the ns to evaluate
the performance of Bypass-AODV. Free Space propagation
model is used to predict the signal power strength at the
receiver side. The signal strength is used to determine if the
frame is received successfully. ns mainly uses three thresholds
to determine whether a frame is received correctly by the
receiver. If the signal strength of the frame is less than the
carrier sensing threshold (CSThresh), the frame is discarded
in the PHY module and will not be visible to the MAC layer.
If the signal strength of the received frame is stronger than
the reception threshold (RxThresh), the frame is received
correctly. Otherwise, the frame is tagged as corrupted and
the MAC layer will discard it. When multiframes are received
simultaneously by one mobile node, it calculates the ratio
of the strongest frame’s signal strength to the sum of other
frames’ signal strengths. If it is larger than the capturing
threshold (CPThresh), the frame will be received correctly
and other frames are ignored. Otherwise, all frames are
collided and discarded. In our simulation, we choose TCP
instead of UDP to evaluate the performance of our proposed
protocol against large data packets and excessive overhead.
The IEEE 802.11 MAC standard [15] and the TCP New-
Reno are used at the MAC and TCP layers, respectively. The
transmission rate is assumed to be constant at 1 Mbps.
In each simulation-iteration, we generate a scenario with
a source-destination pair that is randomly and uniformly
Table 1: Evaluation parameters.
Parameter Value
Transmission range (R
x
) 180 m
Interference range 400 m
Transmission bit rate 1 Mbps
CPThresh 10.0 dB
CSThresh
−72 dBm
RXThresh
−65 dBm
Transmission power 20 dBm
Simulation region 1000 m
× 1000 m
Number of nodes 60
Number of TCP
connections
1
Session interval 150 sec
Simulation time 160 sec
Maximum speed (V
max
)
1, 5, 10, 20, 30,
and 40 m/sec
Packet size 1060 byte
Pause time (T
pause
)0sec
SDR and ADR 0.1
chosen. The simulation results reported in the next section
represent the average results over 6000 different scenarios.
Each reading is averaged over 30 independent runs. The
velocity for each node is selected randomly and uniformly
from (0, V
max
]. Ta bl e 1 shows the values of all parameters
used in the simulation. The following metrics are computed
to evaluate the impact of each mobility model on the
performance of the Bypass-AODV as well as the original
AODV.
(1) The routing overhead ratio is the ratio of the amount
in bytes of control packets transmitted to the amount
in bytes of data packets received. This measure is
important to estimate the cost of introducing the new
protocol.
(2) The goodput of the TCP is the number of sequenced
bits that a TCP receiver receives per unit of time. This
measure will show the effectiveness of the routing
protocol from the application perspective.
(3) The “goodput improvement ratio” is the TCP good-
put observed with a Bypass-AODV strategy as com-
pared to the standard AODV routing strategy.
5. Simulation Results and Discussion
In this section, we examine the impact of different random
mobility models as well as group and vehicular mobility
models on the performance of Bypass-AODV and AODV
routing protocols.
5.1. Impact of Node Speeds on TCP Connection Length. Let
us first present the statistical results for the impact of node
6 EURASIP Journal on Wireless Communications and Networking
1 5 10 15 20 25 30 35 40
0
10
20
30
40
50
60
70
80
90
100
Speed (m/sec)
Percent of short length routes (%)
RPGM
FRW
MAN
Figure 6: The percent of received TCP packets with short hop
counts (hop count
≤ 3).
speeds on the connection hop counts for RPGM, FRW, and
MAN mobility models. These findings are important for
understanding the behavior of routing protocols and their
effect on TCP performance.
Figures 6 and 7 show the percentage of short and medium
routes at different speeds. For the considered environment,
it is rare to find a connection of length more than 6 hops.
Moreover, node speeds have a minimal effect on the length of
the TCP connection in terms of number of hops for RPGM
because of the strict movements of nodes. On the other hand,
for FRW and MAN, the higher the node speed, the higher the
tendency for short connection (
≤3). This behavior is natural
because as nodes move in opposite and perpendicular
directions, the TCP connections will suffer frequent breakage
especially the long ones. This phenomenon has a direct
effect on TCP performance, as will be discussed in the next
sections.
5.2. Impact of Random Mobility Models on Bypass-AODV.
The RWP, RW, and RDM models are used to evaluate the
performance of Bypass-AODV and AODV. Our objective
is to study the performance of Bypass-AODV on both
long and short TCP connections (in terms of hop counts)
To achieve this objective, we make the TCP connection’s
end nodes static, while other nodes are allowed to move
in accordance with the assumed mobility model with a
maximum speed of 20 m/s. Hence, the physical distance (the
physical distance between the source and the destination
of a TCP connection remains relatively unchanged during
a simulation run. It is worth to note that the minimum
distance between TCP connection end nodes in terms of
the number of hops, assuming nodes use their maximum
transmission range (180 m)) between the connection’s end
nodes remains relatively unchanged during a simulation run.
1
5 10152025303540
0
10
20
30
40
50
60
70
80
90
100
Speed (m/sec)
Percent of medium length routes (%)
Data1
Data2
Data3
Figure 7: The percent of received TCP packets with medium hop
counts (4
≤ hop count ≤ 6).
Actually, all the nodes in the ad hoc network share the
same transmission medium. If a node is transmitting, other
nodes within a certain range of the transmitting node cannot
transmit. Two ranges are defined by the IEEE 802.11 MAC
and are used in our simulation: the transmission range and
the sensing range. The transmission range is the maximum
distance between two nodes, such that a signal transmitted
by one node can be received by the other node and can
be decoded correctly. The sensing range is defined as the
maximum distance between two nodes, such that a signal
transmitted by one node can be received by the other node,
but cannot be decoded correctly. The sensing range is much
larger than the transmission range. In our simulation setting,
the transmission range is 180 m while the sensing range is
400 m. The IEEE 802.11 MAC protocol ensures that while
a node is transmitting, other nodes within its sensing range
cannot transmit.
From Figure 8, Bypass-AODV and AODV have similar
TCP goodput when the two end nodes are close to each other.
When the physical distance between the two end nodes is one
hop, the two end nodes are in direct communication and
there is no possibility of link failure due to node mobility.
Thus, Bypass-AODV has the same goodput regardless of
the random mobility model used in the simulation. As the
physical distance becomes 2 hops, the two end nodes are
communicating via an intermediate node. In such a scenario,
all communicating nodes are within the sensing range of
each other, and thus only one transmission is allowed at any
given time. Therefore, any link failure is mobility-related.
Furthermore, at this physical distance, the probability that
the two end nodes exist at the center of the simulation area is
high. Thus, Bypass-AODV shows better goodput with RWP
because the center region has higher node density than the
boundaries as shown in Figure 8. On the other hand, the
nodes moving according to RW and RDM are most likely
EURASIP Journal on Wireless Communications and Networking 7
123456
10
0
10
1
10
2
10
3
The physical distance between the connection end nodes (hops)
Goodput (kbps)
RWP
RW
RDM
Figure 8: TCP goodput for Bypass-AODV routing protocol.
uniformly distributed over the simulation area. However, the
average route lifetime is small compared to RWP, due to the
continuous node mobility which leads again to frequent link
breakage.
For a number of hops
≥4, the connection end nodes
start to reside at boundaries, and therefore Bypass-AODV
shows clear enhancement in performance with RW and
RDM models due to the uniform distribution of nodes
that creates homogeneous and highly connected networks.
However, the nonuniform distribution of mobile nodes may
partition the network frequently as in RWP. Finally, these
findings confirm previous results in the literature, namely,
a routing protocol may behave differently under different
mobility models especially for long connections [16].
Figure 9 compares the performance of Bypass-AODV
and AODV. It shows a clear improvement in the TCP
goodput ratio, especially for long TCP connections. When
the physical distance is
≥4 hops, there is a possibility
of simultaneous contention on the transmission medium
(collision). Collision causes unsuccessful packet transmis-
sion. The IEEE 802.11 MAC translates unsuccessful packet
transmission into link failure. Therefore, there is a need for
an efficient MAC mechanism that distinguishes mobility-
related failures from other source-related failures such as
contention. The existence of such mechanism will reduce
the frequency of route mechanism invocation, and it will
minimize the routing overheads and packet drops. This
justifies why the Bypass-AODV outperforms the AODV
especially for uniformly distributed nodes and long TCP
connections.
5.3. Impact of Group Mobility Models on Bypass-AODV. we
explore the dependency of routing protocols performance on
the movement pattern used in the simulated environment.
For the RPGM model, we use four groups of 15 nodes,
12 3456
0.5
1
1.5
2
2.5
3
3.5
4
4.5
5
The physical distance between the connection end nodes (hops)
Goodput improvement ratio
RWP
RW
RDM
Figure 9: Goodput improvement ratio (Bypass-AODV/AODV).
each one is moving independently of the others and in an
overlapping fashion.
Figure 11 shows that the Bypass-AODV routing protocol
has a slight enhancement in goodput at high speeds and
similar performance at low speeds. Figure 12 shows the
goodput improvement ratio. The similarity in performance
can be attributed to the fact that both routing protocols have
short connection most of the time. Ta bl e 2 shows that about
98% of the received TCP packets have a short hop count (
≤3)
under RPGM mobility model. Figure 10 from a previous
work [9] shows that Bypass-AODV and AODV have similar
performance for short-distance TCP connections. Bypass-
AODV effectively minimizes packet drops by buffering the
data packets for subsequent transmission after doing the
route bypassing. However, a bypassed route is temporary
and it lasts for a period of time, that is, long enough to
forward the buffered packets, and then a new route discovery
mechanism will start. Nevertheless, the routing overhead in
Bypass-AODV experiences little increase relative to AODV,
as shown in Figure 13. On the other hand, increasing the
speed will increase the possibility of overlapping between
groups, and it will shorten the physical distance between the
connection end nodes if they exist at different groups.
Furthermore, Figure 11 illustrates that the RPGM move-
ment pattern doubles the goodput of both routing protocols
relative to RWP. This considerable enhancement in goodput
is due to the spatial dependency nature of the RPGM model,
which increases the lifetime of the routes.
5.4. Impact of Vehicular Mobility Models on Bypass-AODV.
Vehicular mobility models, FRW and MAN, are adopted
to evaluate the performance of Bypass-AODV and then to
compare it with AODV. Initially, the nodes are placed on the
freeway lanes or local streets randomly in both directions.
Their movement is controlled as per the specification of
8 EURASIP Journal on Wireless Communications and Networking
123456
0.8
1
1.2
1.4
1.6
1.8
2
2.2
Physical distance between the connection end nodes (hops)
Goodput improvement ratio
Bypass-AODV/AODV: 1-tcp connection
Bypass-AODV/AODV: 3-tcp connection
Figure 10: Goodput improvement ratio (Bypass-AODV/AODV)
for different number of simultaneous TCP connections.
1 5 10 15 20 25 30 35 40
10
1
10
2
10
3
Speed (m/sec)
Goodput (kbps)
RPGM, AODV
RPGM, Bypass-AODV
RWP, AODV
RWP, Bypass-AODV
Figure 11: Goodput (Bypass-AODV and AODV).
Table 2: The connection hop count distribution (hc); node’s speed
is 20 m/sec.
Mobility model Short hc ≤ 3
Medium
4
≤ hc ≤ 6
Long hc > 6
RPGM 98% 2% 0%
FRW 84% 10% 6%
MAN 72% 22% 6%
the models. In each experiment setting, the direction of
movement of the communicating end nodes forms two
groups of scenarios. The first group has scenarios with the
same direction, but the second group has scenarios with
an opposite or perpendicular direction. In FRW, the first
1
5 10152025303540
0.8
0.9
1
1.1
1.2
1.3
1.4
1.5
1.6
Speed (m/sec)
Goodput improvement ratio
RPGM
RWP
Figure 12: Goodput improvement ratio (Bypass-AODV/AODV).
1 5 10 15 20 25 30 35 40
0
0.1
0.2
0.3
0.4
0.5
0.6
0.7
0.8
Speed (m/sec)
Routing overhead ratio
RPGM, AODV
RPGM, Bypass-AODV
RWP, AODV
RWP, Bypass-AODV
Figure 13: Routing overhead ratio.
group has about 50% of scenarios, and the second group
has the remainder. Due to the existence of horizontal and
vertical streets in the MAN model, the first group has about
25% of scenarios while the second group has about 75%.
The first group’s movement pattern is similar to that in
RPGM, which enhances the performance of the routing
protocol. On the other hand, moving in the opposite or
in the perpendicular direction lead to frequent and fast
route failures especially at high speeds. Therefore, bypassing
is not a suitable mechanism in such environment. Several
bypasses for the same route leads to unnecessary increase
in the route length, which in turn increases the packet
delivery delay and produces further failures. Thus, it is better
to start a new route-request-discovery process instead of
repairing the broken route. From Ta ble 2 , the percentage of
EURASIP Journal on Wireless Communications and Networking 9
1 5 10 15 20 25 30 35 40
40
50
60
70
80
90
100
200
300
400
Speed (m/sec)
Goodput (kbps)
RWP, AODV
RWP, Bypass-AODV
MAN, AODV
MAN, Bypass-AODV
Figure 14: Goodput, Bypass-AODV, and AODV routing protocols.
received packets with short hop count is found to be 84%
under FRW model, while only 72% under MAN model.
These percentages clarify why Bypass-AODV shows better
performance under FRW than MAN. Figure 14 shows that,
as the node’s speed increases, the TCP goodput performance
degrades. This result is expected due to the nodes’ high
speeds, which increases the number of link failures and their
corresponding constructed bypasses. Furthermore, AODV
and Bypass-AODV show lower TCP goodput for MAN
environment compared with FRW. Finally, Bypass-AODV
is behaving reasonably as AODV under FRW nobility
modelexceptatveryhighspeed(144km/h).However,for
MAN-similar environment, Bypass-AODV shows a quick
degradation as node’s speed exceeds 36 km/h.
6. Conclusions and Future Work
Accurate evaluation of mobility impact on the routing proto-
cols requires the testing of different mobility patterns. Other-
wise, the observations made and the conclusions drawn from
the simulation studies may be misleading. In this paper, we
investigated the behavior of an optimized Bypass-AODV for
a wide range of mobility models including VANET models.
Simulation results show that Bypass-AODV is insensitive
to random mobility models and has a clear performance
improvement compared to AODV. Moreover, Bypass-AODV
always outperforms AODV when nodes are uniformly
distributed for the long TCP connections. In addition,
Bypass-AODV has a comparable performance under group
mobility model compared to AODV. Currently, Bypass-
AODV is not suitable for handling VANET applications at
very high speeds. As a future work, Bypass-AODV needs
more improvement in order to handle VANET applications.
We believe that several parameters, such as vehicle speed and
direction, are necessary for appropriate route selection in
VANET applications. The route selection process should be
responsive and intelligent to avoid unnecessary long paths
and at the same time to make use of neighboring nodes to
receive the requested service. In fact, several studies have
shown that proactive routing protocols are unreliable for
VANET applications [17, 18].
Acknowledgment
This paper is supported by King Fahd University of Pet-
roleum and Minerals, Dhahran, Saudi Arabia under Fast
Track project FT 2005-16.
References
[1]C.E.PerkinsandE.M.Royer,“Theadhocon-demand
distance vector protocol,” in Ad Hoc Networking, pp. 173–219,
Addison-Wesley, Reading, Mass, USA, 2001.
[2]D.B.Johnson,D.A.Maltz,andJ.Broch,“DSR:the
dynamic source routing protocol for multi-hop wireless ad
hoc networks,” in Ad Hoc Networking, pp. 139–172, Addison-
Wesley, Reading, Mass, USA, 2001.
[3] T. Camp, J. Boleng, and V. Davies, “A survey of mobility mod-
els for ad hoc network research,” Wireless Communications and
Mobile Computing, vol. 2, no. 5, pp. 483–502, 2002.
[4] T. K. Madsen, F. H. P. Fitzek, and R. Prasad, “Impact of
different mobility models on connectivity probability of a
wireless ad hoc network,” in Proceedings of the International
Workshop on Wireless Ad-Hoc Networks, pp. 120–124, June
2004.
[5] F. Bai, N. Sadagopan, and A. Helmy, “Important: a frame-
work to systematically analyze the impact of mobility on
performance of routing protocols for adhoc networks,” in
Proceedings of the 22nd Annual Joint Conference on the IEEE
Computer and Communications Societies (INFOCOM ’03),pp.
825–835, April 2003.
[6] D. R. Choffnes and F. E. Bustamante, “An integrated mobility
and traffic model for vehicular wireless networks,” in Proceed-
ings of the 2nd ACM International Workshop on Vehicular Ad
Hoc Networks (VANET ’05), pp. 69–78, September 2005.
[7] R. Baumann, S. Heimlicher, and M. May, “Towards realistic
mobility models for vehicular ad-hoc networks,” in Proceed-
ings of the Mobile Networking for Vehicular Environments
(MOVE ’07), pp. 73–78, May 2007.
[8] V. D. Park and M. S. Corson, “A highly adaptive distributed
routing algorithm for mobile wireless networks,” in Pro-
ceedings of the 16th IEEE Annual Conference on Computer
Communications (INFOCOM ’97), pp. 1405–1413, April 1997.
[9] A. Alshanyour and U. Baroudi, “Bypass-AODV: improving
performance of ad hoc on-demand distance vector (AODV)
routing protocol in wireless ad hoc networks,” in Proceedings
of the International Conference on Ambient Media and Systems
(Ambi-sys 2’08), 2008.
[10] X. Hong, M. Gerla, G. Pei, and C C. Chiang, “A group
mobility model for ad hoc wireless networks,” in Proceedings
of the 2nd ACM International Workshop on Modeling, Analysis
and Simulation of Wireless and Mobile Systems (MSWiM ’99),
1999.
[11] K. Fall and K. Varadham, />documentation.html.
[12] C. Bettstetter and C. Wagner, “The spatial node distribution of
the random waypoint mobility model,” in Proceedings of the 1st
German Workshop on Mobile Ad Hoc Networks (WMAN ’02),
pp. 41–58, 2002.
10 EURASIP Journal on Wireless Communications and Networking
[13] D. M. Blough, G. Resta, and P. Santi, “A statistical analysis
of the long-run node spatial distribution in mobile ad hoc
networks,” in Proceedings of the ACM International Workshop
on Modeling, Analysis and Simulation of Wireless and Mobile
Systems (MSWiM ’02), pp. 30–37, September 2002.
[14] E. M. Royer, P. M. Melliar-Smith, and L. E. Moser, “An analysis
of the optimum node density for ad hoc mobile networks,” in
Proceedings of the International Conference on Communications
(ICC ’01), pp. 857–861, June 2000.
[15] Wireless LAN Medium Access Control (MAC) and Physical
Layer (PHY) Specifications, IEEE standard 802.11, 1997.
[16] G. Jayakumar and G. Ganapathi, “Reference point group
mobility and random way-point models in performance
evaluation of MANET routing protocols,” Journal of Computer
Systems, Networks, and Communications, vol. 2008, Article ID
860364, 10 pages, 2008.
[17] J. Nzouonta, N. Rajgure, G. Wang, and C. Borcea, “VANET
routing on city roads using real-time vehicular traffic infor-
mation,” IEEE Transactions on Vehicular Technology, vol. 58,
no. 7, pp. 3609–3626, 2009.
[18] K. Prasanth, K. Duraiswamy, K. Jayasudha, and C. Chan-
drasekar, “Improved packet forwarding approach in Vehicular
ad hoc networks using RDGR algorithm,” IJNGN, vol. 2, no.
1, 2010.