Vincom Landmark Tower_Final Report_Cladding Wind Load Study
Bạn đang xem bản rút gọn của tài liệu. Xem và tải ngay bản đầy đủ của tài liệu tại đây (3.65 MB, 38 trang )
Tel: 519.823.1311
Fax: 519.823.1316
Rowan Williams Davies & Irwin Inc.
650 Woodlawn Road West
Guelph, Ontario, Canada
N1K 1B8
Vincom Landmark Tower
Ho Chi Minh City, Vietnam
Final Report
Cladding Wind Load Study
RWDI # 1501902
March 14, 2016
SUBMITTED TO
SUBMITTED BY
Mr. Le Hai Quang
General Director
VINGROUP
Vincom Construction Management Company No.6
Level 2, T5, Times City, Hai Ba Trung District,
Honoi, Vietnam
Aleena Elizabeth Biju
Technical Coordinator
Anusree Sushama
Technical Coordinator
Kelvin Wong, Mphil, MHKIE, R.P.E.
Regional Manager / Consultant
Mark Chatten, MICE, C.Eng., P.E.
Principal / Senior Consultant
This document is intended for the sole use of the party to whom it is addressed and may contain information that is
privileged and/or confidential. If you have received this in error, please notify us immediately.
® RWDI name and logo are registered trademarks in Canada and the United States of America
Reputation Resources Results
Canada | USA | UK | India | China | Hong Kong | Singapore
www.rwdi.com
Vincom Landmark Tower - Ho Chi Minh City, Vietnam
Cladding Wind Load Study
RWDI#1501902
March 14, 2016
TABLE OF CONTENTS
1.
INTRODUCTION ................................................................................................................................... 1
2.
WIND TUNNEL TESTS ........................................................................................................................ 1
2.1 Study Model and Surroundings ..................................................................................................... 1
2.2 Upwind Profiles ............................................................................................................................. 2
3.
WIND CLIMATE .................................................................................................................................... 2
4.
DETERMINING CLADDING WIND LOADS FROM WIND TUNNEL TEST RESULTS ...................... 3
5.
RECOMMENDED CLADDING DESIGN WIND LOADS ...................................................................... 4
6.
APPLICABILITY OF RESULTS ........................................................................................................... 4
6.1 The Proximity Model ..................................................................................................................... 4
6.2 Study Model .................................................................................................................................. 4
Table
Table 1a:
Table 1b:
Drawing List for 1:400 Scale Model Construction
Drawing List for 1:100 Scale Model Construction
Figures
Figure 1a:
Figure 1b:
Figure 1c:
Figure 2:
Figure 3:
Wind Tunnel Study Model – Configuration 1
Wind Tunnel Study Model – Configuration 2
Wind Tunnel Study Model – 1:100 Scale Model
Site Plan
Directional Distribution of Local Wind Speeds
Recommended Wind Loads for Cladding Design, Peak Negative Pressures
Figure 4a & 4b : North Elevation
Figure 5a & 5b : West Elevation
Figure 6a & 6b : South Elevation
Figure 7a & 7b : East Elevation
Figure 8
: Roof Plan
Recommended Wind Loads for Cladding Design, Peak Positive Pressures
Figure 9a & 9b : North Elevation
Figure 10a & 10b: West Elevation
Figure 11a & 11b: South Elevation
Figure 12a & 12b: East Elevation
Figure 13
: Roof Plan
Appendix
Appendix A: Wind Tunnel Procedures
Reputation Resources Results
Canada | USA | UK | India | China | Hong Kong | Singapore
www.rwdi.com
Vincom Landmark Tower- Ho Chi Minh City, Vietnam
Cladding Wind Load Study
RWDI#1501902
March 14, 2016
Page 1
INTRODUCTION
1.
Rowan Williams Davies & Irwin Inc. (RWDI) was retained by VINGROUP to study the wind loading on the
proposed Vincom Landmark Tower in Ho Chi Minh City, Vietnam. The objective of this study was to
determine the wind loads for design of the exterior envelope of the building.
The following table summarizes relevant information about the design team, results of the study and the
governing parameters:
Project Details:
Architect
Structural Engineer
Key Results and Recommendations:
Recommended Cladding Design Wind Loads
Negative Pressures
Positive Pressures
Range of Negative Pressures
Range of Positive Pressures
Atkins
ARUP Vietnam Limited of Ho Chi Minh City, Vietnam
Figures 4a to 8
Figures 9a to 13
-1.75 kPa to -4.75 kPa
+1.25 kPa to +3.75 kPa
Selected Analysis Parameters:
Internal Pressures
Corner Units
Non-corner Units
Non-glazed Horizontal Roof Areas
Design Wind Pressure per Vietnamese Standard TCVN
2737:1995
Importance Factor on Wind Pressure
+0.3 kPa, -0.6 kPa
0.3 kPa
0.3 kPa
99.6 daN/m
2
1.0
The wind tunnel test procedures met or exceeded the requirements set out in Section 6.6 of the ASCE 705 Standard. The following sections outline the test methodology for the current study, and discuss the
results and recommendations. Appendix A provides additional background information on the testing and
analysis procedures for this type of study. For detailed explanations of the procedures and underlying
theory, refer to RWDI’s Technical Reference Document - Wind Tunnel Studies for Buildings (RD22000.1), which is available upon request.
2.
WIND TUNNEL TESTS
2.1
Study Model and Surroundings
A 1:400 scale model of the proposed development was constructed using the architectural drawings listed
in Table 1b. The model was instrumented with pressure taps and was tested in the presence of all
surroundings within a full-scale radius of 460 m, in RWDI’s 2.4 m 2.0 m boundary layer wind tunnel
facility in Guelph, Ontario for the following test configurations:
Configuration 1 – Proposed development with existing and in-construction surroundings.
Configuration 2 – Proposed development with existing, in-construction and future surroundings.
Reputation Resources Results
Canada | USA | UK | India | China | Hong Kong | Singapore
www.rwdi.com
Vincom Landmark Tower- Ho Chi Minh City, Vietnam
Cladding Wind Load Study
RWDI#1501902
March 14, 2016
Page 2
To obtain further refinement at the top of the tower, a 1:100 scale model was constructed of the crown
(L78 and above) using the architectural drawings listed in Table 1b. The large scale model was
instrumented and tested in the same facility.
The cladding wind loads presented in this report are a result of combining the data from the two 1:400
scale model test configurations and the 1:100 scale model into a consolidated set of cladding design wind
loads.
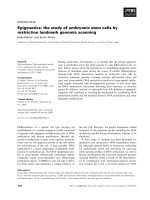
Photographs of the 1:400 scale model in the boundary layer wind tunnel are shown in Figures 1a and 1b,
corresponding to test configurations 1 and 2, respectively. Photographs of the 1:100 scale model in the
boundary layer wind tunnel are shown in Figure 1c. An orientation plan showing the location of the study
site is given in Figure 2.
2.2
Upwind Profiles
Beyond the modeled area, the influence of the upwind terrain on the planetary boundary layer was
simulated in the testing by appropriate roughness on the wind tunnel floor and flow conditioning spires at
the upwind end of the working section for each wind direction. This simulation, and subsequent analysis
of the data from the model, was targeted to represent suburban (i.e., terrain with many low to mid-rise
buildings) upwind terrain. Wind direction is defined as the direction from which the wind blows, measured
clockwise from true north.
3.
WIND CLIMATE
In order to predict the full-scale wind pressures acting on the building as a function of return period, the
wind tunnel data were combined with a statistical model of the local wind climate. The wind climate model
was based on local surface wind measurements taken at Tan Son Nhat International Airport and a
computer simulation of hurricanes. The hurricane simulation was provided by Applied Research
Associates, Raleigh, NC using the Monte Carlo Technique. Over 100,000 years of tropical storms were
simulated to account for the variability of hurricane wind speed with direction.
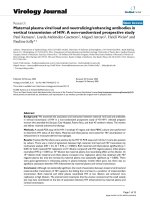
Figure 3 shows a comparison of strength and directionality of the typhoon, thunderstorm and extratropical (i.e., non- typhoon, non-thunderstorm) wind climates for Ho Chi Minh City. The typhoon data is
adapted from the typhoon computer simulation while the thunderstorm wind climate data were isolated
from the local surface wind measurements by filtering out “thunder days” from the local surface wind
measurements. An hourly record is considered part of a thunderstorm event if it falls within a thunder day
– thus, not all hourly thunderstorm records have an associated thunderstorm flag. Finally, the extratropical wind climates are any wind measurements that are not thunderstorm or typhoon records. These
plots are illustrative only and are not to be used directly for predictions of wind loads.
The upper two plots show the directionality of common winds on the left and extreme winds on the right.
Since hurricanes are extreme events, they are only included on the right plot. It can be seen that for the
extreme events, the winds from the west are the strongest, with a secondary lobe for winds from the
south-southeast. The lower plot shows the wind speeds from each data set as a function of return period.
Reputation Resources Results
Canada | USA | UK | India | China | Hong Kong | Singapore
www.rwdi.com
Vincom Landmark Tower- Ho Chi Minh City, Vietnam
Cladding Wind Load Study
RWDI#1501902
March 14, 2016
Page 3
It is clear from the plot that the common events (i.e., lower return periods) are dictated by the extratropical winds whereas at longer return periods, the hurricanes generate the most significant wind speeds
for strength design.
For the wind loading predictions for the strength design, the wind climate model was scaled to match the
design wind speed at the 50-year return period, using a 3-second gust wind speed of 40.3 m/s at a height
of 10 m in an open terrain, which is consistent with a 50-year return period reference wind pressure of
99.6 daN/m2. This pressure was derived based on the methodology provided in the Vietnamese Standard
TCVN 2737:1995; the nominal 95 daN/m² basic wind pressure (20-year return period) for the Ho Chi Minh
City (Region II.A), was first reduced by 12 daN/m² because Region II.A belongs to the "weak typhoon
region", and then multiplied by the wind load reliability coefficient of 1.2 to convert it to a 50-year return
period design wind pressure (99.6 daN/m2).
4. DETERMINING CLADDING WIND LOADS FROM WIND
TUNNEL TEST RESULTS
For design of cladding elements, the net wind load acting across an element must be considered. The
results provided in this report include the contributions of the wind loads acting on both the external
surface (measured directly on the scale model during the wind tunnel test) and internal surface of the
element (determined through analytical methods and the wind tunnel test data).
For elements exposed to wind on the external surface only, an internal pressure allowance must be
applied to the measured external pressure in order to determine the net pressure applicable for design.
In strong winds, the internal pressures are dominated by air leakage effects. Important sources of air
leakage include uniformly distributed small leakage paths over the building’s envelope and larger leakage
paths. These larger leakage paths include window breakage due to airborne debris in a windstorm and
open doors or windows, in cases where they are operable.
Taking into consideration the potential for breakage or an opening occurring and considering the internal
compartmentalization of the building, the resulting internal pressure allowance values used for corner
units were +0.3 kPa and -0.6 kPa, and ±0.3 kPa for the non-corner units including non-glazed horizontal
roof surfaces.
To obtain the net peak negative pressure on the building's cladding, the negative exterior pressures were
augmented by an amount equal to the positive internal pressure. Likewise, the net peak positive
pressures were obtained by augmenting the exterior positive pressure by an amount equal to the
magnitude of the negative internal pressure.
For elements exposed to wind on opposite surfaces such as parapets, fins and canopies, the net
pressure acting on the element was determined by measuring the instantaneous pressure difference
across the element.
Reputation Resources Results
Canada | USA | UK | India | China | Hong Kong | Singapore
www.rwdi.com
Vincom Landmark Tower- Ho Chi Minh City, Vietnam
Cladding Wind Load Study
RWDI#1501902
March 14, 2016
Page 4
5.
RECOMMENDED CLADDING DESIGN WIND LOADS
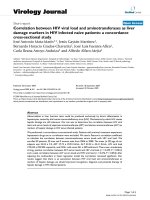
It is recommended that the wind loads presented in Figures 4a through 13 be considered for the 50-year
return period. The drawings in these figures have been zoned using 0.5 kPa increments so that the
pressure indicated is the maximum pressure in that particular zone. For example, a 2.25 kPa zone would
have pressures ranging from 1.76 kPa to 2.25 kPa.
Note that the recommended wind loads are for cladding design for resistance against wind pressure,
including an allowance for internal pressures. Design of the cladding to the provided wind loads will not
necessarily prevent breakage due to impact by wind borne debris.
"Negative pressure" or suction is defined to act outward normal to the building's exterior surface and
"positive pressure" acts inward. The largest recommended negative cladding wind load was -4.75 kPa,
which occurred on the North, West and East Elevations (Figures 4b, 5b and 7b, respectively). The
majority of the negative wind loads were in the range of -2.25 kPa to -2.75 kPa. The largest
recommended positive cladding wind load was +3.75 kPa, which occurred on the top of the spire on the
West and East Elevations (Figures 10b and 12b). The majority of the positive wind loads were in the
range of +1.75 kPa to +2.25 kPa.
6.
APPLICABILITY OF RESULTS
6.1
The Proximity Model
The cladding design wind loads determined by the wind tunnel tests and aforementioned analytical
procedures are applicable to the particular configurations of surroundings modeled. The surroundings
model used for the wind tunnel tests reflected the current state of development at the time of testing and
include, where appropriate, known off-site structures expected to be completed in the near future. If, at a
later date, additional buildings besides those considered in the tested configurations are constructed or
demolished near the project site, then some load changes could occur. To make some allowance for
possible future changes in surroundings, our final recommended cladding design wind loads do not go
below a minimum of ±1.75 kPa, with the exception of a +1.25 kPa minimum on the non-glazed horizontal
roof areas. Note that the cladding design wind loads provided in this report are given with the
understanding that all horizontal roof surfaces are non-glazed. If this is not the case then RWDI
should be contacted.
6.2
Study Model
The results presented in this report pertain to the scale model of the proposed development, constructed
using the architectural information listed in Tables 1a and 1b. Should there be any design changes that
deviate substantially from the above information, the results for the revised design may differ from those
presented in this report. Therefore, if the design changes, RWDI should be contacted and requested to
review the impact on the wind loads.
Reputation Resources Results
Canada | USA | UK | India | China | Hong Kong | Singapore
www.rwdi.com
Employee Job Title
TABLES
Page A1 of 1
TABLE 1A: DRAWING LIST FOR 1:400 SCALE MODEL
CONSTRUCTION
The drawings and information listed below were received from Atkins and were used to construct the
scale model of the proposed Vincom Landmark Tower, Vietnam. Should there be any design changes
that deviate from this list of drawings, the results may change. Therefore, if changes in the design area
made, it is recommended that RWDI be contacted and requested to review their potential effects on wind
conditions.
File Name
File Type
Date Received
(dd/mm/yyyy)
ATK-VINGROUP-COMBINED MODEL-20150515.3dm
Rhino file
16/05/2015
Reputation Resources Results
Canada | USA | UK | India | China | Hong Kong | Singapore
www.rwdi.com
Page A1 of 1
TABLE 1B: DRAWING LIST FOR 1:100 SCALE MODEL
CONSTRUCTION
The drawings and information listed below were received from Atkins and were used to construct the
scale model of the proposed Vincom Landmark Tower, Vietnam. Should there be any design changes
that deviate from this list of drawings, the results may change. Therefore, if changes in the design area
made, it is recommended that RWDI be contacted and requested to review their potential effects on wind
conditions.
File Name
File Type
Date Received
(dd/mm/yyyy)
VINC-ATK-Z0-XX-M3-A-0000.rvt
revit file
27/08/15
VINC-ATK-Z0-XX-M3-A-0001.rvt
revit file
27/08/15
VINC-ATK-Z0-XX-M3-A-0002.rvt
revit file
27/08/15
VINC-ATK-Z0-XX-M3-A-0003.rvt
revit file
27/08/15
VINC-ATK-Z0-XX-M3-A-0004.rvt
revit file
27/08/15
VINC-ATK-Z0-XX-M3-A-0005.rvt
revit file
27/08/15
VINC-ATK-Z0-XX-M3-A-0006.rvt
revit file
27/08/15
VINC-ATK-Z0-XX-M3-A-0007.rvt
revit file
27/08/15
ATKINS 3D MODEL View03.jpg
JPEG Bitmap
6/10/2015
151014 Feed back from Client/20151013_Comments.zip
zip file
14/10/15
Reputation Resources Results
Canada | USA | UK | India | China | Hong Kong | Singapore
www.rwdi.com
Employee Job Title
FIGURES
Wind Tunnel Study Model
Figure No. 1a
Configuration 1
Vincom Landmark Tower - Ho Chi Minh City, Vietnam
Project #1501902
Date: Nov. 26, 2015
Wind Tunnel Study Model
Figure No. 1b
Configuration 2
Vincom Landmark Tower - Ho Chi Minh City, Vietnam
Project #1501902
Date: Nov. 26, 2015
Wind Tunnel Study Model
Figure No. 1c
1:100 Scale Model
Vincom Landmark Tower - Ho Chi Minh City, Vietnam
Project #1501902
Date: March 11, 2016
340
350 45
330
N
10
310
25
300
70
10
80
290
260
250
70
10
280
E
W
100
260
110
240
120
230
80
100
250
110
240
120
130
220
140
210
170
140
210
150
S
E
0
230
130
220
190
60
5
0
200
50
15
5
W
40
20
15
280
30
25
20
290
20
30
300
60
10
35
310
50
30
N
40
320
40
35
350 45
330
30
40
320
340
20
150
200
160
190
S
170
160
Design Winds
Common Winds
60.0
50.0
Wind Speed
40.0
30.0
20.0
10.0
0.0
1
10
Extra-Tropical
100
Mean Recurrence Interval (years)
Typhoon
Extra-Tropical + Typhoon
1000
10000
TCVN 2737:1995 Design Wind Speed
Note: Wind Speeds shown are 3-second Gust Wind Speeds (m/s) at 10 m height in Open Terrain
Directional Distribution of Local Wind Speeds
Vincom Landmark Tower - Ho Chi Minh City, Vietnam
Figure No.
Project #1501902
3
Date: November 26, 2015
N
Note:
The wind loads presented do not contain load or safety factors. The loads are to
be applied to the building's cladding system in the same manner as would wind
loads calculated by building code analytical methods.
Key Plan
B18
3.75
L50
B16
B14
B12
A1
MATCHLINE A
3.75
3.75
L48
Key Plan of Wall Surface (A)
4.25
3.25
L49
2.75
3.25
3.25
L47
L46
3.25
L45
L44
L43
L42
L41
L40
2.75
2.75
L38
L37
L36
L35
L34
L33
3.25
L32
2.75
L29
L28
L27
L26
L25
SEE WEST ELEVATION
L30
SEE EAST ELEVATION
L31
3.25
L24
L23
L22
L21
2.25
L20
L19
L18
L17
L16
L15
2.25
L14
L13
L12
2.25
L11
L10
L9
B10
L8
L7
L6
B8
2.75
2.75
L5
1.75
L4
1.75
1.75
2.25
L3
1.75
L2
2.25
2.25
2.75
2.25
1.75
1.75
L1
SURFACE A1
Recommended Wind Loads for Cladding Design (kPa)
Peak Net Negative Pressures
(Negative External Pressure with Positive Internal Pressure Where Applicable)
50 - Year Reference Wind Pressure = 99.6 daN/m2, Importance factor = 1.0
Vincom Landmark Tower - Ho Chi Minh City, Vietnam
0
NORTH ELEVATION
Drawn by:
10
JMS Figure:
30m
4a
Approx. Scale:
1:750
Project #1501902 Date Revised:
Mar. 14, 2016
N
Note:
The wind loads presented do not contain load or safety factors. The loads are to
be applied to the building's cladding system in the same manner as would wind
loads calculated by building code analytical methods.
B18
B16
B14
B12
A2
Key Plan
SPIRE
Key Plan of Wall Surface (A)
3.25
3.25
2.75
ROOF LVL
SEE NORTH
ELEVATION - CROWN
L81
2.75
L80
L79
L78
2.75
3.25
3.25
2.25
2.75
2.75
3.75
L76
3.75
3.25
L77
SURFACE A2
3.75
3.75
3.25
4.75
3.25
L74
3.75
L75
2.75
3.25
3.25
L73
4.75
L72
3.25
4.25
L71
NORTH ELEVATION - CROWN
3.75
L70
3.75
L69
L68
3.25
L65
L64
3.25
L63
L62
SEE EAST ELEVATION
L61
L60
L59
L57
L56
3.25
2.75
3.25
L55
2.75
SEE WEST ELEVATION
L67
L54
L53
L52
L51
3.75
3.75
L50
MATCHLINE A
Recommended Wind Loads for Cladding Design (kPa)
Peak Net Negative Pressures
(Negative External Pressure with Positive Internal Pressure Where Applicable)
50 - Year Reference Wind Pressure = 99.6 daN/m2, Importance factor = 1.0
Vincom Landmark Tower - Ho Chi Minh City, Vietnam
NORTH ELEVATION
3.75
0
Drawn by:
10
JMS Figure:
30m
4b
Approx. Scale:
1:750
Project #1501902 Date Revised:
Mar. 14, 2016
Note:
The wind loads presented do not contain load or safety factors. The loads are to
be applied to the building's cladding system in the same manner as would wind
loads calculated by building code analytical methods.
W
Key Plan
A16
A14
A12
A10
MATCHLINE B
L50
L49
3.25
2.25
2.75
L48
L47
Isometric View of Building
2.75
L46
3.25
L45
L44
3.25
L43
L42
L41
L40
L38
L37
L36
L35
L34
2.75
L33
2.25
L32
2.75
L31
L30
L29
L28
L27
3.25
L26
L25
L24
3.25
L23
L22
L21
L20
L19
L18
L17
L16
L15
L14
2.75
L13
L12
2.25
2.25
L11
3.25
L10
L9
A18
L8
A8
L7
A6
2.75
L6
L5
2.75
2.25
L4
L3
1.75
SEE NORTH
ELEVATION
2.75
1.75
L2
2.75
2.75
1.75
2.25
2.25
2.25
L1
0
WEST ELEVATION
Recommended Wind Loads for Cladding Design (kPa)
Peak Net Negative Pressures
(Negative External Pressure with Positive Internal Pressure Where Applicable)
50 - Year Reference Wind Pressure = 99.6 daN/m2, Importance factor = 1.0
Vincom Landmark Tower - Ho Chi Minh City, Vietnam
Drawn by:
10
JMS Figure:
30m
5a
Approx. Scale:
1:750
Project #1501902 Date Revised:
Mar. 14, 2016
Note:
The wind loads presented do not contain load or safety factors. The loads are to
be applied to the building's cladding system in the same manner as would wind
loads calculated by building code analytical methods.
W
A16
A14
A12
A10
B1
SPIRE
SPIRE
Key Plan
3.75
Key Plan of Wall Surface (B)
ROOF LVL
ROOF LVL
L81
L81
L80
L80
L79
L79
L78
L78
L77
L77
L76
L76
3.25
3.25
SEE WEST
ELEVATION - CROWN
2.75
2.75
3.75
3.75
L75
4.75
3.75
L75
3.25
4.25
3.25
2.25
SURFACE B1
L74
L73
L73
L72
L72
L71
L71
L70
L70
L69
L69
L68
L68
L67
L67
3.75
4.75
3.25
4.25
L74
3.75
WEST ELEVATION - CROWN
3.75
2.75
L65
L65
L64
L64
L63
L63
L62
L62
L61
L61
L60
L60
L59
L59
L57
L57
L56
L56
L55
L55
L54
L54
L53
L53
L52
L52
L51
L51
L50
L50
3.25
2.75
3.25
2.25
MATCHLINE B
WEST ELEVATION
0
Recommended Wind Loads for Cladding Design (kPa)
Peak Net Negative Pressures
(Negative External Pressure with Positive Internal Pressure Where Applicable)
50 - Year Reference Wind Pressure = 99.6 daN/m2, Importance factor = 1.0
Vincom Landmark Tower - Ho Chi Minh City, Vietnam
Drawn by:
10
JMS Figure:
30m
5b
Approx. Scale:
1:750
Project #1501902 Date Revised:
Mar. 14, 2016
Note:
The wind loads presented do not contain load or safety factors. The loads are to
be applied to the building's cladding system in the same manner as would wind
loads calculated by building code analytical methods.
Key Plan
S
C1
B12
L50
B14
B16
B18
MATCHLINE C
L50
L49
3.25
Key Plan of Wall Surface (C)
L48
2.75
2.75
L47
2.75
2.75
L46
3.25
L45
L44
L43
L42
3.25
L41
L40
L38
L37
L36
2.25
L35
2.75
L34
L33
2.75
SEE WEST ELEVATION
L31
L30
L29
L28
L27
L26
L25
2.75
SEE EAST ELEVATION
L32
L24
L23
L22
3.25
L21
2.75
L20
L19
L18
2.25
L17
L16
2.75
L15
L14
L13
3.25
L12
2.25
L11
2.75
L10
L9
L8
B8
B10
L7
L6
L5
1.75
2.75
L4
1.75
2.75
L3
2.75
L2
2.25
2.25
1.75
1.75
2.25
2.25
SURFACE C1
L1
SOUTH ELEVATION
Recommended Wind Loads for Cladding Design (kPa)
Peak Net Negative Pressures
(Negative External Pressure with Positive Internal Pressure Where Applicable)
50 - Year Reference Wind Pressure = 99.6 daN/m2, Importance factor = 1.0
Vincom Landmark Tower - Ho Chi Minh City, Vietnam
SEE EAST
ELEVATION
0
Drawn by:
10
JMS Figure:
30m
6a
Approx. Scale:
1:750
Project #1501902 Date Revised:
Mar. 14, 2016
Note:
The wind loads presented do not contain load or safety factors. The loads are to
be applied to the building's cladding system in the same manner as would wind
loads calculated by building code analytical methods.
B12
B14
B16
B18
C2
SPIRE
Key Plan
S
Key Plan of Wall Surface (C)
3.25
ROOF LVL
L81
2.75
L80
SEE SOUTH
ELEVATION - CROWN
L79
2.25
3.25
2.75
L78
L77
2.25
SURFACE C2
3.25
3.75
L76
3.75
3.25
3.25
L74
4.25
2.25
3.25
L75
3.75
L73
L72
L71
3.75
L70
SOUTH ELEVATION - CROWN
L69
L68
L67
L64
L63
L62
L61
L60
L59
3.25
2.75
3.25
L57
2.75
L56
L55
SEE EAST ELEVATION
SEE WEST ELEVATION
L65
L54
L53
L52
L51
L50
MATCHLINE C
SOUTH ELEVATION
0
Recommended Wind Loads for Cladding Design (kPa)
Peak Net Negative Pressures
(Negative External Pressure with Positive Internal Pressure Where Applicable)
50 - Year Reference Wind Pressure = 99.6 daN/m2, Importance factor = 1.0
Vincom Landmark Tower - Ho Chi Minh City, Vietnam
Drawn by:
10
JMS Figure:
30m
6b
Approx. Scale:
1:750
Project #1501902 Date Revised:
Mar. 14, 2016
Note:
The wind loads presented do not contain load or safety factors. The loads are to
be applied to the building's cladding system in the same manner as would wind
loads calculated by building code analytical methods.
E
Key Plan
D1
A10
A12
A14
A16
MATCHLINE D
L50
L49
Key Plan of Wall Surface (D)
3.75
L48
2.75
L47
3.25
L46
3.25
L45
L44
3.25
L43
L42
L41
L40
L38
L37
L36
2.75
L35
L34
L33
L32
L31
L30
L29
2.75
L28
L27
2.25
L26
2.25
L25
L24
L23
L22
L21
L20
L19
L18
L17
L16
L15
L14
2.25
L13
L12
L11
2.75
L10
L9
L8
A6
A8
A18
L7
2.75
L6
1.75
L5
1.75
2.25
1.75
L4
2.25
SURFACE D1
2.75
L3
L2
2.25
1.75
2.25
L1
EAST ELEVATION
Recommended Wind Loads for Cladding Design (kPa)
Peak Net Negative Pressures
(Negative External Pressure with Positive Internal Pressure Where Applicable)
50 - Year Reference Wind Pressure = 99.6 daN/m2, Importance factor = 1.0
Vincom Landmark Tower - Ho Chi Minh City, Vietnam
Drawn by:
JMS Figure:
7a
Approx. Scale:
1:750
Project #1501902 Date Revised:
Mar. 14, 2016
Note:
The wind loads presented do not contain load or safety factors. The loads are to
be applied to the building's cladding system in the same manner as would wind
loads calculated by building code analytical methods.
A10
A12
A14
A16
D2
E
Key Plan
SPIRE
SPIRE
3.75
Isometric View of Building
2.75
ROOF LVL
ROOF LVL
L81
L81
L80
L80
L79
L79
L78
L78
L77
L77
L76
L76
SEE EAST
ELEVATION - CROWN
2.75
3.25
2.25
3.25
L75
L74
L73
L73
L72
L72
L71
L71
L70
L70
L69
L69
L68
L68
4.75
3.75
L74
SURFACE D2
4.25
3.75
4.25
3.75
L75
2.75
3.25
3.25
3.75
3.25
EAST ELEVATION - CROWN
L67
L67
L65
L65
L64
L64
L63
L63
L62
L62
L61
L61
L60
L60
L59
L59
2.75
L57
L57
L56
L56
L55
L55
L54
L54
L53
L53
L52
L52
L51
L51
L50
L50
2.75
3.75
MATCHLINE D
Recommended Wind Loads for Cladding Design (kPa)
Peak Net Negative Pressures
(Negative External Pressure with Positive Internal Pressure Where Applicable)
50 - Year Reference Wind Pressure = 99.6 daN/m2, Importance factor = 1.0
Vincom Landmark Tower - Ho Chi Minh City, Vietnam
3.25
3.75
0
EAST ELEVATION
Drawn by:
10
JMS Figure:
30m
7b
Approx. Scale:
1:750
Project #1501902 Date Revised:
Mar. 14, 2016
Note:
The wind loads presented do not contain load or safety factors. The loads are to be
applied to the building's cladding system in the same manner as would wind loads
calculated by building code analytical methods.
F5
F2
F3
F4
F1
E5 E2
Key Plan of Reflected Soffit Surfaces (F)
E6 E7
E8 E10
E14
E9 E13
E1
E3
E11
E4
E12
Key Plan of Roof Surfaces (E)
1.75
1.75
SURFACE E1
SURFACE E2
1.75
2.25
1.75
1.75
SURFACE E3
1.75
1.75
SURFACE F1
1.75
1.75
2.25
ROOF PLAN - CROWN
SURFACE F2
SURFACE E4
B8
B10
B12
B14
B16
B18
1.75
2.25
2.25
1.75
A18
SURFACE E5
SURFACE F3
1.75
A16
1.75
1.75
2.75
2.25
A14
1.75
1.75
1.75
SURFACE E6 SURFACE E7
1.75
2.75
2.75
1.75
1.75
SEE ROOF
PLAN - CROWN
SURFACE E8
A12
2.25
SURFACE F4
1.75
SURFACE F5
2.25
1.75
2.25
SURFACE E9
SURFACE E10
2.25
A10
2.75
3.25
1.75
1.75
A8
1.75
2.25
2.25
2.25
2.25
2.75
A6
SURFACE E11 SURFACE E12 SURFACE E13
2.25
SURFACE E14
ROOF PLAN
Recommended Wind Loads for Cladding Design (kPa)
Peak Net Negative Pressures
(Negative External Pressure with Positive Internal Pressure Where Applicable)
50 - Year Reference Wind Pressure = 99.6 daN/m2, Importance factor = 1.0
Vincom Landmark Tower - Ho Chi Minh City, Vietnam
0
True North Drawn by:
10
JMS Figure:
30m
8
Approx. Scale:
1:750
Project #1501902 Date Revised:
Mar. 14, 2016
N
Note:
The wind loads presented do not contain load or safety factors. The loads are to
be applied to the building's cladding system in the same manner as would wind
loads calculated by building code analytical methods.
Key Plan
B18
B16
B14
B12
A1
MATCHLINE A
L50
Key Plan of Wall Surface (A)
L49
L48
L47
2.75
L46
L45
L44
2.25
L43
L42
2.25
L41
L40
L38
L37
L36
2.25
L35
L34
L33
SEE EAST ELEVATION
L31
L30
L29
L28
L27
L26
L25
2.75
SEE WEST ELEVATION
2.75
L32
L24
L23
L22
L21
2.25
L20
2.25
L19
L18
L17
L16
L15
L14
L13
L12
L11
L10
L9
B10
1.75
L8
B8
L7
L6
L5
1.75
L3
2.25
2.25
L4
2.25
L2
1.75
L1
SURFACE A1
Recommended Wind Loads for Cladding Design (kPa)
Peak Net Positive Pressures
(Positive External Pressure with Negative Internal Pressure Where Applicable)
50 - Year Reference Wind Pressure = 99.6 daN/m2, Importance factor = 1.0
Vincom Landmark Tower - Ho Chi Minh City, Vietnam
0
NORTH ELEVATION
Drawn by:
10
JMS Figure:
30m
9a
Approx. Scale:
1:750
Project #1501902 Date Revised:
Mar. 14, 2016