Báo cáo hóa học: " Research Article A Fluid Model for Performance Analysis in Cellular Networks" doc
Bạn đang xem bản rút gọn của tài liệu. Xem và tải ngay bản đầy đủ của tài liệu tại đây (1.12 MB, 11 trang )
Hindawi Publishing Corporation
EURASIP Journal on Wireless Communications and Networking
Volume 2010, Article ID 435189, 11 pages
doi:10.1155/2010/435189
Research Article
A Fluid Model for Perfor mance Analysis in Cellular Networks
Jean-Marc Kelif,
1
Marceau Coupechoux,
2
and Philipp e Godlewski
2
1
France Telecom R&D, 38-40, rue du G
´
en
´
eral Leclerc, 92794 Issy-Les-Moulineaux, France
2
TELECOM ParisTech & CNRS LTCI UMR, 5141 Paris, France
Correspondence should be addressed to Jean-Marc Kelif,
Received 30 October 2009; Accepted 8 June 2010
Academic Editor: Jinhua Jiang
Copyright © 2010 Jean-Marc Kelif et al. This is an open access article distributed under the Creative Commons Attribution
License, which permits unrestricted use, distribution, and reproduction in any medium, provided the original work is properly
cited.
We propose a new framework to study the performance of cellular networks using a fluid model and we derive from this model
analytical formulas for interference, outage probability, and spatial outage probability. The key idea of the fluid model is to consider
the discrete base station (BS) entities as a continuum of transmitters that are spatially distributed in the network. This model allows
us to obtain simple analytical expressions to reveal main characteristics of the network. In this paper, we focus on the downlink
other-cell interference factor (OCIF), which is defined for a given user as the ratio of its outer cell received power to its inner cell
received power. A closed-form formula of the OCIF is provided in this paper. From this formula, we are able to obtain the global
outage probability as well as the spatial outage probability, which depends on the location of a mobile station (MS) initiating a new
call. Our analytical results are compared to Monte Carlo simulations performed in a traditional hexagonal network. Furthermore,
we demonstrate an application of the outage probability related to cell breathing and densification of cellular networks.
1. Introduction
Estimation of cellular networks capacity is one of the key
points before deployment and mainly depends on the char-
acterization of interference. As downlink is often the limited
link w.r.t. capacity, we focus on this direction throughout
this paper, although the proposed framework can easily be
extended to the uplink. An important system parameter
for this characterization is the other-cell interference factor
(OCIF). It represents the “weight” of the network on a given
cell.
OCIF is traditionally defined as the ratio of other-cell
interference to inner-cell interference. In this paper, we
rather consider an OCIF, which is defined as the ratio of
total other-cell received power to the total inner-cell received
power. Althoug h very close, this new definition is interesting
for three reasons. Firstly, total-received power is the metric
mobile stations (MS) are really able to measure on the field.
Secondly, the power r atio is now a characteristic of the net-
work and does not depend on the considered MS or service.
At last, the definition of OCIF is still valid if we consider
cellular systems without inner-cell interference; in this case,
the denominator of the ratio is reduced to the useful power.
The precise knowledge of the OCIF allows the derivation
of performance parameters, such as outage probabilities,
capacity, as well as the definition of Call Admission Control
mechanisms, in CDMA (Code Division Multiple Access) and
OFDMA (Orthogonal Frequency Division Multiple Access)
systems.
Pioneering works on the subject [1] mainly focused
on the uplink. Working on this link, [2] derived the
distribution function of a ratio of path-losses, which is
essential for evaluating the external interference. For this
purpose, authors approximated the hexagonal cell with a disk
of same area. Based on this result, Liu and Everitt proposed
in [3] an iterative algorithm for the computation of the OCIF
for the uplink.
On the downlink, [4, 5] aimed at computing an averaged
OCIF over the cell by numerical integration in hexagonal
networks. In [6], Gilhousen et al. provided Monte Carlo
simulations and obtained a histogram of the OCIF. In
[7], other-cell interference was given as a function of
the distance to the base station (BS) using Monte-Carlo
simulations. Chan and Hanly [8] precisely approximated the
2 EURASIP Journal on Wireless Communications and Networking
distribution of the other-cell interference. They, however,
provided formulas that are difficult to handle in practice.
Baccelli et al. [9] studied spatial blocking probabilities in
random networks. Focusing on random networks, power
ratios were nevertheless not their main concern and authors
relied on approximated formulas, which are not validated by
simulations.
In contrast to previous works in the field, the modeling
key of our approach is to consider the discrete BS entities of
a cellular network as a continuum. Recently, the authors of
[10] descr ibed a network in terms of macroscopic quantities
such as node density. The same idea was used in [11]
for ad hoc networks. They however assumed a very high
density of nodes in both papers and infinite networks. We
show hereafter that our model is accurate even when the
density of BS is very low and the network size is limited (see
Section 3.2).
Central idea of this paper has been originally proposed in
conference papers [12–15], which provide a simple closed-
form formula for the OCIF on the downlink as a function of
the distance to the BS, the path-loss exponent, the distance
between two BS, and the network size. We validate here the
formulas by Monte Carlo simulations and show that it is
possible to get a simple outage probability approximation
by integrating the OCIF over a circular cell. In addition, as
this ratio is obtained as a function of the distance to the
BS, it is p ossible to derive a spatial outage probability, which
depends on the location of a newly initiated call. Outage
probability formula allows us to analyze the phenomenon
of cell breathing, which results in coverage holes when the
traffic load increases. An answer to this issue is to increase
the BS density (i.e., network densification). Thanks to the
proposed formulas, we are able to quantify this increase.
We first introduce the interference model and the
notations (Section 2), then present the fluid model and its
validation (Section 3 ). In the fourth section, we derive outage
probabilities. In the last section, we apply the theoretical
results to the characterization of cell breathing and to
network densification.
2. Interference Model and Notations
We consider a cellular network and focus on the downlink.
BS have omnidirectional antennas, so that a BS covers a single
cell. Let us consider a mobile station u and its serving base
station b.
The propagation path gain g
j,u
designates the inverse of
the path-loss pl between base station j and mobile u; that is,
g
j,u
= 1/pl
j,u
.
The following power quantities are considered:
(i) P
b,u
is the transmitted power from serving base
station b to mobile u (for user’s traffic);
(ii) P
j
is the total transmitted power by a generic base
station j;
(iii) P
b
= P
cch
+ Σ
u
P
b,u
is the total power transmitted by
station b, P
cch
represents the amount of power used
to support broadcast and common control channels;
(iv) p
b,u
is the power received at mobile u from station b;
we can write p
b,u
= P
b
g
b,u
;
(v) S
u
= S
b,u
= P
b,u
g
b,u
is the useful power received at
mobile u from serving station b (for traffic data).
Since we do not consider soft-handover (SHO),
serving station is well defined and the subscript b can
be omitted for the sake of readability.
The total amount of power experienced by a mobile
station u in a cellular system consists of three terms: useful
signal power (S
u
), interference and noise power (N
th
). It is
common to split the system power into two terms: p
int,u
+
p
ext,u
,wherep
int,u
is the internal (or own-cell) received
power and p
ext,u
is the external (or other-cell) interference.
Note that we made the choice of including the useful signal
S
u
in p
int,u
, and, as a consequence, it should not be confused
with the commonly considered own-cell interference.
With the above notations, we define the OCIF in u, as the
ratio of total power received from other BS to the total power
received from the serving BS b as
f
u
=
p
ext,u
p
int,u
.
(1)
The quantities f
u
, p
ext,u
,andp
int,u
are location dependent and
can thus be defined in any location x as long as the serving
BS is known.
In this paper, we use the signal to interference plus noise
ratio (SINR) as the criteria of radio quality: γ
∗
u
is the SINR
target for the service requested by MS u. This figure is a priori
different from the SINR γ
u
evaluated at mobile station u.
However, we assume perfect power control, so that SINR
=
γ
∗
u
for all users.
2.1. CDMA Network. On the downlink of CDMA networks,
orthogonality between physical channels may be approached
by Hadamard multiplexing if the delay spread is much
smaller than the chip duration T
c
. As a consequence, a
coefficient α may be introduced to account for the lack of
perfect or thogonality in the own cell.
With the introduced notations, the SINR experimented
by u canthusbederived(see,e.g.,[16])
γ
∗
u
=
S
u
α
p
int,u
− S
u
+ p
ext,u
+ N
th
.
(2)
From this relation, we can express S
u
as
S
u
=
γ
∗
u
1+αγ
∗
u
p
int,u
α +
p
ext,u
p
int,u
+
N
th
p
int,u
. (3)
As we defined the OCIF as f
u
= p
ext,u
/p
int,u
,wehave
f
u
=
j
/
=b
P
j
g
j,u
P
b
g
b,u
.
(4)
In case of a homogeneous network, P
j
= P
b
for all j and
f
u
=
j
/
=b
g
j,u
g
b,u
.
(5)
EURASIP Journal on Wireless Communications and Networking 3
The tr ansmitted power for MS u, P
b,u
= S
u
/g
b,u
can now be
written as
P
b,u
=
γ
∗
u
1+αγ
∗
u
αP
b
+ f
u
P
b
+
N
th
g
b,u
. (6)
From this relation, the output power of BS b can be
computed as follows:
P
b
= P
cch
+
u
P
b,u
,
(7)
and so, according to (6),
P
b
=
P
cch
+
u
γ
∗
u
/
1+αγ
∗
u
N
th
/g
b,u
1 −
u
γ
∗
u
/
1+αγ
∗
u
α + f
u
.
(8)
In HSDPA (High Speed Downlink Packet Access), (2)
and (8) are valid for each TTI (Transmission Time Interval).
Parameter γ
∗
u
should be now interpreted as an experienced
SINR and not any more as a target. Sums are done on
the number of scheduled users per TTI. If a single user is
scheduled per TTI (which is a common case), sums reduce
to a single term. Even in this case, parameter α has to
be considered since common control channels and traffic
channels are not perfectly orthogonal due to multipath.
Even if previous equations use the formalism of CDMA
networks, it is worth noting that they are still valid for
other multiplexing schemes. For cellular technologies with-
out internal interference (TDMA, Time Division Multiple
Access, and OFDMA), p
int,u
reduces to S
u
and p
ext,u
is
the cochannel interference in (2). The definition of f
u
is
unchanged provided that sums in (4)and(5)aredoneover
the set of cochannel interfering BS (to account for frequency
reuses different from reuse one).
2.2. OFDMA Network. In OFDMA, (2) can be applied to
a single carrier. P
b
is now the base station output power
persubcarrier.InOFDMA,dataismultiplexedoveragreat
number of subcarriers. There is no internal interference, so
we can consider that α(p
int,u
− S
u
) = 0. Since p
ext,u
=
j
/
=b
P
j
g
j,u
,wecanwrite
γ
u
=
P
b,u
g
b,u
j
/
=b
P
j
g
j,u
+ N
th
,
(9)
so we have
γ
u
=
1
f
u
+ N
th
/P
b,u
g
b,u
.
(10)
Moreov er, when N
th
/P
b,u
g
b,u
f
u
, which is typically verified
for cell radii less than about 1 Km, we can neglect this term
and write
γ
u
=
1
f
u
.
(11)
For each subcarrier of an OFDMA system (e.g., WiMax,
LTE), the parameter f
u
represents the inverse of the SIR
(Signal-to-Interference Ratio).
Consequently, f
u
appears to be an impor tant parameter
characterizing cellular networks. This is the reason why we
focus on this factor in the next section and, with the purpose
of proposing a closed form formula of f
u
,wedevelopa
physical model of the network.
Continuum
of base stations
2R
c
R
c
R
nw
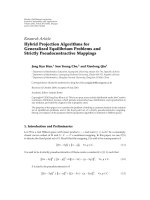
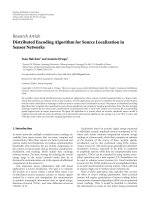
Figure 1: Network and cell of interest in the fluid model; the
minimum distance between the BS of interest and interferers is 2R
c
and the interfering network is made of a continuum of base stations.
3. Fluid Model
In this section, we first present the model, derive the closed-
form formula for f
u
, and validate it through Monte-Carlo
simulations for a homogeneous hexagonal network.
3.1. OCIF Formula. The key modelling step of the model we
propose consists in replacing a given fixed finite number of
interfering BS by an equivalent continuum of transmitters,
which are spatially distributed in the network. This means
that the transmitting interference power is now considered
as a continuum field all over the network. In this context,
the network is characterized by a MS densit y ρ
MS
and a
cochannel base station density ρ
BS
[12]. We assume that MS
and BS are uniformly distributed in the network, so that ρ
MS
and ρ
BS
are constant. As the network is homogeneous, all
base stations have the same output power P
b
.
We focus on a given cell and consider a round shaped
network around this central cell with radius R
nw
.InFigure 1,
the central disk represents the cell of interest, that is, the area
covered by its BS. The continuum of interfering BS is located
between the dashed circle and the outer circle. By analogy
with the discrete regular network, where the half distance
between two BS is R
c
, we consider that the minimum distance
to interferers is 2R
c
.
For the assumed omnidirectional BS network, we use a
propagation model, where the path gain, g
b,u
, only depends
on the distance r between the BS b and the MS u.Thepower,
p
b,u
, received by a mobile at distance r
u
can thus be written
p
b,u
= P
b
Kr
−η
u
,whereK is a constant and η>2 is the path-
loss exponent.
Let us consider a mobile u at a distance r
u
from its
serving BS b.Eachelementarysurfacezdzdθ at a distance
z from u contains ρ
BS
zdzdθ base stations which contribute
to p
ext,u
. Their contribution to the external interference is
4 EURASIP Journal on Wireless Communications and Networking
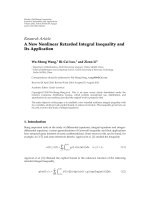
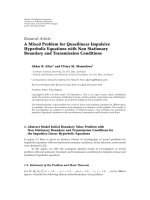
2R
c
− r
u
r
u
R
nw
− r
u
Cell boundary
First BS ring
Network boundary
BS b
MS u
Figure 2: Integration limits for external interference computation.
ρ
BS
zdzdθP
b
Kz
−η
. We approximate the integration surface
by a ring with centre u, inner radius 2R
c
−r
u
,andouterradius
R
nw
− r
u
(see Figure 2)
p
ext,u
=
2π
0
R
nw
−r
u
2R
c
−r
u
ρ
BS
P
b
Kz
−η
zdzdθ
=
2πρ
BS
P
b
K
η − 2
(
2R
c
− r
u
)
2−η
−
(
R
nw
− r
u
)
2−η
.
(12)
Moreover , MS u receives internal power from b,whichis
at distance r
u
: p
int,u
= P
b
Kr
−η
u
. So, the OCIF f
u
= p
ext,u
/p
int,u
can be expressed by
f
u
=
2πρ
BS
r
η
u
η − 2
(
2R
c
− r
u
)
2−η
−
(
R
nw
− r
u
)
2−η
.
(13)
Note that f
u
does not depend on the BS output power.
This is due to the assumption of a homogeneous network (all
base stations have the same transmit power). In our model,
f
u
only depends on the distance r
u
to the BS. Thus, if the
network is large; that is, R
nw
is large compared to R
c
, f
u
can
be further approximated by
f
u
=
2πρ
BS
r
η
u
η − 2
(
2R
c
− r
u
)
2−η
.
(14)
This closed-for m formula will allow us to quickly
compute performance parameters of a cellular network.
However, before going ahead, we need to validate the
different approximations we made in this model.
3.2. Validation of the Fluid Model. In this section, we
validate the fluid model presented in the last section. In this
perspective, we will compare the figures obtained with (13)
to those obtained numerically by simulations. Our s imulator
assumes a homogeneous hexagonal network made of several
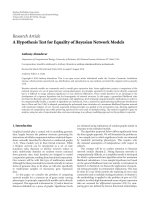
rings surrounding a central cell. Figure 3 shows an example
of such a network with the main parameters involved in the
study: R
c
, the half distance between BS, R = 2
√
3R
c
/3, the
maximum distance in the hexagon to the BS, and R
nw
, the
range of the network.
R
nw
R
c
R
···
Figure 3: Hexagonal network and main parameters of the study.
The fluid model and the traditional hexagonal model are
both simplifications of the reality. None is a priori better
than the other but the latter is widely used, especially for
dimensioning purposes. That is the reason why a comparison
is useful.
The validation is done by Monte Carlo simulations:
(i) at each snapshot, a location is randomly chosen for
MS u in the cell of interest b with uniform spatial
distribution;
(ii) f
u
is computed using (5)withg
j,u
= Kr
−η
j,u
,wherer
j,u
is the distance between the BS j and the MS u.The
serving BS b is the closest BS to MS u;
(iii) the value of f
u
and the distance to the central B S b are
recorded;
(iv) at the end of the simulation, all values of f
u
corresponding to a given distance are averaged and
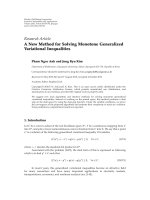
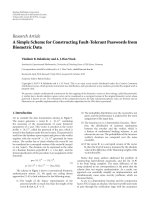
we plot the average value in Figure 4.
Figure 4 shows the simulated OCIF as a function of
the distance to the base station. Simulation parameters are
the following: R
= 1Km; η between 2.7and4;ρ
BS
=
(3
√
3R
2
/2)
−1
; R
nw
is chosen, such that the number of rings
of interfering BS is 15; and the number of snapshots is 1000.
Equation (13) is also plotted for comparison. In all cases, the
fluid model matches very well the simulations on a hexagonal
network for various figures of the path-loss exponent. Note
that at the border of the cell (between 0.95 and 1 Km), the
model is a little bit less accurate because hexagon corners are
not well captured by the fluid model.
Note that the considered network size can be finite
and chosen to characterize each specific local network
environment. Figure 5 shows the influence of the network
size. This model allows thus to develop analyses, adapted to
each zone, taking into account each specific considered zone
parameters.
We moreover note that our model can be used even for
great distances between the base stations. We validate in
Figure 6 the model considering two cell radii: a small one,
R
= 500 m and a large one, R = 2 Km. The latter cur ve allows
us to conclude that our approach is accurate even for a very
low base station density. It also shows that we can use the
EURASIP Journal on Wireless Communications and Networking 5
model for systems with frequency reuse different f rom one
since in this case distances between cochannel BS are greater.
Figure 7 shows the dispersion of f
u
at each distance for
η
= 3. For example, at r
u
= 1Km,f
u
is between 2.8and
3.3 for an average value of 3.0. This dispersion around the
average value is due to the fact that in a hexagonal network,
f
u
is not isotropic.
3.3. OCIF Formula for Hexagonal Networks. Two frame wor ks
for the study of cellular networks are considered in this
paper: the traditional hexagonal model and the fluid model.
While the former is widely used, the latter is very simple and
allows the derivation of an analytical formula for f
u
.The
last section has shown that both models lead to comparable
results for the OCIF as a function of the distance to the BS. If
we want to go further in the comparison of both models, in
particular with the computation of outage probabilities, we
needhowevertobemoreaccurate.
Such calculations require indeed the use of the Q
function (see Section 4.3 and (23)and(24)), which is very
sensitive to its arguments (mean and standard deviation).
This point is rarely raised in literature: analysis and Monte
Carlo simulations can lead to quite different outage probabil-
ities even if analytical average and variance of the underlying
Gaussian distribution are very close to simulated figures.
In this perspective, we provide an alternative formula for
f
u
that better matches the simulated figures in a hexagonal
network. Note that this result is not needed if network
designers use the new framework proposed in this paper.
We first note that f
u
can be rewritten in the following
way:
f
u
=
π
√
3
η − 2
x
η
(
2
− x
)
2−η
,
(15)
where x
= r
u
/R
c
and ρ
BS
= (2
√
3R
2
c
)
−1
. As a consequence, f
u
only depends on the relative distance to the serving BS, x,and
on the path-loss exponent, η. For hexagonal networks, it is
thus natural to find a correction of f
u
that only depends on η.
An accurate fitting of analytical and simulated curves shows
that f
u
should simply be multiplied by an affine function
of η to match with Monte Carlo simulations in a hexagonal
network. Equation (14) can then be rewritten as follows:
f
hexa,u
=
1+A
hexa
η
2πρ
BS
r
η
u
η − 2
(
2R
c
− r
u
)
2−η
,
(16)
where A
hexa
(η) = 0.15η − 0.32 is a corrective term obtained
by least-square fitting. For example, A
hexa
(2.5) = 0.055 (the
correction is tiny) and A
hexa
(4) = 0.28 (the correction is
significative).
4. Outage Probabilities
In this section, we compute the global outage probability
and the spatial outage probability w ith the Gaussian approx-
imation. Closed-form formulas for the mean and standard
deviation of f
u
over a cell are provided.
Quality of service in cellular networks can be charac-
terized by two main parameters: the blocking probability
0
0.10.20.30.40.50.60.70.80.910
1
2
3
4
0.5
1.5
2.5
3.5
f factor
Simulation η = 4
Analysis η
= 3
Analysis η
= 3.5
Simulation η
= 3.5
Analysis η
= 4
Simulation η
= 2.7
Analysis η
= 2.7
Simulation η = 3
Distance to the BS (Km)
Figure 4: OCIF versus distance to the BS; comparison of the fluid
model with simulations on a hexagonal network with η
= 2.7, 3,
3.5, and 4.
and the outage probability. The former is evaluated at the
steady state of a dynamical system considering call arrivals
and departures. It is related to a call admission control ( CAC)
that accepts or rejects new calls. The outage probability is
evaluated in a semistatic system [9], where the number of
MS is fixed and their locations are random. This approach is
often used (see, e.g., [17]) to model mobility in a simple way:
MS jump from one location to another independently. For a
given number of MS per cell, outage probability is thus the
proportion of configurations, where the needed BS output
power exceeds the maximum output power: P
b
>P
max
.
4.1. Global Outage Probability. For a given number of MS
per cell, n, outage probability, P
(n)
out
, is the proportion of
configurations, for which the needed BS output power
exceeds the maximum output power: P
b
>P
max
.Ifnoiseis
neglected and if we assume a single service network (γ
∗
u
= γ
∗
for all u), we deduce from (8)
P
(n)
out
= Pr
⎡
⎣
n−1
u=0
α + f
u
>
1
− ϕ
β
⎤
⎦
, (17)
where ϕ
= P
cch
/P
max
and β = γ
∗
/(1 + αγ
∗
).
4.2. Spatial Outage Probability. For a given number n of MS
per cell, a spatial outage probability can also be defined. In
this case, it is assumed that n MS have already been accepted
by the system, that is, the output power needed to serve
them does not exceed the maximum allowed power. The
spatial outage probability at location r
u
is the probability that
maximum power is exceeded if a new MS is accepted in r
u
.
6 EURASIP Journal on Wireless Communications and Networking
00.20.40.60.81
0
1
2
3
0.5
1.5
2.5
f factor
Simulation 2 rings
Analysis 2 rings
Distance to the BS (Km)
(a)
f factor
0
0.2
0.40.60.81
0
1
2
3
0.5
1.5
2.5
3.5
Simulation 5 rings
Analysis 5 rings
Distance to the BS (Km)
(b)
Figure 5: OCIF versus distance to the BS; comparison of the fluid model with simulations on a two ring (a) and a five ring (b) hexagonal
network (η
= 3).
As for f
u
, we make the approximation that the spatial
outage, P
(n)
sout
(r
u
), only depends on the distance to the BS and
thus, can be w ritten
P
(n)
sout
(
r
u
)
= Pr
⎡
⎣
α + f
u
+
n−1
v=0
α + f
v
>
1
− ϕ
β
|
n−1
v=0
α + f
v
≤
1 − ϕ
β
⎤
⎦
=
Pr
1 − ϕ
/β −
α + f
u
<
n−1
v
=0
α + f
v
≤
1 − ϕ
/β
Pr
n−1
v
=0
α + f
v
≤
1 − ϕ
/β
.
(18)
4.3. Gaussian Approximation. In order to compute these
probabilities, we rely on the Central Limit theorem and use
a Gaussian approximation. As a consequence, we need to
compute the spatial mean and standard deviation of f
u
.The
areaofacellis1/ρ
BS
= πR
2
e
with R
e
= R
c
2
√
3/π.So,we
integrate f
u
on a disk of radius R
e
. As MS are uniformly
distributed over the equivalent disk, the probability density
function (pdf) of r
u
is: p
r
u
(t) = 2t/R
2
e
. Let μ
f
and σ
f
be
respectively the mean and standard deviation of f
u
, when r
u
is uniformly distributed over the disk of radius R
e
μ
f
=
2πρ
BS
η − 2
R
e
0
t
η
(
2R
c
− t
)
2−η
2t
R
2
e
dt
=
2
4−η
πρ
BS
R
2
c
η − 2
R
e
R
c
η
1
0
x
η+1
1 −
R
e
x
2R
c
2−η
dx
=
2
4−η
πρ
BS
R
2
c
η
2
− 4
R
e
R
c
η
2
F
1
η − 2, η +2,η +3,
R
e
2R
c
,
(19)
where
2
F
1
(a, b, c, z) is the hypergeomet ric function, whose
integralformisgivenby
2
F
1
(
a, b, c, z
)
=
Γ
(
c
)
Γ
(
b
)
Γ
(
c − b
)
1
0
t
b−1
(
1
− t
)
c−b−1
(
1
− tz
)
a
dt, (20)
and Γ is the gamma function.
Note that for η
= 3, we have the simple closed formula
μ
f
=−2πρ
BS
R
2
c
ln
(
1 − ν/2
)
ν
2
+
16
ν
+4+
4ν
3
+
ν
2
2
, (21)
EURASIP Journal on Wireless Communications and Networking 7
00.10.20.30.40.5
f factor
0
1
2
3
0.5
1.5
2.5
3.5
Distance to the BS (Km)
Simulation R
= 500 m
Analysis R
= 500 m
(a)
f factor
00.511.52
0
1
2
3
0.5
1.5
2.5
3.5
Distance to the BS (Km)
Simulation R
= 2Km
Analysis R
= 2Km
(b)
Figure 6: OCIF versus distance to the BS; comparison of the fluid model with simulations assuming cell radii R = 500m and R = 2Km
(η
= 3).
where ν = R
e
/R
c
. In the same way, the variance of f (r)is
given by
σ
2
f
= E
f
2
− μ
2
f
,
E
f
2
=
2
4−2η
2πρ
BS
R
2
c
2
η +1
η − 2
2
R
e
R
c
2η
×
2
F
1
2η − 4, 2η +2,2η +3,
R
e
2R
c
. (22)
As a conclusion of this sec tion, the outage probability can be
approximated by
P
(n)
out
= Q
1 − ϕ
/β −nμ
f
− nα
√
nσ
f
,
(23)
where Q(x)
= (1/
√
2π)
∞
x
exp(−u
2
/2)du. And the spatial
outage probability can be approximated by:
P
(n)
sout
(
r
u
)
=
Q
1 − ϕ
/β −nμ
f
−
(
n +1
)
α
− f
u
/
√
nσ
f
−
Q
1 − ϕ
/β −nμ
f
− nα
/
√
nσ
f
1 − Q
1 − ϕ
/β −nμ
f
− nα
/
√
nσ
f
, (24)
where f
u
is given by (14). This equation allows us to
precisely compute the influence of an entering mobile station
whatever its position in a cell and is thus the starting point for
an efficient call admission control algorithm.
For cellular systems without internal interference, the
definition of f
u
is unchanged and (23)and(24) are still valid
provided that α
= 0.
Note that for an accurate fitting of the analytical formu-
las, which are presented in this section, to the Monte Carlo
simulations perfor m ed in a hexagonal network, μ
f
should be
multiplied by (1 + A
hexa
(η)), σ
f
by (1 + A
hexa
(η))
2
and (14)
replaced by (16).
The question arises of the validity of the Gaussian
approximation. The number of users per WCDMA (Wide-
band CDMA) cell is indeed usually not greater than some
tens. Figure 8 compares the pdf of a gaussian variable with
mean μ
f
and standard deviation σ
f
/
√
n with the pdf of
(1/n)
u
f
u
for different values for n. The latter pdf has
8 EURASIP Journal on Wireless Communications and Networking
00.10.20.30.40.50.60.70.80.91
0
1
2
3
0.5
1.5
2.5
3.5
f factor
Analysis
Simulation dispersion
Simulation average
Distance to the BS (Km)
Figure 7: OCIF versus distance to the BS; comparison of the fluid
model with simulations (average value and dispersion over 500
snapshots) on a hexagonal network with η
= 3.
1/n
u
f (r
u
) and its Gaussian approximation
0.5
1
1.5
2
2.5
3
3.5
0
4
0.5
−0.511.52
n
= 30
n
= 10
n = 5
0
Figure 8: Probability density function of (1/n)
u
f
u
(solid line)
and its Gaussian approximation (dotted line).
been obtained by Monte Carlo simulations done on a single
cell, assuming fluid model formula for f
u
. We observe that
gaussian approximation matches better and better when the
number of mobiles increases. Even for very few mobiles in
the cell (n
= 10), the approximation is acceptable. So we c an
use it to calculate the outage probability
4.4. Simulation Methodology. Monte Carlo simulations have
been performed in order to validate the analytical approach.
Afixednumbern of MS are u niformly drawn on a given
cell. All interferers are assumed to have the same transmitted
power ( homogeneous network). O CIF is computed accord-
ing to (5). Power transmitted by the cell is then compared to
P
max
for the calculation of the global outage probability.
5 101520253035
0
1
0.1
0.2
0.3
0.4
0.5
0.6
0.7
0.8
0.9
Outage probability
Simulation
Analysis
Path-loss
exponent
= 2.7
3.5
Number of MS
3
4
Figure 9: Global outage probability as a function of the number
ofMSpercellandforpath-lossexponentsη
= 2.7, 3.5, and 4,
simulation and analysis.
2.533.54
8
10
12
14
16
18
20
22
24
Path-loss exponent
Capacity with 2% outage
Simulation
Analysis
Figure 10: Capacity with 2% outage as a function of the path-loss
exponent η, simulations (solid lines) and analysis (dotted lines) are
compared.
For the spatial outage probability calculation, only
snapshots without outage are considered. A new MS is added
in the cell. The new transmitted power is again compared to
P
max
and the result is recorded with the distance of the new
MS.
4.5. Results. Figures 9, 10,and11 show some results we are
able to obtain instantaneously using the simple formulas
derived in this paper for voice service (γ
∗
u
=−16 dB).
Analytical formulas are compared to Monte Carlo simula-
tions in a hexagonal cellular network (α
= 0.7). Therefore,
EURASIP Journal on Wireless Communications and Networking 9
(16)isused.Figure 9 shows the global outage probabilities as
a function of the number of MS per cell for various values
of the path-loss exponent η. It allows us to easily find the
capacity of the network for any target outage. For example,
a maximal outage probability of 10% leads to a capacity of
about 16 users when η
= 3. Figure 10 shows, as an example,
the capacity with 2% outage as a function of η.
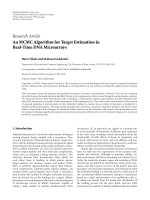
Figure 11 shows the spatial outage probability as a
function of the distance to the BS for η
= 3 and for various
numbers of MS per cell. Given that there are already n, these
curves give the probability that a new user, initiating a new
call at a given distance, implies an outage. As an example, a
new user in a cell with already 16 ongoing calls, will cause
outage with probability 10% at 550 m from the BS and with
probability 20% at 750 m from the BS.
Traditional admission control schemes are based on the
number of active MS in the cell. With the result of this paper,
an operator would be able to admit or reject new connections
also according to the location of the entering MS.
In this sec tion, we show the application of previous
results to network densification. During the dimensioning
process, the cell radius is determined by taking into account
a maximum value of outage probability. This value charac-
terizes the quality of service in terms of coverage the network
operator wants to achieve. The number of BS to cover a given
zone is directly der ived from the cell radius.
Considering a maximum value of the outage probability,
we first characterize cell breathing; that is, the fact that cell
coverage decreases when the cell load increases. We then
analyze BS densification as an answer to cell breathing.
4.6. Cell Breathing Characterization. Let consider a maxi-
mum value of outage probability P
∗
out
= P
(n)
out
.From(23), we
can write:
Q
−1
P
∗
out
=
1 − ϕ
/β −nμ
f
− nα
√
nσ
f
.
(25)
Denoting a
= (1 −ϕ)/β, that equation can be expressed as
α + μ
f
2
n
2
−
2a
α + μ
f
+ σ
2
f
Q
−1
P
∗
out
2
n + a
2
= 0.
(26)
As ρ
MS
is the mobile densit y, we can write n = ρ
MS
A
cov
,
where n is the maximum number of mobiles served by a BS
for maximum outage probability P
∗
out
,andA
cov
is the area
covered by the BS. Let A
cell
= 2
√
3R
2
c
= 1/ρ
BS
be the cell
area. When mobile density increases, A
cov
decreases, so that
A
cov
≤ A
cell
.
5. Application to Network Densification
We now obtain the following equation
α + μ
f
2
A
2
cov
ρ
2
MS
−
2a
α + μ
f
+ σ
2
f
Q
−1
P
∗
out
2
A
cov
ρ
MS
+ a
2
= 0.
(27)
0
0.1
0.2
0.3
0.4
0.5
0.6
0.7
0.8
0.9
1
010.10.20.30.40.50.60.70.80.9
Spatial outage probability
Simulation
Analysis
n
= 20
n
= 18
n
= 16
n = 14
Distance to BS (Km)
Figure 11: Spatial outage probability as a function of the distance
to the BS for various numbers of users per cell and for η
= 3.
This equation has two solutions. The maximum mobile
density can be expressed as
ρ
MS
=
1
2
α + μ
f
2
A
cov
×
2a
α + μ
f
+ σ
2
f
Q
−1
P
∗
out
2
+
σ
2
f
Q
−1
(
P
∗
out
)
2
σ
2
f
Q
−1
(
P
∗
out
)
2
+4a
α + μ
f
.
(28)
In this equation, mean and standard deviation of f
u
, μ
f
,
and σ
f
, are computed over the covered area A
cov
with surface
A
cov
μ
f
=
1
A
cov
A
cov
f
u
ds,
σ
2
f
=
1
A
cov
A
cov
f
2
u
ds −μ
2
f
.
(29)
Equation (28) shows the link between the mobile density
and the covered area and is now used to characterize cell
breathing.
NumericalvaluesinFigure 12 shows the results we obtain
thanks to (28) assuming voice service (γ
∗
u
=−16 dB), ϕ =
0.2, α = 0.7, η = 3 in a CDMA network.
The solid curve shows the mobile density as a function
of the coverage area of base stations. On this curve, the BS
density is supposed to be constant, R
c
= 1Km and thus
A
cell
= 2
√
3 ≈ 3.46 Km
2
.ThecoverageareaA
cov
however
shrinks when the traffic (characterized here by the density
of mobiles ρ
MS
) increases. For example, going from point
1withρ
MS
= 10 mobiles/Km
2
to point 2 with ρ
MS
=
15 mobiles/Km
2
reduces the covered area from 3.46 Km
2
to
10 EURASIP Journal on Wireless Communications and Networking
0.511.522.533.5
0
5
10
15
20
25
30
35
40
45
50
55
60
65
70
2
Cell breathing, fixed BS density
Continuous coverage, variable BS density
1
3
A
cov
(Km
2
)(cellcoverage)
ρ
MS
(mobiles/Km
2
)(mobile density)
Figure 12: Cell breathing (fixe d BS density) and BS densification
(variable BS density) in a cellular network.
approximately 2.6Km
2
. As a consequence, the cell is not
completely covered, and due to cell breathing, coverage holes
appear.
5.1. Base Station Densification. A way of solving the issue
of cell breathing is to densify the network. The dotted line
in Figure 12 plots the mobile density as a function of the
covered area assuming full coverage of the cell. Along this
curve, A
cov
= A
cell
and when A
cov
is decreasing, the BS
density is increasing. We are thus able to find, for a given
mobile density, the BS density that will ensure continuous
coverage in the network. For example, for 20 mobiles/Km
2
,
the cell area should be approximately 1.5Km
2
in order to
avoid coverage holes.
The sequence 1-2-3 shows an example of scenario, where
BS densification is needed. In point 1, the network has been
dimensioned for 10 mobiles/Km
2
. If the cellular operator is
successful and so more subscribers are accessing the network,
mobile density increases along the solid line of Figure 12.At
point 2, coverage holes appear and the operator decides to
densify the network. While adding new BS, he has to jump to
point 3 in order to ensure continuous coverage. At point 2,
he needs approximately 0.38 BS per Km
2
(A
cov
= 2.6Km
2
),
while at point 3, he needs about 0.48 BS per Km
2
(A
cov
=
2.1Km
2
), which corresponds to a 26% increase.
6. Conclusion
In this paper, we have proposed and validated by Monte
Carlo simulations a fluid model for the estimation of outage
and spatial outage probabilities in cellular networks. This
approach considers BS as a continuum of transmitters and
provides a simple formula for the other-cell power ratio
(OCIF) as a function of the distance to the BS, the path-
loss exponent, the distance between BS and the network size.
Simulations show that the obtained closed-form formula
is a very good approximation, even for the traditional
hexagonal network. The simplicity of the result allows a
spatial integration of the OCIF leading to closed-form
formula for the global outage probability and for the spatial
outage probability. At last, this approach allows us to quantify
cell breathing and network densification.
References
[1]A.M.ViterbiandA.J.Viterbi,“Erlangcapacityofapower
controlled CDMA system,” IEEE Journal on Selected Areas in
Communications, vol. 11, no. 6, pp. 892–900, 1993.
[2] J.S.EvansandD.Everitt,“Effective bandwidth-based admis-
sion control for multiservice CDMA cellular networks,” IEEE
Transactions on Vehicular Technology, vol. 48, no. 1, pp. 36–46,
1999.
[3] T. Liu and D. Everitt, “Analytical approximation of other-
cell interference in the uplink of CDMA cellular systems,” in
Proceedings of the IEEE Vehicular Technology Conference (VTC
’06), vol. 2, pp. 693–697, May 2006.
[4] A. J. Viterbi, A. M. Viterbi, and E. Zehavi, “Other-cell interfer-
ence in cellular power-controlled CDMA,” IEEE Transactions
on Communications, vol. 42, no. 2, pp. 1501–1504, 1994.
[5] A.J.Viterbi,CDMA—Principles of Spread Spect rum Commu-
nication, Addison-Wesley, Reading, Mass, USA, 1995.
[6] K. S. Gilhousen, I. M. Jacobs, R. Padovani, A. J. Viterbi,
L. A. Weaver Jr., and C. E. Wheatley III, “On the capacity
of a cellular CDMA system,” IEEE Transactions on Vehicular
Technology, vol. 40, no. 2, pp. 303–312, 1991.
[7] S E. Elayoubi and T. Chahed, “Admission control in the
downlink of WCDMA/UMTS,” in Proceedings of the 1st Inter-
national Workshop of the EURO-NGI Network of Excellence,
Lecture Notes in Computer Science, pp. 136–151, Springer,
2005.
[8] C. C. Chan and S. V. Hanly, “Calculating the outage proba-
bility in a CDMA network with spatial poisson traffic,” IEEE
Transactions on Vehicular Technology, vol. 50, no. 1, pp. 183–
204, 2001.
[9] F. Baccelli, B. Błaszczyszyn, and M. K. Karray, “Blocking rates
in large CDMA networks via a spatial Erlang formula,” in
Proceedings of the 24th Annual Joint Conference of the IEEE
Computer and Communications Societies (INFOCOM ’05),pp.
58–67, Miami, Fla, USA, March 2005.
[10] S. Toumpis and L. Tassiulas, “Packetostatics: deployment of
massively dense sensor networks as an electrostatics problem,”
in Proceedings of the 24th Annual Joint Conference of the IEEE
Computer and Communications Societies (INFOCOM ’05),pp.
2290–2301, Miami, Fla, USA, March 2005.
[11] P. Jacquet, “Geometry of information propagation in mas-
sively dense ad hoc networks,” in Proceedings of the 5th ACM
International Symposium on Mobile Ad Hoc Networking and
Computing (MoBiHoc ’04), pp. 157–162, ACM, May 2004.
[12] J M. Kelif, “Admission control on fluid CDMA networks,” in
Proceedings of the 3rd International Symposium on Modeling
and Optimization in Mobile, Ad Hoc, and Wireless Networks
(WiOpt ’06), Trentino, Italy, April 2006.
[13] J M. Kelif and E. Alman, “Downlink fluid model of CDMA
networks,” in Proceedings of the 2005 IEEE 61st Vehicular
Technology Conference (VTC ’05), pp. 2264–2268, June 2005.
[14]J M.Kelif,M.Coupechoux,andP.Godlewski,“Spatial
outage probability for cellular networks,” in Proceedings of
the 50th Annual IEEE Global Telecommunications Conference
(GLOBECOM ’07), pp. 4445–4450, November 2007.
EURASIP Journal on Wireless Communications and Networking 11
[15] J M.Kelif,M.Coupechoux,andP.Godlewski,“Fluidmodel
of the outage probability in sectored wireless networks,”
in Proceedings of the IEEE Wireless Communications and
Networking Conference (WCNC ’08), pp. 2933–2938, April
2008.
[16] X. Lagrange, Principes et
´
evolutions de l’UMTS, Hermes, 2005.
[17] T. Bonald and A. Prouti
`
ere, “Conservative estimates of block-
ing and outage probabilities in CDMA networks,” Performance
Evaluation, vol. 62, no. 1–4, pp. 50–67, 2005.