Báo cáo hóa học: " Research Article Cyclostationarity Detectors for Cognitive Radio: Architectural Tradeoffs" pptx
Bạn đang xem bản rút gọn của tài liệu. Xem và tải ngay bản đầy đủ của tài liệu tại đây (1.16 MB, 8 trang )
Hindawi Publishing Corporation
EURASIP Journal on Wireless Communications and Networking
Volume 2010, Article ID 526429, 8 pages
doi:10.1155/2010/526429
Research Article
Cyclostationarity Detectors for Cogn itive Radio:
Architectural Tradeoffs
Dominique Noguet, Lionel Biard, and Marc Laugeois
CEA-LETI-MINATEC, 17 rue des Martyrs, 38054 Grenoble cedex 9, France
Correspondence should be addressed to Dominique Noguet,
Received 17 November 2009; Revised 25 February 2010; Accepted 15 July 2010
Academic Editor: Danijela Cabric
Copyright © 2010 Dominique Noguet et al. This is an open access article distributed under the Creative Commons Attribution
License, which permits unrestricted use, distribution, and reproduction in any medium, provided the original work is properly
cited.
Cyclostationarity detectors have been studied in the past few years as an efficient means for signal detection under low-SNR
conditions. On the other hand, some knowledge about the signal is needed at the detector. This is typically the case in Cognitive
Radio spectrum secondary usage, where the primary system is known. This paper focuses on two hardware architectures of
cyclostationarity detectors for OFDM signals. The first architecture aims at secondary ISM band use, considering IEEE802.11a/g
as the primary system. In this scenario, low latency is required. The second architecture targets TV band secondary usage, where
DVB-T signals must be detected at very low SNR. The paper focuses on the architectural tradeoffs that the designer has to face,
and how his/her choices will influence either performance or complexity. Hardware complexity evaluation on FPGA is provided
for detectors that have been tested in the laboratory under real conditions.
1. Introduction
Recently, there has been a growing interest in signal detection
in the context of Cognitive Radio [ 1], and more specifically
in that of opportunistic radio, where secondary Cognitive
Radio Networks (CRNs) can be operated over frequency
bands allocated to some primary system in so far as this
primary system is absent or, in a more general case, whenever
harmful interference with primary systems can be avoided.
In most cases, the presence of the primary system is assessed
through direct detection of its communication signal,
although beaconing is sometimes considered [2]. Thus, in
many situations, the primary system detection problem is
transposed to the problem of detecting a communication
signal in the presence of noise. Surveys of signal detection in
the context of spectrum sensing have been proposed in the
literature [3, 4]. These detectors operate according to the a
priori knowledge they have about the signal and the model
of this signal. Telecommunication signals are modulated
by sine wave carriers, pulse trains, repeated spreading,
hopping sequences, or exhibit cyclic prefixes. Thus, these
signals are characterized by the fact that their momentum
(mean, autocorrelation, etc.) exhibits periodicity. This built-
in periodicity, which of course is not present in noise, can
be exploited to detect signals in the presence of noise even
at a low Signal-to-Noise Ratio (SNR) [5]. Using this model,
the signal detection process becomes a test for presence
of cyclostationary characteristics of the tested signal [6–
8].
Many scenarios have been investigated in the context of
CRN over the past years. The two most likely to occur in
the short term are, on the one hand, the unlicensed usage
of TV bands and, on the other hand, the opportunistic
use of unlicensed bands by nonlegacy secondary systems.
The first scenario, often referred to as the TV White Space
(TVWS) scenario, was made possible by the FCC in the US in
2008, with some restrictions which include high-sensitivity
requirements for primary user detection [9]. In the context of
this scenario, standardization has been very active, especially
under the IEEE802.22 banner [10]. Industry fora, like the
White Space Coalition, have given more momentum to
this option. The second scenario is, for obvious regulatory
reasons, the first that can be practically experimented and
used [11].
2 EURASIP Journal on Wireless Communications and Networking
In this context, implementation of blind cyclostationarity
detectors has been proposed. In [12], a detector based
on Cyclostationary Spectrum Density (CSD) is suggested.
The CSD theoretically makes it possible to explore the
presence of cyclic frequencies for any autocorrelation lag at
any frequency (also referred to as 2D CSD). However, the
comprehensive 2D CSD is never implemented in practice due
to its huge implementation cost. To sort out this issue, 1D
CSDs are preferred to limit implementation cost. The CSD
can be performed on the time domain autocorrelation [13,
14], or through the analysis of signal periodicity redundancy
in the frequency domain [15]. In both cases however, a large
FFT operator (512 to 2048) needs to be implemented, leading
to significant hardware complexity. The approach described
hereafter goes one step further in narrowing down the CSD
domain. Indeed, in both scenarios of interest, the primary
systems (which are the ones requiring the highest detection
sensitivity) are known. Therefore, analysis of the primary
signal nature helps narrow down the CSD search to very
specific cyclic frequencies, thereby avoiding implementation
of a large FFT.
However, when the CSD is narrowed down, the algo-
rithm becomes more specific to the signal to detect. For this
reason, this paper will analyze two different implementation
options depending on the aforementioned scenarios. The
main reason justifying different types of implementation
in the WiFI and TVWS scenarios is the sensitivity level
required in each case. In the case of TVWS, the guarantee
that secondary CRN will not interfere with licensed systems
(TV, microphones) leads to high-sensitivity requirements.
On the other hand, unlicensed band networks, such as
IEEE802.11x, have lighter coexistence constraints. These
specific requirements lead to architectural tradeoffswhich
are examined in this pap er. First, the principle of prefix-based
cyclostationarity detection will be recapped. Then, the two
aforementioned scenarios will be analyzed by pinpointing
their impact on the sensor requirement. Considering these
requirements, two hardware implementation architectures
will be described and evaluated. These approaches will be
compared and discussed before concluding the paper.
2. Cyclostationarity Detector for OFDM Signal
In both scenarios considered in this paper, in the pri-
mary system—DVB-T broadcast system on the one hand,
IEEE802.11a/g networks on the other—the signal is mod-
ulated using Orthogonal Frequency Digital Multiplexing
(OFDM); see, for example, [16]. The OFDM signal is a
compound signal consisting of multiple frequency carriers,
also called subcarriers or tones, that are each modulated in
phase or in phase and amplitude. From a practical outlook,
the modulated tones are multiplexed at the transmitter
using an inverse FFT. Conversely, the subcarriers are de-
multiplexed at the receiver end by an FFT. The size of the FFT
N, which defines that of the OFDM symbols, depends on the
system. In the case of IEEE802.11a/g systems, 64 subcarriers
are used whereas the DVB-T signal uses 1024, 2048, 4096,
or 8192 tones. In order to avoid intersymbol interference, a
Guard Interval (GI) is introduced. In the case of OFDM, this
GI is designed as a copy of the last samples of the OFDM
symbol. This approach provides the symbol with a cyclic
nature which simplifies the receiver. For this reason, this D
long GI is called the Cyclic Prefix (CP).
Let us now consider the autocorrelation of this signal,
R
y
(
u, m
)
= E
y
(
u + m
)
· y
∗
(
u
)
. (1)
Under the condition that all subcarr iers are used, the
autocorrelation of an OFDM signal is written as [17]
R
y
(
u, m
)
= R
y
(
u,0
)
δ
(
m
)
+ R
y
(
u, N
)
δ
(
m
− N
)
+ R
y
(
u,
−N
)
δ
(
m + N
)
.
(2)
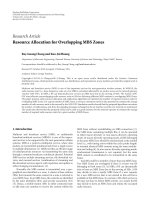
The first term corresponds to the energy of the signal.
Energy detectors, which analyze this term only, provide poor
performance at low SNR. Therefore, we focus on the two
other terms, which stem from the repetition of the cyclic
prefix present at the beginning and the end of each symbol. It
can be shown that the term R
y
(u, N) is a periodic function of
u [8] which characterizes the signal y. R
y
(u, N)hasaperiod
of α
−1
= N + D. This cyclostationary nature of the signal is
illustrated in Figure 1.
Thus, R
y
(u, N) can be written as a Fourier series [5]:
R
y
(
u, N
)
= R
0
y
(
N
)
+
k=α
−1
/2−1
k=−α
−1
/2,k
/
= 0
R
kα
y
(
N
)
e
2 jπkαu
. (3)
In (3), each Fourier coefficient R
kα
y
(N) is the cyclic correla-
tion at frequency kα at time lag N. This term is also written
as
R
kα
y
(
N
)
= lim
U →∞
1
U
u=U−1
u=0
E
y
(
u + N
)
y
∗
(
u
)
· e
−2jπkαu
,(4)
whichcanbeestimatedasfollows:
R
kα
y
(
N
)
=
1
U
u=U−1
u=0
y
(
u + N
)
y
∗
(
u
)
· e
−2jπkαu
. (5)
The basic idea behind the cyclostationarity detector is to
analyze this Fourier decomposition and assess the presence
of the signal by setting a cost function related to one [18]
or more [19] of these cyclic frequencies. This cost function
is compared to some reference value. Several papers related
to this algorithm have been proposed in the literature [17,
19–21]. They mainly differ in the way the harmonics are
considered. In this paper, we consider the cost function
suggested in [17]. By introducing the oversampling rate of
T
c
/T
e
and by considering N
b
harmonics, this cost function
can be derived from (5) as follows:
J
y,N
(
N
b
)
=
N
b
k=−N
b
U−1
u=0
y
(
u+N
)
T
c
T
e
y
∗
u
T
c
T
e
e
(−2iπku/N+D)(T
c
/T
e
)
2
.
(6)
EURASIP Journal on Wireless Communications and Networking 3
CP
0
CP
0
CP
0
CP
1
CP
1
CP
0
CP
1
CP
−1
NNDD
y(n)
y(n
− N)
E[y(n)y
∗
(n − N)]
Figure 1: Ideal autocorrelation signal of an OFDM symbol burst.
−
Delay
line
Complex
multiplier
Complex
multiplier
Complex
multiplier
Acc
Acc
Modulus
Modulus
Modulus
+
+
Acc
+
Acc
+
Acc
+
+
+
+
Acc
+
y
⎛
⎜
⎜
⎝
(u + N)
T
c
T
e
⎞
⎟
⎟
⎠
y
⎛
⎜
⎜
⎝
(u + N)
T
c
T
e
⎞
⎟
⎟
⎠
y
∗
⎛
⎜
⎜
⎝
u
T
C
T
e
⎞
⎟
⎟
⎠
k = 0
k
= 1
k
= 2
2N
b
e
−2iπku
N
+ D
T
c
T
e
U−1
u
=0
y
⎛
⎜
⎜
⎝
(u + N)
T
c
T
e
⎞
⎟
⎟
⎠
y
∗
⎛
⎜
⎜
⎝
u
T
C
T
e
⎞
⎟
⎟
⎠
e
−2iπku
N
+ D
T
c
T
e
J
y,N
(N
b
)
table
Look-up
table
Look-up
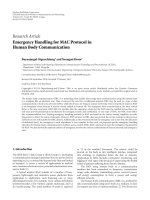
Figure 2: Cyclostationarity detector for WiFi signals.
It can be observed that the cost function is only built upon
R
kα
y
(N) while R
−kα
y
(−N) is omitted. Indeed, it is fairly easy to
prove that for all k,
R
kα
y
(N) =
R
−kα
y
(−N)
∗
(where ∗ denotes
the complex conjugation).
3. Cyclostationarity Detector Architecture for
WiFi Signals
The cyclostationarity detector for IEEE802.11a/g signals is
specified considering the scenario presented in [22]. In this
scenario, the detector is used to check the presence of WiFi
signals in order to trigger data transmission from a secondary
system which is completely independent from the primary
system (no messaging exchanged, no synchronization per-
formed). Besides, in order to achieve the highest spectrum
efficiency, the secondary system is expected to exploit time
gaps (opportunities) in the time domain rather than to leave
the channel to find a vacant one. Although this st rategy may
lead to some collisions, it is found acceptable due to the
nature of the primary (unlicensed system) and in so far as
the impact is not significant at application level [22].
Focusing on the design of the cyclostationarity detector,
this scenario leads to the requirements of a low-latency
detector. Detector latency directly impacts the duration of
the time gaps that will be exploited by the secondary system.
When the primary system is bursty, which is the typical
nature of WiFi traffic, latency should be far shorter than
the gaps between two consecutive bursts. The need for low
latency calls for a parallel approach in which the Fourier
coefficients are computed at the same time. Such a structure
is described in Figure 2.
This architecture is directly derived from (6). The top
left corner block computes one single observation of the
4 EURASIP Journal on Wireless Communications and Networking
0
0.1
0.2
0.3
0.4
0.5
0.6
0.7
0.8
0.9
1
Probability of detection
−20 −19 −18 −17 −16 −15 −14 −13 −12 −11
SNR (dB)
N
b
= 0
N
b
= 2
N
b
= 5
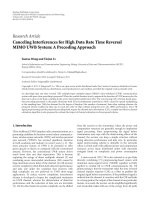
Figure 3: Influence of N
b
.
autocorrelation function. Each grey block then computes
the Fourier coefficients in parallel. Each of these branches
is accumulated over the observation time U before being
aggregated by the sum blocks on the right of the figure.
The first point to consider when designing a parallel
architecture is to analyze how many branches need to
be instantiated. In other words, how the cyclostationary
detector performs according to N
b
. For this purpose, the
probability of detection is computed as a function of the
SNR under AWGN conditions for various N
b
values. Other
parameters are kept constant. For instance U is set to a large
value (U
= 1000). The results obtained are provided in
Figure 3. For Figures 3–6, 1000 independent iterations have
been carried out to build the curve.
Selecting N
b
= 0 corresponds to considering the funda-
mental frequency only, which is equivalent to performing
energy detection. Detector performance is maximized for
asmallN
b
value, which implies that performance can be
maximized for a limited hardware complexity. Aggregating
harmonics still further causes perfor mance to decrease since
high harmonics, of low amplitude, are strongly impacted
by noise. This shows that performance can be optimized
with respect to N
b
while preserving a limited hardware
complexity.
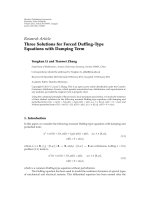
Another important parameter for the detector is the
size of the integration window U (where U denotes the
number of OFDM symbols considered for integration).
Although this parameter has a more limited impact on
hardware complexity (only the accumulators are slightly
larger), U has a strong influence on latency, another major
requirement in the scenario. As expected, increasing U
does indeed improve performance significantly as shown in
Figure 4.
Limiting detector latency while preserving performance
of long observation time is possible by trading U against
0
0.1
0.2
0.3
0.4
0.5
0.6
0.7
0.8
0.9
1
SNR (dB)
Probability of detection
−20 −18 −16 −14 −12 −10 −8 −6 −4 −20
U
= 5
U
= 10
U
= 100
U
= 1000
Figure 4: Influence of U (with N
b
= 2).
T
c
/T
e
(F
e
= 1/T
e
= 20 MHz). Oversampling is expected to
have a similar influence on performance in that it increases
U, except for the fact that T
c
/T
e
cannot be reasonably
increased to a similar extent to U. Therefore, whenever
latency is not critical, increasing U should be considered.
Besides, increasing T
c
/T
e
directly impacts the length of the
delay line of the correlator, as well as the look-up tables used
for storage of the sine waveforms, whereas U had only a
slight impact on the complexity of the accumulators in each
branch. Thus, priority should be given to increasing U in so
far as detector latency fits into the latency specification. In
the case of the WiFi detector, 5 OFDM symbols correspond
to a latency of 20 μs. Additional performance can then
be ensured by a reasonable increase in T
c
/T
e
to limit
the additional complexity drawback. Figure 5 shows the
influence of T
c
/T
e.
Finally, the last parameter that needs to be determined
is W, the width of the binary word representing the I/Q
input data. Assuming that the full dynamic range is preserved
throughout the architecture, it is obvious that this parameter
will significantly impact hardware complexity. However, the
impact on detector performance is less obvious, and some
simulations must be quantified. These simulation results are
provided in Figure 6.
Figure 6 shows that near optimal performance can be
obtained where W
= 4. However, to preserve some
additional margin, a value of 8 is preferred, with rescal-
ing after each macro block to guarantee a good perfor-
mance/complexity tradeoff. With these parameters, detector
overall latency has been measured at 40.5 μs.
Finally, the complexity of detector hardware implemen-
tation is determined on a Xilinx Virtex 4 target technology
using the ISE XST synthesis tool. Results are provided in
Tab le 1 when the following parameter values are considered:
N
= 64, D = 16, U = 5, N
b
= 2, T
c
/T
e
= 1, and W = 4.
EURASIP Journal on Wireless Communications and Networking 5
−16 −14 −12 −10 −8 −6 −4 −20
0
0.1
0.2
0.3
0.4
0.5
0.6
0.7
0.8
0.9
1
SNR (dB)
Probability of detection
T
c
/T
e
= 1
T
c
/T
e
= 2
T
c
/T
e
= 8
Figure 5: Influence of T
c
/T
e
(N = 64, D = 16, U = 5, N
b
= 2).
4. Cyclostationarity Detector Architecture for
DVB-T Signals
In the same way as IEEE802.11a/g, the physical layer of
DVB-T is based on an OFDM modulation. However, some
key elements differ from WiFi systems. First, the DVB-T
standard defines four FFT sizes: N
= 1024, 2048, 4096,
or 8192, and F
e
= 8 MHz. The cyclic prefix over FFT
size ratio D/N can also vary: 1/32, 1/16, 1/8, and 1/4.
However, in practice, implementation considers a smaller set
of parameters depending on the country.
For instance, in France, the set of parameters used is
N
= 8192, D/N = 1/32. Another key difference, which
will be exploited in the architecture design, stems from
the broadcast nature of the DVB-T signal. This means that
detector sensitivity can be increased significantly by very long
integration time which cannot be considered in the case of
short signal bursts occurring in WiFi. This is, of course, a
relevant feature since sensitivity requirements for primary
user detection are very demanding (typically SNR
= −10 dB,
to which an additional margin for detector Noise Figure must
be added [23]).
Another point derived from the broadcast nature of
the signal is the way the reference sig nal used to define
the decision threshold is computed. When undertaking this
calibration phase, the secondary system needs to consider a
reference value which is independent from signal presence.
When considering long (ideally infinite) integration time, the
autocorrelation function R
y
(u, N)definedinSection 2 tends
to a rectangular signal as depicted in Figure 1, the cyclic ratio
of which is D/(N + D). In this case, the Fourier coefficient is
written as
R
kα
y
(
N
)
=
A
2π · k
sin
2π
· k · D
N + D
+ j
1 − cos
2π
· k · D
N + D
.
(7)
−12 −10 −8 −6 −4 −2
0
2
4
6
8
SNR (dB)
W
= 2
W = 3
W
= 4
W
= 8
0
0.1
0.2
0.3
0.4
0.5
0.6
0.7
0.8
0.9
1
Probability of detection
Figure 6: Influence of W (N = 64, D = 16, U = 5, N
b
= 2, T
c
/T
e
=
1)
Table 1: Complexity evaluation of the WiFi detector.
Complexity
Latency
Slices RAM Mult
1960 0 35 40.5 μs
Each coefficient power is given by
R
0
y
2
=
A · D
N + D
2
, k = 0,
R
kα
y
2
= 2
A
2πk
2
1 − cos
2π
· k · D
N + D
, k
/
= 0.
(8)
It is obvious from (8) that R
kα
y
(N) = 0 whenever kD/(N + D)
is an integer value. This holds for instance when
k
=
N
D
+1. (9)
Figure 7 plots the Fourier coefficients of a rectangular signal
when N/D
= 32.
It can therefore be concluded that Fourier harmonic 33
is not impacted by the presence of the signal and can thus be
used for calibration purposes to define the reference noise
level. As a comparison, calibration based on input power
computation (i.e., (1/U)
U−1
u
=0
|y(u)|
2
) is not relevant as this
estimator is st rong ly impacted by the presence of the sig nal.
When considering the first 4 harmonics [
−3; +3], a decision
variable V can be expressed as follows:
V
=
2
7
3
i
=−3
|h
i
|
2
|h
−33
|
2
+ |h
33
|
2
. (10)
Of course, this technique holds for infinite integration time
to guarantee the rectangular shape of the autocorrelation
6 EURASIP Journal on Wireless Communications and Networking
0246810121416182022242628303234363840
−40
−35
−30
−25
−20
−15
−10
−5
0
Harmonic power (dB)
Fourier decomposition coefficient of square signal (N/D = 32)
Harmonic index
Figure 7: Fourier coefficient values for N/D = 32.
35
30
25
20
15
10
5
0
Input SNR (dB)
Useful to noise harmonic ratio (dB)
−12 −7
−2
3 8 13 18
n
= 128
n = 64
n = 32
Figure 8: Detection threshold according to the input SNR.
estimator (Figure 1). Whenever a finite integration is per-
formed, the convergence of the integrator needs to be
considered. The integrator is a first order IIR filter, the z
transform of which is given by
H
(
z
)
=
1
n
1
1 −
((
n
− 1
)
/n
)
z
−N
, (11)
where n can be tuned to adjust the raising time of the filter.
Indeed, the indicial response of the filter is given by
s
ind
(
k
)
= 1 −
n − 1
n
k
(
k
≥ 0
)
. (12)
The raising time k
r
(in number of symbols) to reach 90% is
then given by
k
r
≤
2.3
ln
(
n/
(
n − 1
))
− 1 ≤ k
r
+1. (13)
Table 2: Complexity evaluation of the DVB-T detector.
Complexity
Latency
Slices RAM blocks of 18 kbits Mult
1600 122 23 Depends on n
For large n values, the expression in (13) tends to 2.3n.
Estimator performance is increased by increasing the inte-
gration ability of the filter. This is, however, at the cost
of long integration time. Thus, this approach is to be
considered for “always on” kind of systems, such as DVB-T
broadcast signals to guarantee reliable detection under low
SNR-conditions.
Figure 8 shows the decision variable V as a function
of the input SNR (under AWGN conditions) for several
values of n. The area before the curve corresponds to
a 0.5 detection probability and must be avoided. The
aim of the curve is to show how increase in integration
time impacts the performance of the detector for a given
threshold value. For instance when an SNR of
−7dB is
targeted and for a threshold set to 15, no detection is
possible when considering n
= 32. However, when n is
set to 128, a reliable behavior is achieved. Setting n to 64
results in nonreliable decisions. From this graph, a trade-off
between SNR detection condition and integration time can
be set.
Detection and probability detection curves based on real
signal measurements will be provided in a future paper.
However, in order to evaluate a first implementation of
the detector, parameter values used for the WiFi case were
considered as an initial assumption. Final ly, the cyclostation-
ary detector hardware architecture for DVB-T is shown in
Figure 9. First, the autocorrelation is computed on the I/Q
complex samples. The IIR integrator then averages over a
number of symbols tuned by setting the integration time
parameter to achieve the required sensitivity. The supervisor,
a Finite State Machine (FSM), then triggers the writing into
abuffer that stores 8 k filter output samples (equivalent
to the length of an OFDM symbol). Then, using a faster
clock, the Fourier harmonics are computed sequentially.
Unlike parallel computation over distinct instances in the
architecture of Section 2, parallelism is achieved here using
a faster clock and some control mechanisms provided by
the FSM, even though latency constraints are not as critical
as in the first case study. The sine generator computes
sequentially the required sine function of the Fourier taps
of interest. The Multiply ACcumulate (MAC) function
enables the Fourier coefficient to be obtained for these taps.
The sequence is as follows. First, the reference harmonics
{−33; +33} are generated to compute the noise reference
power. Then, the harmonics of interest for the DVB-T signal
{0; −1; +1; −2; +2; −3; +3} are calculated. The power of each
harmonic is summed up to obtain the cyclostationarity
estimator value. Finally, the decision engine gives the final
result by comparing the estimated value to the threshold
value according to (10), which provides a hard decision
output of the detector.
EURASIP Journal on Wireless Communications and Networking 7
Sampling clock System clock
Input real part-I
Autocorrelation
computation
IIR first order
I
Q
I
Q
I
Q
I
Q
I
Q
Write
Write
interface
One symbol
acquisition
DP-RAM
Read interface
MAC
Power computation
@ Read
Start
Supervisor manager
Control
signals
Useful harmonics
mp
Control signals
Sequential sine generator
exp(j.π.mp/(N + D))
p is
{−33; +33; (noise harmonics))
0; (fundamental harmonics)
−1; +1; (cyclic harmonics 1)
−2; +2; (cyclic harmonics 1)
−3; +3; } (cyclic harmonics 1)
Decision engine
Threshold
Decision
Input imaginary part-Q
Noise harmonics
m in 0; L symbol-1
accumulator
accumulator
Figure 9: Cyclostationarity detector for DVB-T signals.
Finally, the complexity of detector hardware implemen-
tation is determined on a Xilinx Virtex 5 target technology
using the ISE XST synthesis tool. Results are provided in
Tab le 2.
5. Conclusion
This paper presents 2 cyclostationarity detectors targeting
different s cenarios. It is shown in the paper that selection
of the scenario has a strong influence on architecture and
its performance tradeoffs. First, when aiming at secondary
usage of ISM bands with time leftover reuse, latency is
the key parameter. With this architecture, latency as low as
40.5 μs was measured. Besides, the cyclostationary detectors
of this paper outperform classical energy detectors in terms
of probability of detection (e.g., Pd is increased by 0.4 where
SNR
= −17 dB in the WiFi case). This has led to a parallel
design in which sensitivity is traded against low latency as
collisions with the primary system may be tolerated. On
the other hand, when considering secondary spectrum usage
of licensed bands, collisions are not permitted and much
attention must be paid to sensitivity. This is achieved through
long integration time which relies on the assumption that
the signal is either “always on” or absent. This assumption
makes the second architecture ideally suited to broadcast
signal detection (e.g., DVB-T), but would be inapplicable to
the first scenario.
Acknowledgments
The authors would like to acknowledge the ORACLE
EuropeanISTprojectofthe6thFrameworkProgramand
the French ANR INFOP project for supporting the work
presented in this paper.
References
[1] J. Mitola, Cognitive radio: an integrated agent architecture
for software defined radio, Ph.D. thesis, Royal Institute of
Technology, Stockholm, Sweden, May 2000.
[2] L. Berlemann and S. Mangold, Cognitive Radio and Dynamic
Spectrum Access, John Wiley & Sons, New York, NY, USA,
2009.
[3] A. Sahai and D. Cabric, “A tutorial on spectrum sensing:
fundamental limits and practical challenges,” in Proceedings of
the IEEE Symposium on New Frontiers in Dynamic Spectrum
Access Networks (DySPAN ’05), B altimore, Md, USA, Novem-
ber 2005.
[4] D. Noguet et al., “Sensing techniques for cognitive radio—
state of the art and trends,” April 2009, />groups/scc41/6/documents/white
papers/P1900.6 WhitePa-
per
Sensing final.pdf.
[5] W. A. Gardner, Statistical Spectral Analysis: A Nonprobabilistic
Theory, Prentice-Hall, Englewood Cliffs, NJ, USA, 1988.
[6] G. D.
ˇ
Zivanovi
´
c and W. A. Gardner, “Degrees of cyclo-
stationarity and their application to signal detection and
estimation,” Signal Processing, vol. 22, no. 3, pp. 287–297,
1991.
[7] W. A. Gardner and C. M. Spooner, “Signal interception:
performance advantages of cyclic-feature detectors,” IEEE
Transactions on Communications, vol. 40, no. 1, pp. 149–159,
1992.
[8] W. Gardner and A. William, Cyclostationarity in Communica-
tions and Signal Processing, IEEE Press, New York, NY, USA,
1994.
[9] “FCC adopts rules for unlicensed use of television white
spaces,” Official announcement of FCC, November 2008,
/>[10] IEEE 802.22, “Wireless Regional Area Networks (“WRANs”),”
/>8 EURASIP Journal on Wireless Communications and Networking
[11] L. Biard, D. Noguet, T. Gernandt, P. Marques, and A. Gameiro,
“A hardware demonstrator of an opportunistic radio system
using temporal opportunities,” in Proceedings of the 4th
International Conference on Cognitive Radio Oriented Wireless
Networks and Communications (CrownCom ’09), pp. 1–6,
Hanover, Germany, June 2009.
[12] Z. Ye, J. Grosspietsch, and G. Memik, “Spectrum sensing using
cyclostationary spectrum density for cognitive radios,” in
Proceedings of the IEEE Workshop on Signal Processing Systems,
Shanghai, China, October 2007.
[13] V. Turunen, M. Kosunen, A. Huttunen et al., “Implementation
of cyclostationary feature detector for cognitive radios,” in
Proceedings of the 4th International Conference on Cogni-
tive Radio Oriented Wireless Networks and Communications
(CrownCom ’09), Hannover, Germany, June 2009.
[14] V. Turunen, M. Kosunen, S. Kallioinen, A. Parssinen, and J.
Ryynanen, “Spectrum estimator and cyclostationary detector
for cognitive radio,” in European Conference on Circuit Theory
and Design (ECCTD ’09), pp. 283–286, Antalya, Turkey,
August 2009.
[15]Y.Tachwali,M.Chmeiseh,F.Basma,andH.H.Refai,
“A frequency agile implementation for I EEE 802.22 using
software defined radio platform,” in Proceedings of the IEEE
Global Telecommunications Conference (GLOBECOM ’08),pp.
3128–3133, New Orleans, La, USA, December 2008.
[16] R. Prasad, OFDM for Wireless Communications Systems,Artech
House, Norwood, Mass, USA, 1999.
[17] P. Jallon, “A spread signals detection algorithm based on the
second order statistics in semi-blind contexts,” in Proceedings
of the 3rd International Conference on Cognitive Radio Oriented
Wireless Networks and Communications (CrownCom ’08),May
2008.
[18] A. V. Dandawat
´
e and G. B. Giannakis, “Statistical tests for
presence of cyclostationarity,” IEEE Transactions on Signal
Processing, vol. 42, no. 9, pp. 2355–2369, 1994.
[19] J. Lund
´
en, V. Koivunen, A. Huttunen, and H. V. Poor,
“Spectrum sensing in cognitive radios based on multiple
cyclic frequencies,” in Proceedings of the 2nd International
Conference on Cognitive Radio Oriented Wireless Networks and
Communications (CrownCom ’07), pp. 37–43, Orlando, Fla,
USA, August 2007.
[20] M. Ghozzi, M. Dohler, F. Marx, and J. Palicot, “Cognitive
radio: methods for detection of free bands,” Elsevier Science
Journal, vol. 7, pp. 794–805, 2006.
[21] A. Bouzegzi, P. Jallon, and P. Ciblat, “A second order statistics
based algorithm for blind recognition of OFDM based
systems,” in Proceedings of the IEEE Global Telecommunications
Conference (GLOBECOM ’08), pp. 3257–3261, December
2008.
[22] ORACLE D6.1 Deliverable, “Definition of test scenarios for
the demonstrator,” August 2007, />[23] S. Shellhammer, “Spectrum sensing in IEEE802.22,” in Pro-
ceedings of the 1st IAPR Workshop on Cognitive Information
Processing (CIP ’08), Santorini, Greece, June 2008.