Báo cáo sinh học: " Research Article Time-Frequency Characterization of Cerebral Hemodynamics of Migraine Sufferers as " pptx
Bạn đang xem bản rút gọn của tài liệu. Xem và tải ngay bản đầy đủ của tài liệu tại đây (2.2 MB, 10 trang )
Hindawi Publishing Corporation
EURASIP Journal on Advances in Signal Processing
Volume 2010, Article ID 459213, 10 pages
doi:10.1155/2010/459213
Research Article
Time-Frequency Characterization of Cerebral Hemodynamics of
Migraine Sufferers as Assessed by NIRS Signals
Filippo Molinari,
1
Samanta Rosati,
1
William Liboni,
2
Emanuela Negri,
2
Ornella Mana,
2
Gianni Allais,
3
and Chiara Benedetto
3
1
Biolab, Department of Electronics, Polytechnic of Turin, 10129 Torino, Italy
2
Department of Neuroscience, Gradenigo Hospital, 10153 Turin, Italy
3
Women’s Headache Center, Department of Gynecology and Obstetrics, University of Torino, 10126 Torino, Italy
Correspondence should be addressed to Filippo Molinari, fi
Received 31 December 2009; Accepted 24 June 2010
Academic Editor: L. F. Chaparro
Copyright © 2010 Filippo Molinari et al. This is an open access article distributed under the Creative Commons Attribution
License, which permits unrestricted use, distribution, and reproduction in any medium, provided the original work is properly
cited.
Near-infrared spectroscopy (NIRS) is a noninvasive system for the real-time monitoring of the concentration of oxygenated
(O
2
Hb) and reduced (HHb) hemoglobin in the brain cortex. O
2
Hb and HHb concentrations vary in response to cerebral
autoregulation. Sixty-eight women (14 migraineurs without aura, 49 migraineurs with aura, and 5 controls) performed breath-
holding and hyperventilation during NIRS recordings. Signals were processed using the Choi-Williams time-frequency transform
in order to measure the power variation of the very-low frequencies (VLF: 20–40 mHz) and of the low frequencies (LF:
40–140 mHz). Results showed that migraineurs without aura present different LF and VLF power levels than controls and
migraineurs with aura. The accurate power measurement of the time-frequency analysis allowed for the discrimination of the
subjects’ hemodynamic patterns. The time-frequency analysis of NIRS signals can be used in clinical practice to assess cerebral
hemodynamics.
1. Introduction
Autoregulation of blood flow denotes the intrinsic ability of
an organ or a vascular bed to maintain a constant perfusion
in presence of blood pressure changes and metabolic demand
[1, 2]. In particular, the mechanism of cerebral autoreg-
ulation represents the tendency of cerebral blood flow to
remain relatively constant, despite changes in mean arterial
blood pressure and neuronal activity [3]. This mechanism
is particularly important for the human brain, since it
represents a protection condition against sudden and abrupt
arterial blood pressure changes and intracranial pressure
disturbances. The autoregulatory mechanism acts by tuning
the vasodilation and vasoconstriction of the cerebral micro-
vessels [4]. This activity, usually called vasomotor reactivity,
determines the blood volume supplied to the brain tissue,
thus fixing the total available oxygen. In some pathologic
conditions, autoregulation may be impaired or even lost
[1, 5, 6].
The assessment of autoregulation is usually made by
means of active stimuli [4]. Breath-holding (BH) is effective
in triggering autoregulation, since the increase of the carbon
dioxide in the blood determines a vasodilation of the
cerebral vessels. Conversely, hyperventilation (HYP) triggers
vasoconstriction, since the increase of oxygen in the blood
determines a reduction of the cerebral blood flow. The
quantification of autoregulation can be done either by
measuring the changes in the cerebral blood flow velocity
in the brain arteries (by means of transcranial Doppler
sonography [4, 7, 8]) or by measuring the concentration of
oxygen and carbon dioxide in brain tissue (by means of near-
infrared spectroscopy [9–13]). Specifically, near-infrared
spectroscopy (NIRS) systems allow for the noninvasive real-
time monitoring of the concentration of oxygenated and
reduced hemoglobin in brain cortex. The subject’s autoreg-
ulatory capability is assessed by measuring the changes in
the oxygen content, carbon dioxide content, and cerebral
blood flow velocity during an active stimulus like BH or HYP
2 EURASIP Journal on Advances in Signal Processing
[14–16]. All the above-mentioned indicators are derived by
the signals’ time course.
Several studies documented the altered autoregulation,
and consequent altered vasomotor reactivity, in migraine
sufferers [17–19]. Migraine, in fact, is now considered
essentially as a neurovascular pathology [19]. Results are
not consistent in literature, since the testing procedures
may vary from group to group. In previous studies, we
documented a limited vasodilation capability in migraine
sufferers [12], but Vernieri et al. recently found an increase
in the vascular response of migraineurs [20], possibly
mediated by a dysfunction in the autonomic control. Such
experiments, conducted on groups of patients, document the
limited reliability of time-derived parameters when used to
assess autoregulation.
In 2000, Obrig et al. [21] studied the spontaneous
low frequency oscillations of cerebral hemodynamics and
metabolism in adult human head by using NIRS. Though
conducted on healthy volunteers, this study introduced
the possibility of frequency-derived parameters used to
assess cerebral autoregulation. It is known that cerebral
hemodynamic signals have a power spectrum essentially
consisting of two different bands [22].
(1) A very low frequency band (VLF - also called B-
waves) that reflects the long-term autoregulation. At
brain level, VLFs are thought to be generated by brain
stem nuclei, which modulate the lumen of the small
intracerebral vessels. In humans, the VLF is usually
comprised between 20 and 40 mHz.
(2) A low frequency band (LF - also called M-waves)
that is common to most mammalians. Such waves
reflect the systemic oscillations of the arterial blood
pressure and are modulated by the sympathetic
system activity. LFs spans from about 40 to 140 mHz.
The above-described frequency bands can be observed
on most of in vivo instrumental recordings, comprising
transcranial Doppler, functional magnetic resonance, NIRS,
laser-Doppler flowmetry, fluororeflectometry, and optical
imaging [21]. Unfortunately, almost all the above-cited
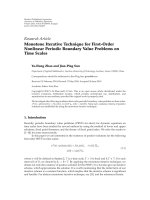
techniques provide nonstationary signals. An example of
NIRS signals recorded during the BH (panel A) and HYP
(panel B) of a healthy volunteer is shown in Figure 1.The
nonstationarity affecting the signals is evident; therefore, a
proper spectral analysis must be carried out using a joint
time and frequency approach.
In this paper, we applied a time-frequency analysis
procedure to NIRS signals recorded on a sample population
of subjects affected by migraine with (MwA) and without
(MwoA) aura. Aura is a specific disturbance associated
with migraine that can cause visual, speech, or perceptional
impairments. It has been proven that aura determines an
alteration in the subjects’ cerebral hemodynamics. Even
if cerebral autoregulation impairment has been observed
during MwA attacks, it is still unclear whether MwA sufferers
present a normal autoregulation during attack-free periods
[20]. The aim of our study was twofold: (i) first, to accurately
measure the VLF and LF power changes in the NIRS signals
BH offset
BH onset
10 sTime
−3
−2
−1
0
1
2
3
4
5
6
7
Chromophore concentration (μmol/l)
(a)
HYP offsetHYP onset
20 sTime
−3
−2
−1
0
1
2
3
Chromophore concentration (μmol/l)
(b)
Figure 1: NIRS signals recorded on a healthy woman performing
breath-holding (a) and hyperventilation (b). The red line represents
the O
2
Hb concentration signal, the blue line the HHb. The black
vertical dashed lines mark the onset and offset of the breath-holding
(a) and hyperventilation (b). The graphs show that the NIRS signals
become nonstationary as consequence of the active stimuli.
of migraineurs during active stimulations; and (ii) second, to
document possible differences in the cerebral hemodynamics
of MwA and MwoA sufferers.
The paper is organized as follows: in Section 2, the
basics of NIRS devices and experimental procedures will be
presented, along with the description of the time-frequency
analysis procedure and the statistical tests. Section 3 will
describe the results in terms of different hemodynamic
patterns and spectral analyses, whereas Section 4 will discuss
the results and the importance of a time-frequency analysis
of NIRS signals in pathology. Section 5 will conclude the
paper.
2. Materials and Methods
2.1. NIRS Recording and Experimental Protocol. NIRS is a
spectroscopic technique that allows for the noninvasive and
EURASIP Journal on Advances in Signal Processing 3
PRE BH POST
20 sTime
0
20
40
60
80
100
120
140
160
180
200
0
1
2
Frequency (mHz)
Concentration
(μmol/l)
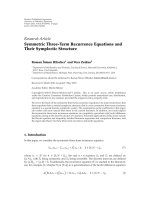
Figure 2: HHb concentration signal (upper panel) recorded on
a healthy woman before (PRE), after (POST) and during breath-
holding (BH). The vertical dashed lines mark the onset and offset
of the BH. the Lower panel shows the 6-levels contour plot of the
Choi-Williams time-frequency distribution of the signal (σ
= 0.05).
The red rectangle indicates the LF band (40–140 mHz), the green
the VLF band (20–40 mHz). In this subject, there is a neat increase
of the VLF and LF power after BH (POST region).
real time monitoring of the concentration of oxygenated
(O
2
Hb) and reduced (HHb) hemoglobin in the human
brain. Since the two types of hemoglobin have different
absorption peaks, by using two light wavelengths, it is
possible to monitor their concentration changes. A sub-
stance interacting with a particular wavelength is called
“chromophore”. Previous studies demonstrated that when
monitoring human brain by using NIRS, the most important
chromophores are O
2
Hb, HHb, and the cytochrome-c-
oxidase (which is a neuronal metabolic marker). Other
absorbers such as water, lipids, plasma, muscles, and bones
can be neglected since their absorption peaks are far from the
infrared region [23, 24]. In this study, we will not consider
cytochrome-c-oxidase data since they are more linked to
a functional aspect of brain functioning rather than to
hemodynamics.
In NIRS systems, a beam of light in the infrared band
(wavelengths ranging from 650 nm to 870 nm are usually
used) is injected into the skull by a photoemitter placed
on the scalp. The light photons traveling into the skull are
partly absorbed and partly scattered. A photodetector placed
few centimeters far from the emitter acquires the photons
emerging from the skull. The intensity of the measured light
is indicative of the concentration of a given absorber. Unlike
other spectroscopic systems, the NIRS devices usually adopt
a scattering-based measurement and not a transmission-
based measurement (i.e., the photodetector is not placed
controlateral to the source), therefore the traditional absorp-
tion equation cannot be used to measure the chromophore
10.80.60.40.20−0.2−0.4−0.6−0.8−1
Component 1
1
0.8
0.6
0.4
0.2
0
−0.2
−0.4
−0.6
−0.8
−1
Component 2
BHI
HHb
S
VLF
preHYP
P
LF
postBH-HHb
P
LF
postBH-O
2
Hb
P
LF
preHYP-O
2
Hb
(a)
10.80.60.40.20−0.2−0.4−0.6−0.8−1
Component 1
1
0.8
0.6
0.4
0.2
0
−0.2
−0.4
−0.6
−0.8
−1
Component 3
S
VLF
preHYP
P
LF
postBH-HHb
P
LF
postBH-O
2
Hb
P
LF
preHYP-O
2
Hb
BHI
HHb
(b)
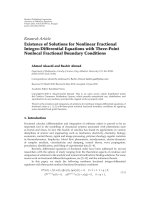
Figure 3: Principal component representation of the subjects in the
hyperplanes formed by (a) the 1st and 2nd components, and (b) the
1st and 3rd components. Red squares indicate the healthy controls,
green circles the migraine without aura patients, and the yellow
circles the migraine with aura patients. The blue lines represent the
loading/loading plot of the PCA: the lines indicate the direction of
the original variables in the hyperplanes. The length of the blue lines
projected onto the axis is proportional to the weight of the original
variable for the specific component. Migraine without aura subjects
(green circles) are clearly clustered far from the other subjects.
concentrations changes. The traditional absorption Beer-
Lambert law, is redefined in the following modified way
(modified Beer-Lambert law)
ΔA
(
λ
)
= L
(
λ
)
ln
(
10
)
i
ε
i
(
λ
)
Δc
i
,(1)
where
(i) ΔA(λ) is the attenuation change at the wavelength λ;
(ii) L(λ) is the total pathlength (mm) traveled by the
photons at wavelength λ;
4 EURASIP Journal on Advances in Signal Processing
20 sTime
0
20
40
60
80
100
120
140
160
180
200
−2
−1
0
1
2
Frequency (mHz)
Concentration
(μmol/l)
(a)
20 sTime
0
20
40
60
80
100
120
140
160
180
200
−3
−2
−1
Frequency (mHz)
Concentration
(μmol/l)
(b)
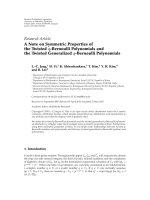
Figure 4: Time-frequency representations of O
2
Hb (a) and HHb
(b) concentration signals during BH. The graphs are relative to a
subject suffering from migraine without aura. The vertical dashed
lines mark the BH onset and offset. The red rectangle indicates the
LF band (40–140 mHz), the green the VLF band (20–40 mHz). It is
possible to notice that BH seems to decrease the spectral content of
the signals in the LF band.
(iii) Δc
i
is the concentration change (μmol · l
−1
)oftheith
chromophore at the wavelength λ;
(iv) ε
i
(λ) is the decadic extinction coefficient (μmol
−1
·
l · mm
−1
) of the ith chromophore at the wavelength
λ.
The attenuation is linearly dependent on the chro-
mophores concentration changes; therefore, by measuring
the light attenuation and solving the system in (1), it is
possible to measure Δc
i
. The total distance L(λ) the photons
travel into brain depends on the source-detector distance
increased by a specific contribution given by scattering.
This multiplier is called the differential pathlength factor.
Okadaetal.proposedadifferential pathlength factor value of
5.97 for infrared scattering in a model of adult human head
[25].
We used a commercially available NIRS device
(NIRO300, Hammamatsu Photonics, Australia) equipped
by a 3-wavelengths source. The emitting probe of the
NIRS equipment was placed on the left frontal side of the
subjects, 2 cm beside the midline and about 3 cm above
the supraorbital ridge. We chose this positioning in order
to avoid the sinuses and to place the probes on a poorly
perfused and very thin skin layer. The receiving sensor was
fixed laterally to the emitter at a distance of about 5 cm. To
avoid bias from environmental light, a black cloth covered
the NIRS probe. Chromophores concentration changes were
acquired continuously at a sampling rate equal to 2 Hz,
discretized by a 16-bit A/D converter, lowpass filtered at
350 mHz by means of an ARMA Chebychev filter with ripple
in the stopband, and transferred to a laptop (by using a serial
link) for further processing.
The recordings took place in a quiet and dimmed room
with a constant temperature of 24-25
◦
C. The subjects were
lying in supine position with eyes closed and breathing room
air. All the subjects performed the following experimental
protocol:
(1) 120 seconds of resting;
(2) a voluntary breath-holding followed by other 120
seconds of resting;
(3) a voluntary hyperventilation at the constant rate of
about 20 respiratory acts per minute;
(4) a final resting period of 120 seconds.
The BH and HYP maneuvers were used to trigger cerebral
autoregulation, since it is proven that BH induces vasodila-
tion and HYP vasoconstriction [5, 11].
2.2. Time-Frequency Analysis of NIRS Signals. Figure 1
reports sample NIRS signals of a healthy volunteer perform-
ing BH (Figure 1(a))andHYP(Figure 1(b)). The red line
reports the O
2
Hb concentration variation during time, the
blue the HHb. The vertical dashed lines mark the onset and
offset of the BH (Figure 1(a))andHYP(Figure 1(b)). The
hemoglobin concentration significantly varies during time:
in Figure 1(a), vasodilation corresponds to an increase in the
O
2
Hb and a decrease in the HHb concentrations, whereas
in Figure 1(b), vasoconstriction corresponds to a decrease
in the O
2
Hb and an increase in the HHb concentrations.
In Figure 1(b), the concentration signals are dominated
by a harmonic trend that is synchronous with the forced
respiratory rate.
The inner structure of the NIRS signals recorded during
active maneuvers (BH and HYP) is clearly different from
the one corresponding to the resting state. Therefore, these
signals cannot be considered as stationary, not even in a
wide-sense. We chose to process such signals using the
time-frequency distributions belonging to the Cohen’s class
[26]. The definition of a generic bilinear time-frequency
EURASIP Journal on Advances in Signal Processing 5
20 sTime
0
20
40
60
80
100
120
140
160
180
200
−2
0
2
4
Frequency (mHz)
Concentration
(μmol/l)
(a)
20 sTime
0
20
40
60
80
100
120
140
160
180
200
−1
−0.5
0
0.5
1
Frequency (mHz)
Concentration
(μmol/l)
(b)
Figure 5: Time-frequency representations of O
2
Hb (a) and HHb
(b) concentration signals during BH. The graphs are relative to a
subject suffering from migraine with aura. The vertical dashed lines
mark the BH onset and offset. The red rectangle indicates the LF
band (40–140 mHz), the green the VLF band (20–40 mHz). It is
possible to notice that BH seems to neatly increase the LF band
power of the signals.
distribution D
xx
(t, f ) belonging to the Cohen’s class can be
given as
D
xx
t, f
=
+∞
−∞
x
t
−
τ
2
x
∗
t
+
τ
2
×
g
(
τ, θ
)
e
− j2πθ(t
−t)
e
− j2πfτ
dt
dθ dτ,
(2)
where x(t) is the signal under analysis, θ and τ are the
frequency and time lags, respectively, and g(τ, θ) is the
kernel of the time-frequency distribution. We used the
Choi-Williams distribution (CW) [27], whose kernel is
expressed as g(τ, θ)
= e
−(τ
2
θ
2
/σ)
,whereσ is a selectivity
50 sTime
0
20
40
60
80
100
120
140
160
180
200
−0.5
0
0.5
Frequency (mHz)
Concentration
(μmol/l)
Figure 6: Time-frequency Squared Coherence Function (SCF)
between the O
2
Hb (red line) and HHb (blue line) concentration
signals during BH. The graph is relative to a subject suffering from
migraine with aura. The vertical dashed lines mark the BH onset
and offset. The SCF is represented by a contour plot. The white spots
indicate time instants and frequency values where the coherence
between the signals approximates 1.
parameter. Large values of σ determine a lower attenuation
of the interference terms, whereas small values make the
representation cleaner. However, small σ values might result
in an evident loss of spectral resolution in the time-frequency
plane. We used the CW transform since it proved effective
in the analysis of biological signals and was used in a pilot
previous study on NIRS signals [28].
We computed the signals time-frequency distributions
by means of a custom developed toolbox running in
Matlab (TheMathworks, Natick, MA, USA) environment.
This toolbox first computes the instantaneous autocorre-
lation function of a time series x[n], then computes the
corresponding ambiguity function by an inverse Fourier
transform, applies the CW kernel, and finally computes the
D
xx
(t, f ) by a double Fourier transform from the lags to
the time and frequency variables. Our algorithm discretizes
the instantaneous autocorrelation function R
xx
(t, τ) = x(t −
τ/2)x
∗
(t + τ/2) defined by (2) according to the following
formula:
R
xx
[
n, k
]
= x
[
n − k
]
x
∗
[
n + k
]
,(3)
where n represents the discrete time and k the time lag. The
definition in (3) is symmetrical with respect to the time lag,
but it is clearly subjected to possible frequency aliasing. In
fact, the symmetrical definition of the correlation product
determines a subsampling of the τ axis of a factor equal to 2.
Therefore, the maximum frequency that can be represented
by this definition is equal to f
s
/4, being f
s
the sampling
frequency. Since the bandwidth upper limit of our NIRS
signals was equal to about 200 mHz, being 2 Hz the sampling
rate, our time-frequency representations did not suffer from
aliasing.
6 EURASIP Journal on Advances in Signal Processing
We also computed the time-frequency Squared Coher-
ence Function (SCF) between the O
2
Hb and the HHb
concentration signals. Being x(t) the O
2
Hb concentration
signal and y(t) the HHb, the SCF between the two signals
was defined as
SCF
xy
t, f
=
D
xy
t, f
2
D
xx
t, f
·
D
yy
t, f
,(4)
where D
xy
(t, f ) is the cross time-frequency CW representa-
tion of the O
2
Hb and HHb concentration signals, D
xx
(t, f )
is the time-frequency CW representation of the O
2
Hb signal,
and D
yy
(t, f ) that of the HHb signal.
All the auto and cross time-frequency distributions were
computed on a 256 seconds time window, with the event
(either BH of HYP) centered in the middle of the window
(see Figure 1), so that the theoretical spectral resolution
was better than 4 mHz. This value was a good compromise
between the need for a suitable separation of the VLF and LF
bands and for keeping the experimental protocol sufficiently
short.
All the signals were converted to their analytical represen-
tation with zero mean and no trend. Trends were removed by
using high-pass filtering (Chebychev filter, with ripple in the
stopband and cutoff frequency equal to 15 mHz).
Figure 2 reports an example of time-frequency repre-
sentation (depicted by means of a 6-levels contour plot) of
the HHb signal of a healthy woman performing BH. The
upper panel shows the time course of the HHb concentration
signal, the lower the CW representation (σ was kept equal
to 0.5 for all the signals). The vertical dashed lines represent
the BH onset and offset. The green rectangle overlaid to the
image shows the VLF frequency band, the red rectangle the
LF. In this specific subject, there is a noticeable increase in the
power of the LF band after BH.
2.3. Subjects. We tested 5 healthy women taken as controls
(age: 30.2
± 12.1 years), 14 women suffering from MwoA
(age: 44.4
± 9.7 years) and 49 women suffering from MwA
(age: 38.0
± 12.1 years), for a total of 68 subjects. Migraine
with and without aura was diagnosed according to the
criteria of the International Headache Society [29]. Migraine
subjects were tested in the interictal period, when they were
free of pain.
The study received the approval from the Review Insti-
tutional Committee of the Gradenigo Hospital of Torino
(Italy), where all the experiments were conducted. All the
subjects were instructed about the purposes of the study and
signed an informed consent prior of being tested.
2.4. Statistical Analysis. We organized the data in a matrix
containing the 68 subjects as rows and 26 measured variables
as columns. On each subject, we measured the following
variables derived from the time-frequency representations:
(i) the HHb and O
2
Hb power in the VLF and LF bands
(P
VLF
and P
LF
), before and after BH (for a total
of 8 variables) averaged on a 60 seconds window
expressed in percentage with respect to the total
signal power;
(ii) the HHb and O
2
Hb power in the VLF and LF bands
(P
VLF
and P
LF
), before and after HYP (for a total
of 8 variables) averaged on a 60 seconds window
expressed in percentage with respect to the total
signal power;
(iii) the O
2
Hb and HHb SCF value in the two bands
(SCF
VLF
and SCF
LF
), before and after BH and HYP
(for a total of 8 variables) averaged on a 60 seconds
window;
(iv) the BHI index for HHb and O
2
Hb signals (2
variables). These measures are standard in the cere-
bral assessment and derive from the concentration
signals time course. Considering the O
2
Hb signal, the
BHI
O2Hb
is defined as the percent variation of the
O
2
Hb concentration as effect of BH, normalized with
respect to the BH duration [14, 30].
The first column of Tabl e 1 summarizes the measured
variables. The signal power in the VLF and LF bands
was computed by integration of the corresponding time-
frequency representation.
We used ANOVA analysis to extract the most significant
variables from the set of parameters of Tab le 1 (first column)
that explained the data distribution based on pathology.
We performed a one-way ANOVA analysis considering
the pathology as independent variable and the remaining
values as dependent variables, one at a time. Among the
variables, we removed all the observations with P value
greater than 10%. This allowed for a reduction of the number
of variables and for avoiding an overfitting of the system with
strongly correlated variables. Then, we performed an unsu-
pervised analysis on the remaining variables to represent our
sample population on the basis of the measured parameters.
Specifically, we performed a principal component analy-
sis (PCA) in order to better represent the data information
in a transformed domain with lower dimensionality. PCA
generates a set of new variables, called principal components
(PCs), as linear combination of the original ones. PCA was
used to observe which spectral parameters could be of help
in clustering the subjects of our mixed sample population.
3. Results
Ta bl e 1 reports the results of the ANOVA analysis considering
as the subject pathology independent variable and the 26
previously described measurements as dependent variables.
We chose to keep only the variables resulting in a P value
lower than 10% (such variables are marked by an asterisk
in the second column of Tabl e 1). The ANOVA analysis
restituted five variables: the O
2
Hb power in the LF band
after BH (P
LF
postBH - O
2
Hb), the HHb power in the LF
band after BH (P
LF
postBH - HHb), the O
2
Hb power in the
LF band before HYP (P
LF
preHYP - O
2
Hb), the coherence
valueintheVLFbandbeforeHYP(SCF
VLF
preHYP), and
the BHI
HHb
. These variables are the ones that best describe
EURASIP Journal on Advances in Signal Processing 7
Table 1: ANOVA results. Results of one-way ANOVA analysis per-
formed considering as independent variable the subject pathology
(no migraine, MwA, or MwoA). The first column reports the
dependent variables and the second column reports the associated
P-value. The significant results (P<10%) are indicated with
asterisk.
Dependent variable P value
P
VLF
preBH - O
2
Hb 58.63%
P
VLF
postBH - O
2
Hb 21.05%
P
LF
preBH - O
2
Hb 69.43%
P
LF
postBH - O
2
Hb 8.92%
∗
P
VLF
preBH - HHb 86.72%
P
VLF
postBH - HHb 56.04%
P
LF
preBH - HHb 99.15%
P
LF
postBH - HHb 5.32%
∗
P
VLF
preHYP - O
2
Hb 11.91%
P
VLF
postHYP - O
2
Hb 78.48%
P
LF
preHYP - O
2
Hb 3.22%
∗
P
LF
postHYP - O
2
Hb 90.51%
P
VLF
preHYP - HHb 87.42%
P
VLF
postHYP - HHb 90.66%
P
LF
preHYP - HHb 14.03%
P
LF
postHYP - HHb 61.34%
S
VLF
preBH 86.72%
S
VLF
postBH 85.30%
S
LF
preBH 97.94%
S
LF
postBH 14.47%
S
VLF
preHYP 0.49%
∗
S
VLF
postHYP 57.99%
S
LF
preHYP 35.04%
S
LF
postHYP 20.15%
BHI
O2
50.04%
BHI
HHb
0.02%
∗
Table 2: PCA components. Weights of the three principal compo-
nents of the PCA analysis in function of the five original variables.
Variable Component 1 Component 2 Component 3
P
LF
postBH - O
2
Hb −0.61 −0.08 −0.21
P
LF
postBH - HHb −0.61 0.21 −0.11
P
LF
preHYP - O
2
Hb −0.47 −0.17 0.027
S
VLF
preHYP 0.17 0.36 −0.89
BHI
HHb
−0.08 0.89 0.38
the sample population and, therefore, are expected to be
significantly different in the three subgroups of subjects.
PCA was conducted on a data set consisting of a matrix
with 68 rows (patients) and the above-mentioned 5 observa-
tions. All the variables were standardized by removing their
mean value and by normalizing with respect to their standard
deviation. We chose to represent the data using the first 3
PCs that explained 80.7% of the total variance of the data.
Ta bl e 2 reports the weights of the five variables for the three
components. The first component is dominated by the O
2
Hb
and HHb LF power after BH, the second by the BHI
HHb
,and
the third by the coherence value in the VLF band before HYP.
Figure 3 reports the distribution of the original data set
on the hyperplanes formed by component 1 and 2 (upper
graph), and component 1 and 3 (lower graph). Green circles
represent the MwoA subjects, yellow circles the MwA, and
the red squares the healthy subjects (i.e., the controls). The
continuous blue lines represent the projection of the original
variables on the hyperplanes. The graphs of Figure 3 are
mixed representations: the circles and squares represent the
subjects in the new systems originated by the PCs (i.e., it
is a scores/scores plot), whereas the blue lines with the text
labels represent the original variable in function of the new
coordinate systems (i.e., it is a loading/loading plot). It can
be observed that MwoA subjects (green circles) are clustered
relatively far from the MwA and healthy subjects. With
reference to Figure 3 upper panel, the most characterizing
original variables for MwoA subjects are those directed
towards right (i.e., the positive axis of Component 1): P
LF
postBH - O
2
Hb, P
LF
postBH - HHb, and P
LF
preHYP
-O
2
Hb. Specifically, MwoA subjects should have lower
values of the above-mentioned three variables with respect
to the other subjects of the sample population, since in
the loading/loading plot the blue lines mark the increasing
direction of the original variables in the PCs space.
Figure 4 depicts the CW time-frequency representation
of the O
2
Hb (Figure 4(a)) and HHb (Figure 4(b))concen-
tration signals of a MwoA performing BH. The vertical
dashed lines mark the onset and offset of the BH. The
overlaid red rectangle indicates the LF band on the time-
frequency plane, the green the VLF. Considering the time-
frequency representation after BH, it is possible to notice
that there is a low signal power in the red rectangle both in
the O
2
Hb and HHb graphs. Figure 5 depicts the CW time-
frequency representation of the BH performed by a MwA
subject, with analogous coding of Figure 4. In Figures 5(a)
and 5(b), it is evident that after BH the power content of
the O
2
Hb and HHb is higher than for the MwoA subject.
Particularly, in Figure 5(b) it can be noticed that the HHb
concentration signal after BH shows diffuse components up
to 100–140 mHz. BH enforces the LF oscillations in the MwA
subject, whereas it depresses the LF content in the MwoA
subject.
4. Discussion
The time-frequency analysis of NIRS signals recorded during
active maneuvers allowed for the unsupervised analysis of
a mixed population consisting of healthy women, women
suffering from MwA, and women suffering from MwoA.
To the best of our knowledge, this is the first study
coupling time-frequency analysis applied to the NIRS signals
and a multivariate analysis for the characterization of a
neurological disorder.
In a previous study, we showed that women suffering
from MwA revealed an impaired carbon dioxide regulatory
mechanism with respect to controls [28]. Specifically, we
found that BH caused an increase in the LF band power
on the HHb signal that was statistically lower than the
8 EURASIP Journal on Advances in Signal Processing
increase of controls. This result was obtained by means of
the CW transform applied to the NIRS signals recorded on
a 256 seconds time window in which the subject performed
BH. In this study, we enlarged the recording window and
adopted a longer testing protocol that incorporates the
HYP too. However, despite the enlargement of the test, our
previous results are confirmed. Figure 3 shows that MwA
subjects are located in a hyperplane region corresponding
to lower values of HHB power in the LF band after BH
than controls. Even though such difference is not neat, a
significant number of MwA subjects shows a behavior similar
to that we documented in our previous study [28].
The novel result of this study relies in the observation
that MwoA sufferers seem characterized by a completely
different oxygenation pattern. After BH, they had a very low
power in the LF band (Figure 4) both on the O
2
Hb and
HHb concentration signals. A statistical test conducted on
the MwoA subsample revealed that BH did not increase the
LF power in the NIRS signals (Student’s t-test, P<.01). The
other variables discriminating the MwoA patients from the
rest of the population were the BH
HHb
, the power in the LF
band of the O
2
Hb signal before HYP, and the coeherence
value between O
2
Hb and HHb in the VLF band before HYP.
Except the BHI
HHb
, which is derived from the time course of
the signals, the other discriminant variables are linked to the
frequency content of the NIRS oxygenation signals.
From a methodological point of view, the use of time-
frequency analysis proved essential in the characterization of
the subjects’ cerebral hemodynamics during active maneu-
vers. Active tests such as BH and HYP are needed to
test the regulatory mechanisms. However, they introduce
evident nonstationarities in the recorded signals. As pre-
viously observed [21], cerebral autoregulation is based on
two distinct mechanisms, which originate the VLF and LF
bands. During the regulatory action, the power in these
bands changes, thus making the NIRS signals strongly
nonstationary. Since the VLF and LF bands are very close and
centered at very low frequency values (ranging from about
20 mHz to 140 mHz), a frequency analysis tool with high
spectral resolution is required.
The bilinear time-frequency distributions belonging to
the Cohen’s class are a good choice, since they couple
a good and constant resolution on the frequency axis
to the effective possibility of interference terms rejection.
We analyzed our signals on a 265 seconds time window
incorporating the active stimulus (either BH or HYP). Obrig
et al. in 2000 studied the spontaneous oscillations detected by
NIRS during apnea and visual stimulation by using a 102.4
seconds time window. They used the Welch periodogram
with 512 Hanning-type window and 128 points of overlap
[21]. Therefore, having a sampling rate of 10 Hz, their
spectral resolution was slightly better than 20 mHz. They had
to limit their spectral resolution due to the nonstationary
nature of NIRS signals: they recorded signals epochs before
and after the stimulations, with the hypothesis that, in such
epochs, the signals could be considered at least as wide-sense
stationary processes. The use of time-frequency distributions
does not limit the resolution that can be acquired and does
not require any hypothesis on the nature of the NIRS signals.
We processed our data by using a 102.4 seconds time window,
but we found that the spectral resolution was too poor to
distinguish the VLF from the LF band. Therefore, the PCA
analysis was insensible to pathology and resulted in a mixed
representation.
One of the encountered problems is represented by the
slow trends the concentrations signals show during time.
Often, in correspondence of the stimulus, relatively big and
fast (see Figure 1(a)) or slow (see Figure 1(b)) trends can
be observed on the signals. Such trends might mask the
VLF band and make the frequency analysis little reliable. We
found a great variability of such trends among subjects. We
tried three different detrending techniques: (i) the 3rd order
polynomial detrending, (ii) the smoothness priors method
proposed by Tarvainen et al. [31], and (iii) the traditional
high-pass filtering. We found that polynomial detrending
was not suitable to our data, since for trends generated by
HYP it was sufficient an order equal to 3, but for the abrupt
trends of caused by the end of the BH, an order of 5 or more
was required. The smoothness priors method was developed
for heart rate variability analysis [31] and it implements an
automated high-pass-like filter. However, the resulting filter
possessed a too high cutoff frequency that attenuated almost
completely the VLF band. Therefore, we used a Chebychev
type ARMA filter and kept the detrending strategy equal for
all the subjects and all the events.
We computed the time-frequency SCF between the O
2
Hb
and HHb signals. Figure 6 reports an example of SCF
computed during the BH of a MwA patient. The SCF
is represented by level curves; the white spots mark the
time instants and the frequency values for which there is
coherence between the O
2
Hb and HHb signals. In our study,
the SCF value was never significant after a stimulus, but only
before HYP and only in the VLF band. The coherence value
of the VLF band before HYP dominates the third component
of the PCA (see Figure 3 lower panel and Tab le 2 ). This
coherence value is slightly higher in MwA than in MwoA
and control subjects (Figure 3, lower panel). Further work
is required in order to validate the importance of the
coherence in pathologic versus healthy NIRS recordings.
However, this paper is the first attempt of bringing the time-
frequency analysis of coherence in NIRS signals into a clinical
evaluation protocol.
Finally, the computational cost of our time-frequency
implementation is of about 5 seconds for a 512 points signal
epoch (Matlab 7.04 running on a 2.5 GHz dual-G5 Apple
PowerPc equipped by 8 GB of RAM). Therefore, considered
that the experimental protocols lasts slightly less than 10
minutes, our analysis procedure can be carried out in real-
time. The herein proposed time-frequency methodology is
currently under testing in the Department of Neuroscience
of the Gradenigo Hospital of Torino, Italy.
5. Conclusion
The time-frequency-based analysis of NIRS signals during
active maneuvers allowed for the high-resolution quantifi-
cation of the signals power in the VLF and LF bands.
Such values demonstrated a neat difference in the cerebral
EURASIP Journal on Advances in Signal Processing 9
hemodynamics of migraine sufferers with and without aura.
Particularly, MwoA sufferers are characterized by low power
of the LF band when performing breath-holding, whereas
MwA subjects shows higher values.
Our study showed that the time-frequency analysis of
these signals is crucial if the assessment of cerebral hemody-
namics is the clinical issue. In fact, traditional spectral anal-
ysis makes such assessment impossible due scarce spectral
resolution coupled to the effects of signals’ nonstationarity.
This time-frequency-based methodology is a first
attempt of bringing the spectral analysis of NIRS signals into
a clinical application and it is currently under validation.
We are now improving our methodology by considering
possible system nonlinearities and higher-order statistics
analysis tools.
Abbreviations
NIRS: Near-InfraRed Spectroscopy
BH: Breath-Holding
HYP: HYPerventilation
O
2
Hb: Oxygenated hemoglobin
HHb: Reduced (deoxygenated) Hemoglobin
CW: Choi-Williams time-frequency transform
SCF: Squared Coherence Function
LF: Low Frequency oscillations
VLF: Very Low Frequency oscillations
MwA: Migraine with Aura
MwoA: Mirgaine without Aura.
Acknowledgment
The authors would like to thank Dr. Gianfranco Grippi
(Department of Neuroscience, Gradenigo Hospital, Torino,
Italy) for the support in the transcranial Doppler assessment
of the subjects.
References
[1] R. B. Panerai, “Cerebral autoregulation: from models to
clinical applications,” Cardiovascular Engineering, vol. 8, no. 1,
pp. 42–59, 2008.
[2] M. Daffertshofer and M. Hennerici, “Cerebrovascular regu-
lation and vasoneuronal coupling,” Journal of Clinical Ultra-
sound, vol. 23, no. 2, pp. 125–138, 1995.
[3] W. Rudzi
´
nski, M. Swiat, M. Tomaszewski, and J. Krejza,
“Cerebral hemodynamics and investigations of cerebral blood
flow regulation,” Nuclear Medicine Review,vol.10,no.1,pp.
29–42, 2007.
[4] R. Aaslid, “Cerebral autoregulation and vasomotor reactivity,”
Frontiers of Neurology and Neuroscience, vol. 21, pp. 216–228,
2006.
[5] P. N. Ainslie and J. Duffin, “Integration of cerebrovascu-
lar CO
2
reactivity and chemoreflex control of breathing:
mechanisms of regulation, measurement, and interpretation,”
American Journal of Physiology, vol. 296, no. 5, pp. R1473–
R1495, 2009.
[6] V. C. Urrutia and R. J. Wityk, “Blood pressure management in
acute stroke,” Neurologic Clinics, vol. 26, no. 2, pp. 565–583,
2008.
[7] R. Aaslid, T. M. Markwalder, and H. Nornes, “Noninvasive
transcranial Doppler ultrasound recording of flow velocity in
basal cerebral arteries,” Journal of Neurosurgery,vol.57,no.6,
pp. 769–774, 1982.
[8] W. Liboni, G. Allais, O. Mana et al., “Transcranial Doppler for
monitoring the cerebral blood flow dynamics: normal ranges
in the Italian female population,” Panminerva Medica, vol. 48,
no. 3, pp. 187–191, 2006.
[9] D. A. Benaron, S. R. Hintz, A. Villringer et al., “Noninvasive
functional imaging of human brain using light,” Journal of
Cerebral Blood Flow and Metabolism, vol. 20, no. 3, pp. 469–
477, 2000.
[10] M. Firbank, E. Okada, and D. T. Delpy, “Investigation of the
effect of discrete absorbers upon the measurement of blood
volume with near-infrared spectroscopy,” Physics in Medicine
and Biology, vol. 42, no. 3, pp. 465–477, 1997.
[11] A. Kastrup, T Q. Li, G. H. Glover, and M. E. Moseley,
“Cerebral blood flow-related signal changes during breath-
holding,” American Journal of Neuroradiology, vol. 20, no. 7,
pp. 1233–1238, 1999.
[12] W. Liboni, F. Molinari, G. Allais et al., “Why do we need NIRS
in migraine?” Neurological Sciences, vol. 28, no. 2, pp. S222–
S224, 2007.
[13] H. Obrig, R. Wenzel, M. Kohl et al., “Near-infrared spec-
troscopy: does it function in functional activation studies of
the adult brain?” International Journal of Psychophysiology, vol.
35, no. 2-3, pp. 125–142, 2000.
[14] F. Molinari, W. Liboni, G. Grippi, and E. Negri, “Relationship
between oxygen supply and cerebral blood flow assessed
by transcranial Doppler and near-infrared spectroscopy in
healthy subjects during breath-holding,” Journal of NeuroEngi-
neering and Rehabilitation, vol. 3, article no. 16, 2006.
[15] A. Piepgras, P. Schmiedek, G. Leinsinger, R. L. Haberl, C.
M. Kirsch, and K. M. Einhaupl, “A simple test to assess
cerebrovascular reserve capacity using transcranial Doppler
sonography and acetazolamide,” Stroke,vol.21,no.9,pp.
1306–1311, 1990.
[16] E. B. Ringelstein, S. Van Eyck, and I. Mertens, “Evaluation of
cerebral vasomotor reactivity by various vasodilating stimuli:
comparison of CO
2
to acetazolamide,” Journal of Cerebral
Blood Flow and Metabolism, vol. 12, no. 1, pp. 162–168, 1992.
[17] M. S. V. Elkind and A. I. Scher, “Migraine and cognitive
function: some reassuring news,” Neurology,vol.64,no.4,pp.
590–591, 2005.
[18]M.C.Kruit,M.A.vanBuchem,P.A.M.Hofmanetal.,
“Migraine as a risk factor for subclinical brain lesions,” Journal
of the American Medical Association, vol. 291, no. 4, pp. 427–
434, 2004.
[19] G. E. Tietjen, “Migraine as a systemic vasculopathy,” Cephalal-
gia, vol. 29, no. 9, pp. 989–996, 2009.
[20] F. Vernieri, F. Tibuzzi, P. Pasqualetti et al., “Increased cerebral
vasomotor reactivity in migraine with aura: an autoregu-
lation disorder? A transcranial Doppler and near-infrared
spectroscopy study,” Cephalalgia, vol. 28, no. 7, pp. 689–695,
2008.
[21] H. Obrig, M. Neufang, R. Wenzel et al., “Spontaneous
low frequency oscillations of cerebral hemodynamics and
metabolism in human adults,” NeuroImage,vol.12,no.6,pp.
623–639, 2000.
[22] U. Sliwka, S. Harscher, R. R. Diehl, R. van Schayck, W. D.
Niesen, and C. Weiller, “Spontaneous oscillations in cerebral
blood flow velocity give evidence of different autonomic
dysfunctions in various types of headache,” Headache, vol. 41,
no. 2, pp. 157–163, 2001.
10 EURASIP Journal on Advances in Signal Processing
[23] A. Duncan, J. H. Meek, M. Clemence et al., “Optical path-
length measurements on adult head, calf and forearm and
the head of the newborn infant using phase resolved optical
spectroscopy,” Physics in Medicine and Biology, vol. 40, no. 2,
pp. 295–304, 1995.
[24] T. S. Leung, I. Tachtsidis, M. Smith, D. T. Delpy, and C. E.
Elwell, “Measurement of the absolute optical properties and
cerebral blood volume of the adult human head with hybrid
differential and spatially resolved spectroscopy,” Physics in
Medicine and Biology, vol. 51, no. 3, pp. 703–717, 2006.
[25] E. Okada, M. Firbank, M. Schweiger, S. R. Arridge, M. Cope,
and D. T. Delpy, “Theoretical and experimental investigation
of near-infrared light propagation in a model of the adult
head,” Applied Optics, vol. 36, no. 1, pp. 21–31, 1997.
[26] L. Cohen, Time-Frequency Analysis, Prentice-Hall, New York,
NY, USA, 1995.
[27] H. Choi and W. J. Williams, “Improved time-frequency
representation of multicomponent signals using exponential
kernels,” IEEE Transactions on Acoustics, Speech, and Signal
Processing, vol. 37, no. 6, pp. 862–871, 1989.
[28] W. Liboni, F. Molinari, G. Allais et al., “Spectral changes of
near-infrared spectroscopy signals in migraineurs with aura
reveal an impaired carbon dioxide-regulatory mechanism,”
Neurological Sciences, vol. 30, no. 1, pp. S105–S107, 2009.
[29] “Classification and diagnostic criteria for headache disorders,
cranial neuralgias and facial pain. Headache Classification
Committee of the International Headache Society,” Cephalal-
gia, vol. 8, supplement 7, pp. 1–96, 1988.
[30] F. Vernieri, F. Tibuzzi, P. Pasqualetti et al., “Transcranial
Doppler and near-infrared spectroscopy can evaluate the
hemodynamic effect of carotid artery occlusion,” Stroke, vol.
35, no. 1, pp. 64–70, 2004.
[31] M. P. Tarvainen, P. O. Ranta-aho, and P. A. Karjalainen,
“An advanced detrending method with application to HRV
analysis,” IEEE Transactions on Biomedical Engineering, vol. 49,
no. 2, pp. 172–175, 2002.