Báo cáo hóa học: " Research Article Experimental Characterization of a UWB Channel for Body Area Networks" potx
Bạn đang xem bản rút gọn của tài liệu. Xem và tải ngay bản đầy đủ của tài liệu tại đây (2.23 MB, 11 trang )
Hindawi Publishing Corporation
EURASIP Journal on Wireless Communications and Networking
Volume 2011, Article ID 703239, 11 pages
doi:10.1155/2011/703239
Research Article
Experimental Characterization of a UWB Channel for
Body Area Networks
Lingli Xia, Stephen Redfield, and Patrick Chiang
VLSI Research Group, Oregon State University, Corvallis, OR, 97331, USA
Correspondence should be addressed to Lingli Xia,
Received 28 October 2010; Accepted 14 January 2011
Academic Editor: Philippe De Doncker
Copyright © 2011 Lingli Xia et al. This is an open access article distributed under the Creative Commons Attribution License,
which permits unrestricted use, distribution, and reproduction in any medium, provided the original work is properly cited.
Ultrawideband (UWB) communication is a promising technology for wireless body area networks (BANs), especially for
applications that require transmission of both low and high data rates with excellent energy efficiency. Therefore, understanding
the unique UWB channel propagation characteristics around the human body is critical for a successful wireless system, especially
for insuring the reliability of important vital sign data. Previous work has focused only on on-body channels, where both TX and
RX antennas are located on the human body. In this paper, a 3–5 GHz UWB channel is measured and analyzed for human body
wireless communications. Beyond the conventional on-body channel model, line-of-sight (LOS) and non-line-of-sight (NLOS)
channel models are obtained using a TX antenna placed at various locations of the human body while the RX antenna is placed
away from the human body. Measurement results indicate that the human body does not significantly degrade the impedance of a
monopole omnidirectional antenna. The measured path loss and multipath analysis suggest that a LOS UWB channel is excellent
for low-power, high-data-rate transmission, while NLOS and on-body channels need to be reconfigured to operate at a lower data
rateduetohighpathloss.
1. Introduction
Recently, there has been an increased interest in using body
area networks (BANs) for health monitoring [1–7]. A variety
of physiological electrical signals from the human body
can be continuously monitored wirelessly, including brain
waves (EEG or electroencephalography), heart health (ECG
or electrocardiography), and muscle response (EMG or
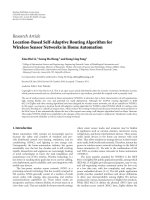
electromyography). For a real-time vital sign monitoring
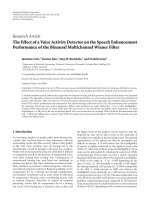
system [1], as shown in Figure 1(a), a single (or multiple)
wearable sensor node with a wireless transmitter is attached
to a patient, while the receiver is attached to some nearby
fixed location (i.e., wrist watch or ceiling). The sensor
captures the real-time physiological signals, activating the
transmitter that sends a low-data-rate signal to the receiver
alerting a remote clinician through cellular or internet
networks. Through this wireless body sensor network,
disease prevention can be improved with this continuous
real-time diagnosis, thus reducing the onset of degenerative
diseases and healthcare costs.
A high data rate is not typically an important concern
for body area networks, as sampling frequencies of front-
end sensors is typically less than 1 kHz. For example, a
heart reading using ECG requires at most 12 kbps or 12 b
at 1 kHz. However, for body sensor applications that require
tens or hundreds of sensing channels [2], a large bandwidth
is necessary. One example is a handheld, wireless ultrasound
module with hundreds of ADC channels, which need to
send several megabits of data. Another example is in next-
generation brain implants, which will require hundreds of
cortical implant channels streamed wirelessly to a stationary
receiver [3]. This large communication bandwidth will also
be needed for an application where BAN data may firstly
be stored locally on the sensor node, such as in a local
data storage memory. Then when the patient goes to the
hospital, the doctor can read these data through high-data-
rate transmission and make a thorough diagnosis, as shown
in Figure 1(b).
Traditional narrowband wireless protocols, such as MICS
(medical implant communications service), Zigbee, ISM,
2 EURASIP Journal on Wireless Communications and Networking
Hospital
TX
RX
(a)
TX
RX
(b)
Figure 1: Body area networks for health monitoring: (a) low-data-rate transmission (b) high-data-rate transmission.
Table 1: LOS measurement results comparison.
cc1101 cc1101 cc2500 This work
Frequency 433 MHz 868 MHz 2.4 GHz 3–5 GHz
Data rate 0.6
∼600 kbps 0.6∼600 kbps 1.2∼500 kbps 1∼100 Mbps
Power consumption
TX 48 mW at 0 dBm 50.4 mW at 0 dBm 63.6 mW at 0 dBm 4.44 mW at
−41.3 dBm/MHz
RX 45
∼51.3 mW 43.8∼50.7 mW 39.9∼58.8 mW 13.2 mW
BER at RSSI 0.2% at
−51 dBm 0.1% at −63 dBm <0.1% at −64 dBm 1% at −50 dBm
Antenna size Large Medium Small Medium
and Bluetooth standards [4, 5], suffer from large power
consumption and low data rate, as listed in Ta ble 1 .
Unlike these traditional narrowband systems, ultrawideband
(UWB) wireless sensors operate with a large bandwidth (3.1–
10.6 GHz) and a low maximum transmission spectral density
(
−41.3 dBm/MHz). According to Shannon-Hartley theorem,
with an ultra-wide bandwidth, high data rate can be achieved
with low transmitted power in UWB.
Power consumption is also a critical requirement for
body area networks, as patients may choose to not adopt such
body sensors if the sensors need to be recharged frequently.
Furthermore, low power consumption results in a smaller
battery size, significantly reducing sensor cost and form
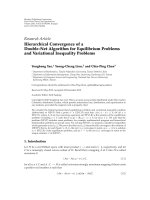
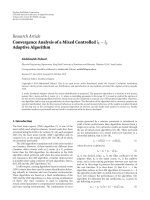
factor. Consider a 3–5 GHz impulse radio UWB (IR-UWB)
transceiver that we developed, shown in Figure 2.AnIR-
UWB transceiver does not require DAC, PLL, or PA. Here
the transmitter consists of only a pulse generator, an output
buffer, and a power control block [8]. A configurable data
rate can be easily realized by changing the pulse repetition
rate. The duty-cycled characteristic of the transmitted signals
is employed to turn off the output buffer during pulses inter-
vals, further lowering the power consumption. Measurement
results show that the power consumption of the transmitter
is only 400 μW and 4.44 mW with data rates of 1 Mbps and
100 Mbps, respectively. Meanwhile, the receiver employs a
noncoherent architecture, consuming 13.2 mW with a data
rate of 100 Mbps. Tab le 1 summarizes the measurement
results of the proposed UWB transceiver and two off-the-
shelf chips (TI cc1101 and TI cc2500).
Knowledge of the channel model for UWB transmission
is critical for any robust transceiver system. Moreover, body
area networks exhibit unique radio propagation charac-
teristics combining line of sight, creeping wave, multiple
reflections from surrounding environments, and diffraction
around the human body. Ever since the FCC released
unlicensed spectrum for UWB, several previous works on
UWB channel modeling have been published. Molisch et al.
[9] developed an IEEE 802.15.4a channel model for various
low-rate UWB applications, where the body area network
channel model is analyzed using a finite difference time-
domain (FDTD) simulator with antennas moving around
the human body. Wang et al. [10] also used FDTD method
to simulate various body postures based on a realistic human
body model. Unfortunately, these numerical approaches
neglect considerations of the surrounding environments,
which are the main sources of multipath.
Furthermore, the previous investigations only considered
data transmission with both TX and RX antennas on the
human body, which is not the dominant usage model. In
this paper, we present a complete UWB channel model
that not only considers on-body UWB propagation but also
extends to include LOS and NLOS channel measurement,
using a TX antenna placed on the human body and a
separate RX antenna located externally. Section 2 introduces
EURASIP Journal on Wireless Communications and Networking 3
DC offset cancellation
Correlator
PGA LPF
Comparator
Baseband
LNA
Sync
Output buffer
Pulse
Generator
Power control
RX
TX
Tx/Rx
RX data
RX clk
clkin
FreqCtrl
BBin
Sync
PGA
Output
buffer
Pulse
generator
Comparator
LNA and balun
Figure 2: Impulse radio UWB transceiver architecture.
TX RX
Pulse
generator
Oscilloscope
Figure 3: Time-domain measurement setup.
the measurement setup of this work, Section 3 discusses the
measurement results and provides a thorough analysis on
different channels, and Section 4 draws a conclusion.
2. Measurement Setup
In this work, the UWB radio channel measurement is
performed in an EM-shielded lab with a height of 3.5 m.
The lab resembles an ordinary room with concrete walls,
ceiling, desks, and chairs. When the door is closed, the
lab is protected from EM interferences by metallic panels
behind the walls and ceiling. This enables accurate estimation
of local multipath propagation, with sufficient interference
rejection.
Channel measurements can be conducted in the time
domain based on impulse transmission or the frequency
domain using a frequency sweep technique [11]. In the
former setup, as shown in Figure 3, UWB impulses are
generated by a pulse generator and transmitted through
an antenna. After wireless propagation, the impulses are
received by an RX antenna and sampled by an oscilloscope,
where subsequent time-domain algorithms are performed
in order to calculate the path loss and power delay profile
(PDP) [12]. In the latter setup, a vector network analyzer
(VNA) is employed that captures the frequency response of
the UWB channel as a S21 parameter, followed by generation
of a channel impulse response (CIR) in the time domain,
obtained by performing an inverse Fourier transform (IFT).
In this work, a VNA-based measurement setup is employed.
The VNA (HP 8520ES) is used to capture 1061 data
points between 3 and 5 GHz, providing a frequency-domain
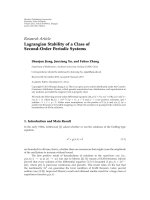
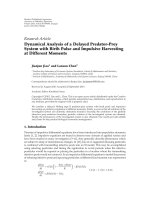
resolution of 1.25 MHz. As shown in Figure 4, the following
three conditions are measured.
(a) Line-of-Sight. There is no object obstructing the TX and
RX antennas. The TX antenna is placed on the head, chest,
and left thigh of the human body while the RX antenna is
placed at the same height off the human body.
4 EURASIP Journal on Wireless Communications and Networking
166 cm
120 cm
70 cm
150 cm
Wall
RXTX
(a)
RX TX
(b)
RX
(c)
Figure 4: Frequency-domain measurement setup: (a) line-of-sight; (b) non-line-of-sight; (c) on-body.
−80
−70
−60
−50
−40
−30
−20
−10
S11 magnitude (dB)
33.544.55
Frequency (GHz)
50 Ohms load
Antenna at free space
Antenna at head
Antenna at chest
Antenna at thigh
Figure 5: Measured return loss of the antenna.
(b) Non-Line-of-Sight. The transmission between the TX
and RX antennas is interrupted by the human body.
(c) On-Body. Both TX and RX antennas are placed on the
human body. The RX antenna is worn on the left wrist while
the TX antenna is able to freely move around.
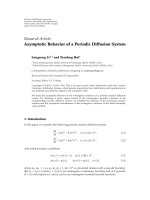
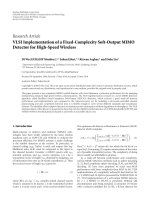
The antennas used in the measurement are monopole
omnidirectional antennas from 3–5 GHz, manufactured by
Fractus Corporation. Calibration is performed to eliminate
the loss of the cables and connectors. The measured antenna
return loss (on and off the human body) is shown in Figure 5.
As observed, the antenna shows excellent impedance match-
ing on and off the human body with the return loss
(S11) below
−10 dB across the entire 3–5 GHz. Note that
the antenna return loss near the human body is different
from free space, as the antenna characteristic impedance is
changed by the high dielectric permittivity and conductivity
of the human body tissues [13].
3. UWB Radio Channel Measurement Results
3.1. Propagation Path Loss
3.1.1. Frequency Dependence. Path loss is the reduction in
power as the transmitted signal propagates through space.
According to Friis’s transmission equation, the path loss is
L
=
4πf
c
d
n
,(1)
where c is the speed of light, d is the distance between
the TX and RX antennas, and n is the path loss exponent,
whose value is normally 2 for propagation in free space.
While the frequency dependence of the path loss is usually
ignored in narrow band systems, it cannot be ignored in
UWB systems due to the large bandwidth. Figure 6(a) shows
the measured S21 of the channel when the distance d is
3 cm (the calculated free space frequency-dependent loss is
also plotted as a comparison). As observed, the frequency
response of the LOS channel is different from free space
transmission because of the absorption and reflection off of
the human tissue, as well as the surrounding environments
which are also frequency dependent. As the transmission
distance extends to 1 m, the multipath signals increase, such
that the LOS path loss is less than the free space path
loss, as shown in Figure 6(b). Figure 6(c) shows that for the
measured S21 of a 1 m NLOS channel, the path loss is greatly
worsened, as the UWB signal is unable to transmit through
the human body. In this NLOS situation, the measured
received power comes predominantly from the reflections of
the surrounding environments and the diffracted signal from
the human body. Finally, on-body channel characteristics are
also measured, as in Figure 6(d), showing that the left wrist to
right thigh channel exhibits larger path loss than left wrist to
left thigh channel, as the transmission distance is increased.
EURASIP Journal on Wireless Communications and Networking 5
−22
−20
−18
−16
−14
−12
−10
S21 magnitude (dB)
33.544.55
Frequency (GHz)
Free space
Head LOS
Chest LOS
Thigh LOS
(a)
−60
−55
−50
−45
−40
−35
−30
S21 magnitude (dB)
33.544.55
Frequency (GHz)
Free space
Head LOS
Chest LOS
Thigh LOS
(b)
−75
−70
−65
−60
−55
−50
−45
−40
−35
S21 magnitude (dB)
33.544.55
Frequency (GHz)
Free space
Head NLOS
Chest NLOS
Thigh NLOS
(c)
−70
−65
−60
−55
−50
−45
−40
−35
S21 magnitude (dB)
33.544.55
Frequency (GHz)
Left wrist to left thigh
Left wrist to right thigh
(d)
Figure 6: Frequency-dependent characteristics of UWB channel: (a) LOS at 3 cm; (b) LOS at 1 m; (c) NLOS at 1 m; (d) on-body channel.
3.1.2. Distance D ependence. Path loss (dB) is typically
expressed as
PL
(
d
)
= PL
(
d
0
)
+10
·n ·log
d
d
0
+ χ,(2)
where d
0
is a reference distance and χ is a random vari-
able with a zero-mean Gaussian distribution. In order to
eliminate the impact of frequency, the distance-dependent
path loss is obtained by averaging the measured frequency
response [15]:
PL
(
d
)
= 10 log
⎛
⎝
1
N
N
i=1
H
f
i
, d
2
⎞
⎠
,(3)
where N is the number of the swept frequency points
and H( f
i
, d) is the frequency response S21 of the channel
measured by a VNA. In Figure 7(a), a linear regression fit
is performed in order to calculate the path loss exponent
n in a LOS channel measurement. The far-field path loss
exponent in this work is different from the previous works
[9, 10, 14, 16, 17], because only the TX antenna is put on
the human body and the reflective environments are also
considered in this LOS measurement setup. Tab le 2 lists the
measured results and the comparison with previous works.
The standard deviation of the normal distribution χ is also
calculated in order to improve the accuracy of (2), as shown
in Figure 7(b). Figure 7(c) shows the distance-dependent
path loss in an NLOS measurement. The NLOS channel path
6 EURASIP Journal on Wireless Communications and Networking
5
10
15
20
25
30
35
40
45
Path loss (dB)
10
0
10
1
10
2
Distance (d/d
0
)
Head LOS
Linear regression model
Chest LOS
Linear regression model
Thigh LOS
Linear regression model
(a)
0
0.1
0.2
0.3
0.4
0.5
0.6
0.7
0.8
0.9
1
Cumulative probability
−10 −50 510
15
Power (relative to mean path loss) (dB)
Head LOS
Normal fit σ
= 8.3
Chest LOS
Normal fit σ
= 7.6
Thigh LOS
Normal fit σ
= 9.1
(b)
44
45
46
47
48
49
Path loss (dB)
40 50 60 70 80 90 100
Distance (cm)
Head NLOS
Chest NLOS
Thigh NLOS
(c)
Figure 7: Distance-dependent path loss: (a) LOS path loss; (b) cumulative probability of far-field LOS path loss; (c) NLOS path loss.
loss does not show a linear-logarithmic characteristic as the
LOS channel; instead, the path loss changes slightly as the
distance extends. The reason is that when the human body
interrupts with the transmission channel, the area of the
human body that interrupts the signal becomes small relative
to the distance between the antennas, such that the diffracted
signal becomes stronger [18]. Note that the path loss of the
on-body channel is much larger than the LOS channel and
comparable with that of the NLOS channel, as can be seen in
Ta bl e 3 .
3.2. RMS D elay Spread. The power delay profile shows the
received signal power as a function of time delay, giving an
intuitive inspection of the multipath channel. Power delay
profile can be obtained by implementing an IFT on the
measured data:
PDP
= 20 log|h
(
t
)
|=20 log
N−1
k=0
Δ f · H
k · Δ f
·e
j2πkn/N
,
(4)
EURASIP Journal on Wireless Communications and Networking 7
−120
−110
−100
−90
−80
−70
−60
−50
−40
Power delay profile (dB)
0 10203040
Time delay (ns)
(2.2ns,
−41.55 dB)
(a)
−120
−110
−100
−90
−80
−70
−60
Power delay profile (dB)
010203040
Time delay (ns)
(2.6ns,
−71.12 dB)
(b)
−120
−110
−100
−90
−80
−70
−60
−50
Power delay profile (dB)
010203040
Time delay (ns)
(4 ns,
−48.92 dB)
(c)
−120
−110
−100
−90
−80
−70
−60
Power delay profile (dB)
010203040
Time delay (ns)
(4.4ns,
−74.4dB)
(d)
Figure 8: Power delay profile when placing TX antenna on the chest: (a) LOS at 50 cm; (b) NLOS at 50 cm; (c) LOS at 1 m; (d) NLOS at 1 m.
Table 2: Comparison of parameter values for distance-dependent path loss model.
Position Near-field n Far-field n Far-field σ Far-field fit
This work
Head 0.27 1.78 8.3
Normal
Chest 0.93 1.82 7.6
Muscle 0.37 1.87 9.1
[9]
Torso front — 1.08 4.7
Lognormal
Torso side — 1.08 6.3
Torso back — 1.08 6.3
[14] (multiantenna)
Torso front — 1.26 3.87 (tap 1)
Lognormal
Torso back — 1.26 5.64 (tap 1)
where h(t) is the UWB channel impulse response (CIR) in
the time domain and H( f ) is the measured UWB channel
frequency response. Hermitian signal processing is employed
to obtain a real-valued CIR by zero padding the lowest
frequency down to DC, taking the conjugate of the signal,
and reflecting it to the negative frequency [19]. Figure 8
shows the power delay profile of both LOS and NLOS
channels after placing the TX antenna on the chest. As
observed, the received power is greatly reduced due to
the LOS interruption caused by the human body within
8 EURASIP Journal on Wireless Communications and Networking
10
0
10
1
10
2
10
3
Mean number of significant paths
51015202530
Threshold (dB)
Head LOS
Chest LOS
Thigh LOS
Head NLOS
Chest NLOS
Thigh NLOS
(a)
10
−2
10
−1
10
0
10
1
10
2
Mean RMS delay (ns)
51015202530
Threshold (dB)
Head LOS
Chest LOS
Thigh LOS
Head NLOS
Chest NLOS
Thigh NLOS
(b)
10
0
10
1
10
2
10
3
Mean number of significant paths
5101520
Threshold (dB)
Left wrist to head
Left wrist to chest
Leftwirsttoleftthigh
Left wirst to right thigh
(c)
10
−1
10
0
10
1
10
2
Mean RMS delay (ns)
5101520
Threshold (dB)
Left wrist to head
Left wrist to chest
Leftwirsttoleftthigh
Left wirst to right thigh
(d)
Figure 9: Mean RMS delay spread versus threshold: (a) multipath number at 1 m; (b) RMS delay time at 1 m; (c) multipath number at
on-body channel; (d) RMS delay time at on-body channel.
Table 3: Path loss of on-body channels.
Left wrist to Head Chest Left thigh Right thigh
distance (cm) 85 45 20 40
path loss (dB) 51.4 49.4 45.5 49.4
the NLOS channel. However, because of the diffraction
around the human body, the RX antenna still captures some
detectable power at delay times of 2.6 ns and 4.4 ns in the
NLOS channel at distances of 50 cm and 1 m, respectively.
Another important phenomenon is that in a LOS channel,
the received direct path power reduces by 7.4 dB when the
distance extends from 50 cm to 1 m. In an NLOS channel,
the received diffracted power reduces by only 3.3 dB. This
manifestation occurs because the area of the interruption
caused by the human body becomes relatively smaller as
the distance is increased, coinciding with the results of
Figure 7(c).
Delay spread is a measure of the multipath density
within a wireless channel and an important characteristic
when comparing between different channels. Mean delay
EURASIP Journal on Wireless Communications and Networking 9
0
0.1
0.2
0.3
0.4
0.5
0.6
0.7
0.8
0.9
1
Cumulative probability
0.51−0.52
RMS delay (ns)
Head LOS
Lognormal fit
Chest LOS
Lognormal fit
Thigh LOS
Lognormal fit
(a)
0
0.2
0.4
0.6
0.8
1
Cumulative probability
10 15 20 25 30
RMS delay (ns)
Head NLOS
Lognormal fit
Chest NLOS
Lognormal fit
Thigh NLOS
Lognormal fit
(b)
0
0.2
0.4
0.6
0.8
1
Cumulative probability
2345
RMS delay (ns)
On-body
Lognormal fit
μ
= 1.01 dB
σ
= 0.43 dB
(c)
Figure 10: Cumulative probability of the RMS delay spread fitted to lognormal delay with 20 dB threshold (a) LOS (b) NLOS (c) on-body.
spread, RMS delay spread, and maximum delay spread are
three multipath channel parameters that can be determined
from the power delay profile [20]. Mean delay spread is the
average delay weighted by power:
τ =
k
a
2
k
τ
k
k
a
2
k
=
k
P
(
τ
k
)
τ
k
k
P
(
τ
k
)
,(5)
where a
k
is the amplitude of the received signal and τ
k
is
the delay relative to the first detectable signal at the receiver.
RMS delay spread is the energy-weighted standard deviation
of the signal delays:
τ
rms
=
τ
2
−
(
τ
)
2
=
k
a
2
k
τ
2
k
k
a
2
k
−
k
a
2
k
τ
k
k
a
2
k
2
. (6)
Maximum delay spread is the time difference between the
arrival of the first and last significant signals. Among these,
RMS delay spread is the most commonly used parameter
because of its effect on the bit error rate and maximum
data rate. Figure 9 shows the relationship between RMS
10 EURASIP Journal on Wireless Communications and Networking
Table 4: Lognormal fitting model of the RMS delay spread.
Head Chest Thigh
μ
dB
σ
dB
μ
dB
σ
dB
μ
dB
σ
dB
LOS
Threshold (dB)
20
−0.89 0.63 −1.01 0.35 −1.15 0.46
30 0.15 1.08
−0.01 0.89 −0.13 1.03
NLOS
Threshold (dB)
10 1.79 0.33
−0.40 1.24 0.89 0.38
20 2.95 0.16 2.78 0.18 2.53 0.20
delay spread and the minimum detectable power threshold
for a 1 m transmission distance. As observed, the number
of significant paths increases exponentially with the power
threshold in LOS, NLOS, and on-body channels. However
RMS delay time does not show the same characteristic, as
the contribution of newly detected paths declines as the
threshold increases [21]. An NLOS channel suffers more
severe multipath effect and larger RMS delay spread than a
LOS channel because of the interruption of the human body.
Figures 9(c) and 9(d) show on-body channel measurement
results with both TX and RX antennas placed on the human
body. The multipath number and RMS delay time in a left
wrist to left thigh channel are less than those in a left wrist
to right thigh channel in low threshold detection because of
the shorter transmission distance. However, the RMS delay
spread is less significant as the threshold increases. This phe-
nomenon is likely because both of these two channels share
the same surrounding environments, for example, the same
distance away from the floor. The cumulative probability of
the RMS delay spread with a threshold of 20 dB is shown
in Figure 10. Ta bl e 4 summarizes the average value and the
standard deviation (μ and σ) of the lognormal fitting model.
4. Conclusion
Ultrawideband communication is a promising technology
for next generation body sensor networks due to its potential
for both low power and large bandwidth, currently unavail-
able using conventional narrowband systems. In this paper,
both line-of-sight (LOS) and non-line-of-sight (NLOS)
channels with various TX and RX antennas placed near
the human are characterized. The frequency- and distance-
dependent characteristics of a UWB channel are analyzed in
this paper, where an NLOS channel is shown to have larger
path loss than a LOS channel due to the physical interruption
of the human body. Moreover, the path loss of an on-body
channel is comparable with an NLOS channel. RMS delay
spread is presented which provides an intuitive inspection of
the multipath richness of a variety of channels. According
to the experimental and analytical results, UWB systems
with high data rate will require LOS channel characteristics.
For sensor network application where only low-data-rate
transmission is needed, NLOS and on-body channels can
exhibit good performance using UWB.
References
[1] J. Pan, “Medical applications of ultra-wideband (UWB),”
/>∼jain/cse574-08/ftp/uwb/index.
html.
[2] M. Milanesi, N. Martini, N. Vanello et al., “Multichannel tech-
niques for motion artifacts removal from electrocardiographic
signals,” in Proceedings of the 28th Annual International
Conference of the IEEE Engineering in Medicine and Biology
Society (EMBS ’06), pp. 3391–3394, September 2006.
[3] H. Miranda, V. Gilja, C. A. Chestek, K. V. Shenoy, and T. H.
Meng, “HermesD: a high-rate long-range wireless transmis-
sion system for simultaneous multichannel neural recording
applications,” IEEE Transactions on Biomedical Circuits and
Systems, vol. 4, no. 3, pp. 181–191, 2010.
[4] B. Yu, L. Yang, and C C. Chong, “ECG monitoring over
bluetooth: data compression and transmission,” in Proceedings
of IEEE Wireless Communications and Networking Conference
(WCNC ’10), 2010.
[5]M.R.Yuce,S.W.P.Ng,N.L.Myo,C.K.Lee,J.Y.Khan,
and W. Liu, “A MICS band wireless body sensor network,” in
Proceedings of IEEE Wireless Communications and Networking
Conference (WCNC ’07), pp. 2475–2480, 2007.
[6] A. Khaleghi, R. Ch
´
avez-Santiago, and I. Balasingham, “Ultra-
wideband pulse-based data communications for medical
implants,” IET Communications, vol. 4, no. 15, pp. 1889–1897,
2010.
[7] T. Nakagawa, G. Ono, R. Fujiwara, T. Norimatsu, T. Ter-
ada, and M. Miyazaki, “Fully integrated UWB-IR CMOS
transceiver for wireless body area networks,” in Proceedings
of IEEE International Conference on Ultra-Wideband (ICUWB
’09), pp. 768–772, September 2009.
[8] L. Xia, Y. Huang, and Z. Hong, “Low power amplitude and
spectrum tunable IR-UWB transmitter,” Electronics Letters,
vol. 44, no. 20, pp. 1200–1201, 2008.
[9] A. F. Molisch et al., “IEEE 802.15.4a channel model—final
report,” IEEE 802.15.04-0662-01-004a, Novemebr 2004.
[10] Q. Wang, T. Tayamachi, I. Kimura, and J. Wang, “An on-
body channel model for UWB body area communications
for various postures,” IEEE Transactions on Antennas and
Propagation, vol. 57, no. 4, pp. 991–998, 2009.
[11] M. Hamalainen, T. Patsi, and V. Hovinen, “Ultra wideband
indoor radio channel measurements,” u.fi/.
[12] Y. Chen, J. Teo, J. Lai et al., “Cooperative communications
in ultra-wideband wireless body area networks: channel
modeling and system diversity analysis,” IEEE Journal on
Selected Areas in Communications, vol. 27, no. 1, Article ID
4740881, pp. 5–16, 2009.
[13] A. Khaleghi and I. Balasingham, “Non-line-of-sight on-body
ultra wideband (1–6 GHz) channel characterisation using
different antenna polarisations,” IET Microwaves, Antennas
and Propagation, vol. 3, no. 7, pp. 1019–1027, 2009.
[14]S.VanRoy,C.Oestges,F.Horlin,andP.DeDoncker,“A
comprehensive channel model for UWB multisensor multi-
antenna body area networks,” IEEE Transactions on Antennas
and Propagation, vol. 58, no. 1, pp. 163–170, 2010.
[15] J. A. Dabin, N. Ni, A. M. Haimovich, E. Niver, and H.
Grebel, “The effects of antenna directivity on path loss and
multipath propagation in UWB indoor wireless channels,” in
Proceedings of IEEE Conference on Ultra Wideband Systems and
Technologies, pp. 305–309, November 2003.
[16] A. Sani, A. Alomainy, G. Palikaras et al., “Experimental
characterization of UWB on-body radio channel in indoor
EURASIP Journal on Wireless Communications and Networking 11
environment considering different antennas,” IEEE Transac-
tions on Antennas and Propagation, vol. 58, no. 1, pp. 238–241,
2010.
[17] A. Fort, J. Ryckaert, C. Desset, P. De Doncker, P. Wambacq,
and L. Van Biesen, “Ultra-wideband channel model for
communication around the human body,” IEEE Journal on
Selected Areas in Communications, vol. 24, no. 4, pp. 927–933,
2006.
[18] K. Watanabe, S. Hari, K. Ohno, and T. Ikegami, “Experiments
on shadow effects of body and effective paths for UWB
transmission in BAN,” in Proceedings of the International
Symposium on Communications and Information Technologies
(ISCIT ’08), pp. 232–237, October 2008.
[19] I. Oppermann, M. Hamalainen, and J. Linatti, UWB Theory
and Applications, John Wiley & Sons, 2004.
[20] J. J. W. Siemons, Measurement Based Indoor Radio Channel
Model, Koninklijke Philips Electronics, 2000.
[21] J Y. Lee, “UWB channel modeling in roadway and indoor
parking environments,” IEEE Transactions on Vehicular Tech-
nology, vol. 59, no. 7, pp. 3171–3180, 2010.