Báo cáo sinh học: " Research Article Fast Multi-Symbol Based Iterative Detectors for UWB Communications" pptx
Bạn đang xem bản rút gọn của tài liệu. Xem và tải ngay bản đầy đủ của tài liệu tại đây (941.72 KB, 10 trang )
Hindawi Publishing Corporation
EURASIP Journal on Advances in Signal Processing
Volume 2010, Article ID 903161, 10 pages
doi:10.1155/2010/903161
Research Article
Fast Multi-Symbol Based Iterative Detectors for
UWB Communications
Qi Zhou,
1
Xiaoli Ma,
1
and Vincenzo Lottici
2
1
School of Electrical and Computer Enginee ring, Georgia Institute of Technology, Atlanta GA 30332, USA
2
Department of Information Engineering, University of Pisa, 56122 Pisa, Italy
Correspondence should be addressed to Qi Zhou,
Received 1 November 2009; Accepted 20 May 2010
Academic Editor: Tim Davidson
Copyright © 2010 Qi Zhou et al. This is an open access article distributed under the Creative Commons Attribution License, which
permits unrestricted use, distribution, and reproduction in any medium, provided the original work is properly cited.
Ultra-wideband (UWB) impulse radios have shown great potential in wireless local area networks for localization, coexistence with
other services, and low probability of interception and detection. However, low transmission power and high multipath effect make
the detection of UWB signals challenging. Recently, multi-symbol based detection has caught attention for UWB communications
because it provides good performance and does not require explicit channel estimation. Most of the existing multi-symbol based
methods incur a higher computational cost than can be afforded in the envisioned UWB systems. In this paper, we propose an
iterative multi-symbol based method that has low complexity and provides near optimal performance. Our method uses only
one initial symbol to start and applies a decision directed approach to iteratively update a filter template and information symbols.
Simulations show that our method converges in only a few iterations (less than 5), and that when the number of symbols increases,
the performance of our method approaches that of the ideal Rake receiver.
1. Introduction
Ultra-wideband (UWB) impulse radio (IR) transmits ultra-
short pulses at low power spectral density where the informa-
tion is encoded via pulse-amplitude modulation (PAM) or
via pulse-position modulation (PPM). The IR-UWB systems
show some important merits including: coexistence with
current narrowband signals, high multiple-access capacity
and fine timing resolution [1–3]. Fine timing resolution
property helps the receiver to resolve distinct dense mul-
tipath components and provides high degrees of diversity
whilst the low power spectral density enables sharing of the
RF spectrum with limited mutual interference.
One of the major challenges in UWB system is to deal
with the dense multipath channel. Indeed, each transmitted
UWB pulse arrives at the receiver as hundreds of replicas
with different delays, amplitudes and phases [4–6]. To collect
the available diversity, Rake receivers [7, 8] employ a large
number of fingers to capture the multipath energy [9].
However, channel estimation error can degrade the Rake’s
performance and the accurate estimation of the gains and
delays of channel paths incurs considerable computational
cost [10].
As an alternative to the Rake receiver, the transmitted
reference (TR) method [8, 11–14] sends a reference signal
along with the data-modulated signal. The receiver can
simply be an autocorrelation receiver which demodulates
the data by correlating the delayed reference signal and the
data-modulated signal. The advantage of the TR method
compared to the Rake method is that it is easier to implement
because it does not require explicit channel estimation.
However, the main drawback of TR-based methods is that
the noise induced in the reference signal severely degrades
the error performance.
In [15], decision-directed autocorrelation (DDA)
receivers are proposed to detect the current symbol by
correlating the current information waveform with a
waveform template generated by all previously decoded
symbols. However, the DDA receivers detect the information
symbols successively and the current detected symbol
has no contribution to the preceding symbol detection.
To relieve the noise effect of the reference signal in TR
2 EURASIP Journal on Advances in Signal Processing
system, further enhancement techniques exploit the multi-
symbol differential detection [16, 17] to jointly detect M
consecutive symbols. The generalized likelihood ratio test
(GLRT) approach for the multi-symbol case is derived and
exhaustive search is performed on all 2
M
symbol possibilities
to find the optimal one [16]. The practical implementation
of the method suffers from the exponential computational
complexity in terms of block size M. A reduced complexity
algorithm is devised in [17] by introducing the sphere
decoding algorithm (SDA). An approximate algorithm based
on the Viterbi algorithm (VA) is also presented in [17].
Although SDA and VA reduce the complexity relative to
exhaustive search, and are effective for small M, they require
considerable computational effort when M is large.
In this paper, we propose a fast multi-symbol iterative
detection method. The method harvests the benefits from
the concept of the multiple symbols detection and outputs
a better bit error rate (BER) performance than the single
symbol TR system whilst exhibiting a low computational
complexity (O(NM
2
), where M is block size and N is the
maximum number of iterations). Following the description
of general iterative method, two particular low-complexity
detectors are designed and evaluated in the simulation exper-
iments. Although the proposed method cannot guarantee to
achieve the same performance as the GLRT-based detector
in the general case, experimental results show that the BER
performance of the method is very close to that of the GLRT
when M
≥ 10 (the signal-to-noise ratio (SNR) gap is less
than 0.5 dB). Further experiments demonstrate that a few
iterations (N<5 iterations) are sufficient for the detectors
to converge.
The rest of the paper is organized as follows. Section 2
introduces the UWB signal model. Section 3 describes
the multi-symbol transmitted reference system with GLRT
detection. Section 4 develops two fast multi-symbol trans-
mitted reference-based detectors. Section 5 shows the
numerical results for a constant channel and random
channels, respectively. Section 6 concludes the paper.
2. Signal Model
The transmitted signal in IR-UWB systems using the pulse
amplitude modulation (PAM) for the ith transmitted symbol
is
s
i
(
t
)
= b
i
N
f
−1
j=0
p
t − jT
f
− c
j
T
c
,
(1)
where p(t) is a transmitted monocycle waveform with
support set [0, T
p
], the b
i
’s are the modulated symbols, the
c
j
’s are the user-specific pseudorandom time-hopping (TH)
codes and T
f
is its frame duration. Because the energy of one
single pulse is limited in UWB communication systems, each
symbol is transmitted using N
f
frames so that the receiver
can collect enough energy to recover the signal. Thus, the
symbol duration is T
s
= N
f
T
f
. The TH codes c
j
are integers
chosen from 0
≤ c
j
≤ N
c
− 1 so that multiple users can
access the channel concurrently and the transmission time of
jth monocycle waveform is delayed with c
j
T
c
seconds. Due
to the highly-frequency selective feature of UWB channel,
the frame duration is chosen such that T
f
>T
m
+ T
p
+
N
c
T
c
,whereT
m
is the maximum excess delay of the channel.
This condition eliminates intersymbol interference (ISI). The
energy of one pulse is E
p
=
T
p
0
p
2
(t)dt.
The channel impulse response (CIR) of the UWB system
is assumed to be slow fading with multipath propagation
h
(
t
)
=
K
k=1
α
k
δ
(
t −τ
k
)
,
(2)
where K is the total number of specular propagation paths
with amplitude α
k
and delay τ
k
. Hence, the signal obtained
from the receiver side for the ith symbol is modeled as
r
i
(
t
)
= s
i
(
t
)
∗ h
(
t
)
+ n
(
t
)
=
K
k=1
α
k
s
i
(
t
− τ
k
)
+ n
(
t
)
= b
i
N
f
−1
j=0
g
t − jT
f
− c
j
T
c
+ n
(
t
)
,
(3)
where g(t)
= p(t) ∗ h(t) is the channel template, ∗
denotes the convolution operation and n(t) denotes the noise
including multiple access interference (MAI) and an additive
white Gaussian noise (AWGN) with zero mean and two-
sided power spectral density N
0
/2. The noiseless received
signal energy in each frame is defined as E
f
=
T
f
0
g
2
(t)dt
and is proportional to the pulse energy E
p
.
A key element to determine the receiver demodulation
structure is the way to encode the information symbols a
k
∈
{
+1, −1} to the transmitted symbols b
j
∈{+1, −1}. In the
following, we list three kinds of encoders:
(i) Transmitted Reference (TR) [12]withb
m
= 1ifm is
even, otherwise b
m
= a
(m−1)/2
.
(ii) Multi-Symbol Differential Encoder (MSDE) [17]
with b
i(M+1)
= 1andb
i(M+1)+m
= b
i(M+1)+m−1
a
iM+m
where i is a multi-symbol block index and 1 ≤ m ≤
M.
(iii) Multi-Symbol Transmitted Reference (MSTR) with
b
i(M+1)
= 1andb
i(M+1)+m
= a
iM+m
where i is a multi-
symbol block index and 1
≤ m ≤ M.
In this paper, our focus is on the MSTR encoder in this
paper. All these encoders employ the first modulated symbol
as the reference signal in each block and the TR scheme
[12] can be viewed as a special case of MSTR scheme where
M
= 1. For MSDE case, the current transmitted symbols
are encoded differentially with the previous encoded symbols
and the first symbol is used as an initial symbol, while in
MSTR case, the current transmitted symbol is the same as
the information symbol except the first one, which is used to
generate the reference template.
3. GLRT-Based Multi-Symbol Detection
In the case of multi-symbol detection, each block contains
M + 1 symbols including one reference symbol and M
EURASIP Journal on Advances in Signal Processing 3
information symbols. To simplify the equations in multi-
symbol detection cases, we consider only the encoding and
detecting scheme in one block of M + 1 symbols. Hence, the
received signal can be rewritten as
x
(
t
)
=
M
m=0
r
m
(
t
− mT
s
)
=
M
m=0
b
m
N
f
−1
j=0
g
t −mT
s
− jT
f
− c
j
T
c
+ n
(
t
)
,
(4)
by assuming that the channel is quasi-static over the interval
[0, (M +1)T
s
].
Now, our task is to determine the information symbols
a
= [a
0
, a
1
, , a
M
]
T
, a
0
= 1 without knowing the channel
template g(t). The relationship between information sym-
bols a
m
and transmitted symbols b
m
for MSDE is
b
m
=
m
i=0
a
i
,form = 0, , M,
(5)
and for MSTR is
b
m
= a
m
,form = 0, , M.
(6)
Here, we resort to the generalized likelihood ratio test
(GLRT) approach to detect the information symbols. The
log-likelihood metric is given as
L
x
(
t
)
| a, g
(
t
)
=−
(M+1)T
s
0
(
x
(
t
)
− x
(
t
))
2
dt,
(7)
where
x(t) is the candidate waveform constructed by a, g(t)
x
(
t
)
=
M
m=0
H
(m)
⊗ a
N
f
−1
j=0
g
t −mT
s
− jT
f
− c
j
T
c
,
b
m
= H
(m)
⊗ a,
(8)
where H
(m)
is the (m +1)strowofan(M +1)× (M +1)
matrix which comes from the encoding schemes (MSDE or
MSTR) described in Section 2.AllentriesofH
(m)
are 0 or
1and[h
0
, h
1
, h
2
, , h
M
] ⊗ [a
0
, a
1
, a
2
, , a
M
]
T
is defined as
M
i
=0,h
i
/
=0
a
i
.TheH matrices for the MSDE and MSTR are
H
MSDE
=
⎡
⎢
⎢
⎢
⎢
⎢
⎢
⎢
⎢
⎢
⎢
⎢
⎣
1000··· 00
1100
··· 00
1110
··· 00
1111
··· 00
.
.
.
.
.
.
.
.
.
.
.
.
.
.
.
.
.
.
.
.
.
1111
··· 10
1111
··· 11
⎤
⎥
⎥
⎥
⎥
⎥
⎥
⎥
⎥
⎥
⎥
⎥
⎦
,
H
MSTR
=
⎡
⎢
⎢
⎢
⎢
⎢
⎢
⎢
⎢
⎢
⎢
⎢
⎣
1000··· 00
1100
··· 00
1010
··· 00
1001
··· 00
.
.
.
.
.
.
.
.
.
.
.
.
.
.
.
.
.
.
.
.
.
1000
··· 10
1000
··· 01
⎤
⎥
⎥
⎥
⎥
⎥
⎥
⎥
⎥
⎥
⎥
⎥
⎦
.
(9)
The decision rule of GLRT algorithm is of the form
a = arg max
a,g(t)
L
x
(
t
)
| a, g
(
t
)
.
(10)
In (10), although g(t) is unknown, it is treated as a
nuisance parameter. The optimum reference template given
a symbol candidate
a can be obtained using the variational
technique (see [17])
g
(
t
)
= arg max
g
(
t
)
L
x
(
t
)
| a, g
(
t
)
=
1
M +1
M
m=0
H
(m)
⊗ a
y
m
(
t
)
,
(11)
where y
m
(t) is the averaged waveform for the mth received
symbol signal over N
f
frames
y
m
(
t
)
=
1
N
f
N
f
−1
j=0
x
t + mT
s
+ jT
f
+ c
j
T
c
,0≤ t ≤ T
f
=
1
N
f
N
f
−1
j=0
r
m
t + jT
f
+ c
j
T
c
,0≤ t ≤ T
f
.
(12)
Incorporating the log-likelihood formula in (10)and
(11), finally we have
a = arg max
a
M
−1
m=0
M
l=m+1
H
(m)
⊗ a
H
(l)
⊗ a
Z
m,l
,
(13)
where
Z
i,j
=
T
r
0
y
i
(
t
)
y
j
(
t
)
dt,
(14)
where T
r
is the integration interval of the correlator, and
T
r
≤ T
m
+ T
p
.
Some remarks are now of interest.
(i) For the single user or multiple-orthogonal users case
with M
= 1, (13)reducesto
a
1
= arg max
a
1
a
1
Z
0,1
,
(15)
which is equivalent to averaged transmitted reference (ATR)
detection for single symbol detection [12]
a
1
= sgn
(
z
)
= sgn
Z
0,1
,
(16)
where z
= Z
0,1
is the decision variable for ATR.
Simple mathematical manipulations yield the following
expressions for the mean and variance of the decision
variable z as
μ
= E{z}=a
i
E
f
,
(17)
σ
2
= Va r{z}=
E
f
N
0
N
f
+
N
2
0
T
r
W
2N
2
f
,
(18)
4 EURASIP Journal on Advances in Signal Processing
where W is the one-sided noise bandwidth of the receiver,
E
{·} is the statistical expectation, and Var{·} is the variance
of the random variable. The BER of the detector in this case
is [12]
P
ATR
= Q
⎛
⎜
⎝
⎡
⎣
N
0
N
f
E
f
+
N
2
0
T
r
W
2N
2
f
E
2
f
⎤
⎦
−1/2
⎞
⎟
⎠
, (19)
where Q(x) is the Q-function Q(x)
= (2π)
−1/2
∞
x
exp(−t
2
/
2)dt.
(ii) Unlike the ideal Rake receiver, which correlates the
receive signal with noiseless template, the TR scheme uses
the noisy reference signal as a template in one symbol
case and the best estimated reference signal using (11)in
the multi-symbol case. However, the TR system does not
explicitly estimate the channel parameters and only requires
the correlation coefficients Z
m,l
, Z
m,l
= Z
l,m
,0≤ m ≤ M,
0
≤ l ≤ M evaluated in (14).
(iii) As seen in (11), the variance of the reference signal
g(t)decaysasM increases when a = a. In turn, the accuracy
of the multi-symbol detection is improved and converges to
the performance of ideal Rake receiver as M
→∞.
(iv)Theglobaloptimalvalueof
a can be obtained
by using exhaustive search [16] or sphere decoding [17].
However, the computational cost of the exhaustive search
method grows exponentially with the number of symbols
M. Sphere decoding method searches all the lattice points
inside a given radius and reduces the complexity of the
exhaustive search method on average. However, the expected
complexity of SDA is still exponential for fixed SNR and
increases significantly when SNR is low [18].
4.AFastMSTRDetectionMethod
In this section, we develop an iterative MSTR detection
algorithm by avoiding the high computational complexity
of GLRT-based detectors (e.g., exhaustive search [16]and
SDA [17]). Similar to the TR detection scheme, the proposed
method first generates a reference template by using the
initial symbol only, and then estimates the information sym-
bols by correlating the reference template with the symbol
waveforms. Furthermore, with the help of the information
from multiple transmitted symbols, our method manages to
suppress the reference template noise. However, our method
also generates additional noise-cross-signal and noise-cross-
noise terms which do not appear in the case of an ideal Rake
receiver with perfect channel knowledge.
For the initialization, since the only known symbol is
b
0
= 1, the best template at this stage is
g
(1)
(
t
)
= b
0
y
0
(
t
)
= y
0
(
t
)
,
(20)
where y
0
(t)canbefoundin(12).
The decision variables for the M information symbols are
z
(1)
m
=
T
r
0
g
(1)
(
t
)
y
m
(
t
)
dt
=
T
r
0
y
0
(
t
)
y
m
(
t
)
dt
= Z
0,m
,form = 1, , M.
(21)
The estimated information symbols in this iteration are
b
(1)
m
= sgn
Z
0,m
,form = 1, , M.
(22)
This means that at the first step the estimated symbols
are obtained by correlating the waveform corresponding
to b
0
with the mth symbol waveform. Hence, the BER
performance is the same as that of the ATR in (19).
For the nth iteration, the method firstly constructs a new
reference template by weighting the product of each symbol’s
waveform y
i
(t) and its corresponding detected symbol
b
(n−1)
i
obtained from the previous iteration
g
(n)
(
t
)
= w
(n−1)
0
y
0
(
t
)
+
M
i=1
w
(n−1)
i
b
(n−1)
i
y
i
(
t
)
.
(23)
Then, the decision variable for the mth symbol is
evaluated in the same way as the one in (21)
z
(n)
m
=
T
r
0
g
(n)
m
(
t
)
y
m
(
t
)
dt
= w
(n−1)
0
Z
0,m
+
M
i=1, i
/
=m
w
(n−1)
i
b
(n−1)
i
Z
i,m
,
(24)
where
g
(n)
m
(t) is the reference template for the mth symbol by
removing the mth waveform y
m
(t)fromg
(n)
(t)
g
(n)
m
(
t
)
= w
(n−1)
0
y
0
(
t
)
+
M
i=1, i
/
=m
w
(n−1)
i
b
(n−1)
i
y
i
(
t
)
.
(25)
At last, the iteration outputs the estimated symbols as
b
(n)
m
= sgn
z
(n)
m
. (26)
4.1. Weight Selections. A key factor that affects the method’s
performance and convergence is how to update the weights
in each iteration. The ultimate goal of selecting the weights
is to reduce BER while maintaining low computational
complexity and requiring little extra knowledge (such as
channel information). Here, we propose two types of rule for
the choice of the weights in each iteration.
(i) Hard Decision for MSTR (HD-MSTR). Therulecon-
structs the reference template as
g
(n)
(
t
)
= y
0
(
t
)
+
M
i=1
b
(n−1)
i
y
i
(
t
)
,
(27)
EURASIP Journal on Advances in Signal Processing 5
which indicates that w
(n−1)
= [1, 1, ,1]in(23). Also note
that, the template is a scaled version of the GLRT template
estimate given the detected symbols
b
(n−1)
as shown in (11).
An interesting observation on the reference template
of HD-MSTR in (27) is that the variance of the reference
template is constant given the detected symbols
b
(n−1)
m
Var
g
(n)
(
t
)
=
Var
y
0
(
t
)
+
M
i=1
Var
b
(n−1)
i
y
i
(
t
)
=
(
M +1
)
Var
y
0
(
t
)
.
(28)
The conditional mean of the template is
E
g
(n)
(
t
)
| b
=
g
(
t
)
+
M
m=1
b
(n−1)
m
b
m
g
(
t
)
=
1+2N
(n−1)
c
− M
g
(
t
)
,
(29)
where N
(n−1)
c
is the number of correct symbols for the (n −
1)st iteration. Hence, the mean and standard deviation ratio
is
E
g
(n)
(
t
)
| b
Std
g
(n)
(
t
)
=
1+2N
(n−1)
c
− M
g
(
t
)
(
M +1
)
Std
y
0
(
t
)
,
(30)
where Std
{·} is the standard deviation of the random
variable. In general, the larger the mean-standard deviation
ratio, the better the BER performance. Thus, in the case
of HD-MSTR, if more correct symbols are detected for the
current iteration, during the next iteration, the reference
template is improved and then the method potentially results
in better BER performance. The iterative procedure runs
back and forth until no symbol is changed or the maximum
number of iterations is reached.
(ii) Soft Decision for MSTR (SD-MSTR). An intuitive idea
of the SD-MSTR detector is that the decision variable z
(n)
m
obtained in each iteration reflects the reliability of the
detected symbol
b
(n)
m
. The larger the value of z
(n)
m
, the more
we can trust the accuracy of the detected symbol
b
(n)
m
.Hence,
the corresponding symbol deserves higher weight in the
representation of the reference template for next iteration.
By facilitating the additional information from decision
variables z
(n)
m
, the SD-MSTR determines the weight values as
w
(n)
m
= P
b
m
=
b
(n)
m
| z
(n)
m
−
P
b
m
/
=
b
(n)
m
| z
(n)
m
(31)
= 2P
b
m
=
b
(n)
m
| z
(n)
m
−
1, for m = 0, , M, (32)
where the two terms in (31) are the posterior probabilities
of correct and erroneous detection of the symbol
b
(n)
m
,con-
ditioned on the decision variable z
(n)
m
. If these probabilities
are the same, that means it does not matter which decision
we make. This represents the most unreliable case and the
weight should be set to zero. The larger the probability of
correct detection, the higher weight we should put on this
decision. Note that the weight w
(n)
0
of the known reference
symbol b
0
is set to 1, w
(n)
m
should be 0 ≤ w
(n)
m
≤ 1andw
(n)
m
b
(n)
m
ranges from [−1, +1] indicating how much the averaged
signal y
m
(t) contributes to the final template depending on
accuracy of the estimated symbol
b
(n)
m
.
By applying Bayes’ rule, (31)becomes
w
(n)
m
=
P
z
(n)
m
| b
m
=
b
(n)
m
−
P
z
(n)
m
| b
m
/
=
b
(n)
m
P
z
(n)
m
| b
m
=
b
(n)
m
+ P
z
(n)
m
| b
m
/
=
b
(n)
m
,
for m
= 0, , M,
(33)
where the probabilities rely on the distribution of z
(n)
m
which is approximately Gaussian distributed with mean
b
m
μ
(n)
m
(μ
(n)
m
> 0), and variance (σ
(n)
m
)
2
given b
m
[13]
P
z
(n)
m
| b
m
= +1
=
1
√
2πσ
(n)
m
exp
⎛
⎜
⎝
−
z
(n)
m
− μ
(n)
m
2
2
σ
(n)
m
2
⎞
⎟
⎠
=
1
σ
(n)
m
φ
⎛
⎝
z
(n)
m
− μ
(n)
m
σ
(n)
m
⎞
⎠
,
P
z
(n)
m
| b
m
=−1
=
1
√
2πσ
(n)
m
exp
⎛
⎜
⎝
−
z
(n)
m
+ μ
(n)
m
2
2
σ
(n)
m
2
⎞
⎟
⎠
=
1
σ
(n)
m
φ
⎛
⎝
z
(n)
m
+ μ
(n)
m
σ
(n)
m
⎞
⎠
,
(34)
where φ(x)
= (1/
√
2π) e
−(1/2)x
2
is the probability density
function (pdf) of the standard normal distribution.
ApracticalissueinSD-MSTRishowtoevaluatethe
statistics of z
(n)
m
in each iteration since we do not have an
explicit formula. An approximate solution of the problem
is to utilize the known ATR statistics to evaluate the
probabilities for each iteration
P
z
(n)
m
| b
m
= +1
≈
1
σ
φ
⎛
⎝
z
(n)
m
− μ
σ
⎞
⎠
, (35)
P
z
(n)
m
| b
m
=−1
≈
1
σ
φ
⎛
⎝
z
(n)
m
+ μ
σ
⎞
⎠
, (36)
where μ and σ can be found in (17)and(18) which require
the frame energy E
f
and the noise power N
0
to evaluate μ
and σ, but they are easy to estimate and store at the receiver
side.
Now, we can summarize our method in the following
steps for one block symbol detection.
Input: Correlation matrix Z
i,j
defined in (14), where 0 ≤
i ≤ M,0≤ j ≤ M, the maximum number of iterations N,
channel statistics μ and σ for the SD-MSTR case.
6 EURASIP Journal on Advances in Signal Processing
Step 1. Initialize w
(0)
= [1,1, ,1],
b
(0)
= [1,0, ,0],
n
= 0.
Step 2. n
= n +1.
Step 3. Obtain the decision variables by (24).
Step 4. Obtain the detected symbols by (26).
Step 5. Set w
(n)
= w
(0)
for the HD-MSTR case or update the
weights for w
(n)
based on (31), (35), (36) in the SD-MSTR
case.
Step 6 . If n<Nand
b
(n)
/
=
b
(n−1)
goto Step 2, otherwise
output
b
(n)
and exit.
4.2. Convergence and Discussions. (i) The convergence rate
also affects the practical value of the method (e.g., a system
with a tight constraint on decoding delay) and the number
of iterations affects the performance. These will be verified
by the numerical simulation that the proposed method
converges to the stable performance curve within a few
iterations (usually
≤ 5 iterations).
(ii) Comparing with MSDD, we choose MSTR as the
encoding scheme which allows the algorithm to detect
symbol b
m
= a
m
directly without any further processing.
(iii) Instead of evaluating each iteration’s reference
template
g
(n)
(t) explicitly, the method computes the decision
variables by linear combination of the correlation coefficients
Z
i,j
which can be computed in the first iteration and reused
later.
(iv) The HD-MSTR only requires the coefficients Z
i,j
which is the same as the GLRT approach meanwhile
the SD-MSTR requires some additional channel statistical
information to update the weights for each iteration.
(v) For each iteration, Step 3 requires 2M(M
− 1)
multiplications and M
2
additions to attain the decision
variables for all M symbols. In Step 4, M sign operations
are performed to obtain detected symbols. No arithmetic
is required for HD-MSTR in Step 5, while the SD-MSTR
performs 2M times Gaussian pdf evaluation and needs 3M
additions and M divisions to normalize weights. We can treat
the computational costs of sign operation and Gaussian pdf
evaluation as being constant, and then the computational
complexity of the both detectors for each iteration is O(M
2
)
where M is the block size. Note that the complexity of the
proposed method is independent of the channel realizations
whilst the computational complexity of SDA relies on the
specific realization of channels and SNR.
5. Numerical Results
This section compares the BER performance of the proposed
methods (HD-MSTR and SD-MSTR) and the MSTR based
on exhaustive search (ES-MSTR) as benchmark. Two kinds
of channel schemes are evaluated: one is a constant channel
with fixed CIR parameters, and the other is a random
channel based on Saleh and Valenzuela (SV) channel model.
10
−5
10
−4
10
−3
BER
10
−2
10
−1
10
0
46810
E
b
/N
0
(dB)
12 14 16 18
HD-MSTR, M = 2
HD-MSTR, M
= 5
HD-MSTR, M
= 10
HD-MSTR, M
= 20
HD-MSTR, M
= 30
HD-MSTR, M
= 100
HD-MSTR, M
= 200
ES-MSTR, M
= 2
ES-MSTR, M
= 5
ES-MSTR, M
= 10
ATR
Ideal Rake
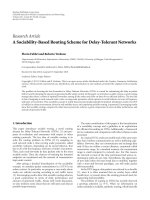
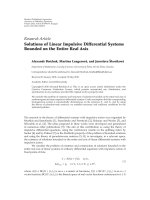
Figure 1: BER of HD-MSTR for different M, K = 200, N
f
= 20,
N
= 10.
5.1. Constant Channel. At the transmitter side, the pulse
p(t) is the second derivative of a Gaussian function with
normalized unit energy and pulse width T
p
= 1.0ns.
ThenumberofframespersymbolsisN
f
= 20. For the
UWB channel model, we employ the resolvable multipath
assumption such that τ
k
= kT
p
as studied in [12, 13, 19]
and then WT
r
in (18) can be approximated with the number
of paths K. In this simulation, K is 200 and the energy of
impulse channel response (CIR)
T
f
0
|h(t)|
2
dt = 1which
means E
f
= E
p
in this scheme. As we have shown in
Section 3, if the number of symbols in one block M is equal
to1orthemaximumnumberofiterationsN is equal to
1, then the system outputs the same performance as ATR
scheme in [12]. Note that there is a 3 dB gap between the
ATR curve in the following figures and the one in [12]. This
is because the definition of frame energy in [12]istwiceas
the one of ours. In this subsection, we only consider single
user case with c
j
= 0, for all j. Multiuser case will be shown
in next subsection.
5.1.1. BER with Different Block Size. Figures 1 and 2 illustrate
the BER results for M
= 2, 5, 10, 20, 30, 100,200 for HD-
MSTR and SD-MSTR, respectively. For HD-MSTR, the
proposed method can obtain about 2dB gain relative to ATR
in the case of M
= 5 and about 3 dB gain if M = 10. With
the increase of the number of symbols in one block, the
performance of the proposed method grows monotonically
but the improvement decelerates (5 dB gain for M
= 20 and
5.3dB gainforM
= 30). In the same figure, we also depict
the performance of the GLRT algorithm with exhaustive
search (called ES-MSTR) as benchmarks. We also perform
EURASIP Journal on Advances in Signal Processing 7
10
−5
10
−4
10
−3
BER
10
−2
10
−1
10
0
46810
E
b
/N
0
(dB)
12 14 16 18
SD-MSTR, M = 2
SD-MSTR, M
= 5
SD-MSTR, M
= 10
SD-MSTR, M
= 20
SD-MSTR, M
= 30
SD-MSTR, M
= 100
SD-MSTR, M
= 200
ES-MSTR, M
= 2
ES-MSTR, M
= 5
ES-MSTR, M
= 10
ATR
Ideal Rake
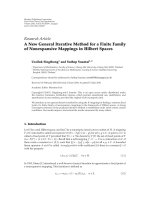
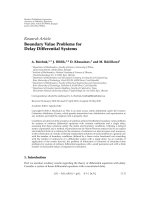
Figure 2: BER of SD-MSTR for different M, K = 200, N
f
= 20,
N
= 10.
10
−5
10
−4
10
−3
BER
10
−2
10
−1
10
0
46810
E
b
/N
0
(dB)
12 14 16 18
N
= 1
M
= 5, N = 2
M
= 5, N = 3
M
= 5, N = 10
M
= 30, N = 2
M
= 30, N = 3
M
= 30, N = 4
M
= 30, N = 10
ATR
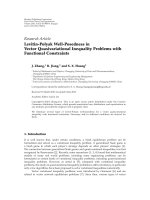
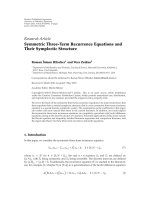
Figure 3: BER of HD-MSTR for different iterations M = 5, 30,
K
= 200, N
f
= 20.
some simulations with very large M (M = 100,200) which is
intractable for classical methods. The system provides similar
performance to that of the ideal Rake receiver, especially in
high SNR range, where the difference is less than 1 dB.
Comparing the performance of HD-MSTR and SD-
MSTR detectors in Figures 1 and 2, respectively, the differ-
ence is obvious when M is small. The SD-MSTR outperforms
10
−5
10
−4
10
−3
BER
10
−2
10
−1
10
0
46810
E
b
/N
0
(dB)
12 14 16 18
N
= 1
M
= 5, N = 2
M
= 5, N = 3
M
= 5, N = 10
M
= 30, N = 2
M
= 30, N = 3
M
= 30, N = 4
M
= 30, N = 10
ATR
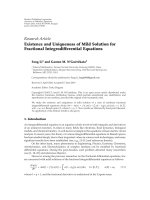
Figure 4: BER of SD-MSTR for different iterations M = 5, 30, K =
200, N
f
= 20.
the HD-MSTR, with about 0.5dB of SNR gain when M =
5, 10 and around 0.2 dB gain when M = 20, 30. The
difference becomes trivial when M is 100 or larger. This
indicates that the SD-MSTR method can offer additional
advantages for low complexity UWB systems with small M
and but its advantage decreases with increasing M. Bearing
in mind that the SD-MSTR requires some statistical channel
information (μ, σ in (17)and(18)) and the Gaussian pdf
calculation of the system, it is more likely that the simpler
HD-MSTR algorithm would be implemented if M is large.
Compared with HD-MSTR and SD-MSTR, the ES-
MSTR has an advantage when M is small (if M
= 2, about
1.1 dB gain for HD-MSTR and 0.6dB for SD-MSTR) and the
performance gap becomes smaller when M is larger. When
M
= 10, the gap reduces to around 0.5 dB for HD-MSTR
case and about 0.1 dB for the SD-MSTR case. This shows
that with the increasing value of M the difference between
the optimal ES-MSTR method and our proposed methods
decreases rapidly and that the gap can be ignored for a
sufficient large M. Furthermore, the ES-MSTR incurs much
higher computational cost than our MSTR method.
5.1.2. BER with Different Iterations. To answer the conver-
gence question in Section 4.2, Figures 3, 4, 5,and6 depict
the BER values recorded in each iteration for M
= 5, 30.
When there is only one iteration, the system reduces to classic
ATR system and the BER result overlaps with that given by
(19) (see Figures 3 and 4). The BER is improved significantly
in the second iteration and just after about 4 iterations, the
algorithm reaches a stable BER performance curve with a
small improvement in the 5th iteration at low SNRs. These
show that our methods converge fast and it is practical for
8 EURASIP Journal on Advances in Signal Processing
10
−5
10
−4
10
−3
BER
10
−2
10
−1
10
0
12345
Iterations
HD-MSTR
678910
M
= 5, E
b
/N
0
= 9
M
= 5, E
b
/N
0
= 11.5
M
= 5, E
b
/N
0
= 13.5
M
= 30, E
b
/N
0
= 6
M
= 30, E
b
/N
0
= 8.5
M
= 30, E
b
/N
0
= 10.5
Figure 5: Convergence rate of HD-MSTR with M = 5, 30 in
different SNR level.
10
−5
10
−4
10
−3
BER
10
−2
10
−1
10
0
1
2345
Iterations
SD-MSTR
678910
M
= 5, E
b
/N
0
= 9
M
= 5, E
b
/N
0
= 11.5
M
= 5, E
b
/N
0
= 13.5
M
= 30, E
b
/N
0
= 6
M
= 30, E
b
/N
0
= 8.5
M
= 30, E
b
/N
0
= 10.5
Figure 6: Convergence rate of SD-MSTR with M = 5, 30 in
different SNR level.
UWB systems. It is also noticed that the HD-MSTR and SD-
MSTR show the similar convergence rates in the figures.
5.2. SV Channel Model. The more realistic UWB channel
is random which significantly affects the BER performance
compared with constant channels. The SV channel model
which is generally statistically verified to well describe the
realistic UWB channel with dense multipath is adopted in
10
−5
10
−4
10
−3
BER
10
−2
10
−1
10
0
46 81012
E
b
/N
0
(dB)
14 16 18 20 22
HD-MSTR, M
= 2
HD-MSTR, M
= 5
HD-MSTR, M
= 10
HD-MSTR, M
= 20
HD-MSTR, M
= 30
HD-MSTR, M
= 100
ATR
Ideal Rake
Figure 7: Average BER of HD-MSTR for different M over random
channels, N
= 10.
this section. The model formulates the channel impulse
response (CIR) as [20]
h
(
t
)
=
∞
l=0
∞
k=0
β
kl
p
kl
δ
(
t −T
l
− τ
kl
)
,
(37)
where β
kl
p
kl
models the double-sided Rayleigh distributed
amplitudes with exponentially decaying profile.
In our experiments, the SV channel model parameters
are: Γ
= 30ns, γ = 5ns,Λ = 0.5ns
−1
, λ = 2ns
−1
(see [20,
(23), (24), (26)] ). The pulse p(t) is the monocycle which is
the same as the one in Section 5.1. The energy per bit E
b
is
defined as
E
b
= N
f
E
f
,
(38)
where
E
f
is the average received energy per frame and the
frame repetition factor is N
f
= 25 (to compare with [17])
while the integral interval is T
r
= 100ns and the frame
duration is T
f
= 200 ns to preclude the IFI.
5.2.1. Single User Scenario. Figures 7 and 8 plot the perfor-
mance curves for both HD-MSTR and SD-MSTR in single
user scenario, respectively. For random channels, SD-MSTR
shows about 0.5 dB gain over the HD-MSTR for M
=
2, 5,10, 20, 30 and retains the advantage even for large M
(M
= 100). For HD-MSTR case, the algorithm achieves 2 dB
gain if M
= 5 and about 6 dB gain if M = 30 with respect to
ATR. This means that with a few iterations, the algorithms
efficiently exploit the multi-symbol benefits and yield a
near optimal result. Furthermore, by avoiding searching the
solution space which is computational complex, our iterative
methods are easy to compute by adding up some correlation
terms with different weights in (24).
EURASIP Journal on Advances in Signal Processing 9
10
−5
10
−4
10
−3
BER
10
−2
10
−1
10
0
46 81012
E
b
/N
0
(dB)
14 16 18 20 22
SD-MSTR, M
= 2
SD-MSTR, M
= 5
SD-MSTR, M
= 10
SD-MSTR, M
= 20
SD-MSTR, M
= 30
SD-MSTR, M
= 100
ATR
Ideal Rake
Figure 8: Average BER of SD-MSTR for different M over random
channels, N
= 10.
10
−4
10
−3
10
−2
BER
10
−1
10
0
64810
E
b
/N
0
(dB)
12 14 16
HD-MSTR, N
u
= 1
HD-MSTR, N
u
= 50
HD-MSTR, N
u
= 100
SD-MSTR, N
u
= 1
SD-MSTR, N
u
= 50
SD-MSTR, N
u
= 100
ATR, N
u
= 1
Ideal Rake, N
u
= 1
Figure 9: BER of HD-MSTR and SD-MSTR for M = 30, N = 10,
and different N
u
over random channels.
Furthermore, when M = 100 and BER = 10
−5
, there
is about 2dB gap between the ideal Rake receiver and our
algorithm. As we expected, the performance over random
channels is worse than the one with constant channels.
5.2.2. Multiuser Scenario. In this subsection, we consider the
performance of our algorithms in the presence of multiple
access interference (MAI). In the case of MAI, the chip
interval is T
c
= 1.0 ns and the TH codes c
j
are randomly
generated in the range [0,N
c
− 1] where N
c
= 91. Unlike
the single user scenario, we do not consider the attenuation
of each individual channel and assume ideal power control
among nodes such that the received energy from each
interfering user is the same. Figure 9 displays the BER result
in this MAI scenario. At BER
= 10
−4
, the HD-MSTR
experiences only around 1dB performance degradation for
N
u
= 50 comparing with corresponding single user scenario
where N
u
is the number of users. In addition, there is less
than 5 dB gap between the multiple users HD-MSTR and
single user ideal Rake receiver. For the SD-MSTR case, the
detector outperforms the HD-MSTR detector with more
than 0.2 dB gain in both single and multiple users scenario.
In summary, our proposed detectors demonstrate significant
robustness in the present of the MAI effects.
6. Conclusion
In this paper, we propose fast detection methods for MSTR
transmissions. The proposed MSTR detectors obtain the
decision variables by summing up the correlation of different
symbol waveforms, each properly weighted by the reliability
of detected symbols and iteratively updating the weights
and detected symbols. With different updating methods for
the weights, two detectors are proposed: Hard Decision for
MSTR (HD-MSTR) detector and Soft Decision for MSTR
(SD-MSTR) detector, where HD-MSTR obtains the template
based only on the previous detected symbols, while SD-
MSTR constructs the template with additional information
from the decision variables. Enhanced BER performance
relative to the ATR scheme and the fast convergence property
of these detectors are shown by the simulation results. Due
to its simplicity, low computational complexity and near
optimal performance for M
≥ 10, the method is promising
for realistic UWB applications.
Acknowledgments
Part of this work is supported by the Georgia Tech
Ultrawideband Center of Excellence (tech
.gatech.edu/). The authors would like to thank the anony-
mous reviewers and the guest editor for their helpful
comments which improved the quality of this paper.
References
[1] M. Z. Win and R. A. Scholtz, “Impulse radio: how it works,”
IEEE Communications Letters, vol. 2, no. 2, pp. 36–38, 1998.
[2] M. Z. Win and R. A. Scholtz, “Ultra-wide bandwidth time-
hopping spread-spectrum impulse radio for wireless multiple-
access communications,” IEEE Transactions on Communica-
tions, vol. 48, no. 4, pp. 679–691, 2000.
[3] L. Yang and G. B. Giannakis, “Ultra-wideband communica-
tions: an idea whose time has come,” IEEE Signal Processing
Magazine, vol. 21, no. 6, pp. 26–54, 2004.
[4] R. J M. Cramer, R. A. Scholtz, and M. Z. Win, “Evaluation of
an ultra-wide-band propagation channel,” IEEE Transactions
on Antennas and Propagation, vol. 50, no. 5, pp. 561–570, 2002.
10 EURASIP Journal on Advances in Signal Processing
[5] M. Z. Win and R. A. Scholtz, “Characterization of ultra-
wide bandwidth wireless indoor channels: a communication-
theoretic view,” IEEE Journal on Selected Areas in Communica-
tions, vol. 20, no. 9, pp. 1613–1627, 2002.
[6] D. Cassioli, M. Z. Win, and A. F. Molisch, “The ultra-wide
bandwidth indoor channel: from statistical model to simula-
tions,” IEEE Journal on Selected Areas in Communications, vol.
20, no. 6, pp. 1247–1257, 2002.
[7] D. Cassioli, M. Z. Win, F. Vatalaro, and A. F. Molisch,
“Performance of low-complexity Rake reception in a realistic
UWB channel,” in Proceedings of the IEEE International
Conference on Communications (ICC ’02), vol. 2, pp. 763–767,
May 2002.
[8] J. D. Choi and W. E. Stark, “Performance of ultra-wideband
communications with suboptimal receivers in multipath
channels,” IEEE Journal on Selected Areas in Communications,
vol. 20, no. 9, pp. 1754–1766, 2002.
[9] M.Z.WinandR.A.Scholtz,“Ontheenergycaptureofultraw-
ide bandwidth signals in dense multipath environments,” IEEE
Communications Letters, vol. 2, no. 9, pp. 245–247, 1998.
[10] V. Lottici, A. D’Andrea, and U. Mengali, “Channel estimation
for ultra-wideband communications,” IEEE Journal on Selected
Areas in Communications, vol. 20, no. 9, pp. 1638–1645, 2002.
[11] R. Hoctor and H. Tomlinson, “Delay-hopped transmitted-
reference RF communications,” in Proceedings of the IEEE Con-
ference on Ult ra Wideband Systems and Technologies (UWBST
’02), pp. 265–269, May 2002.
[12] Y L. Chao and R. A. Scholtz, “Optimal and suboptimal
receivers for ultra-wideband transmitted reference systems,” in
Proceedings of the IEEE Global Telecommunications Conference
(GLOBECOM ’03), pp. 759–763, December 2003.
[13] T. Q. S. Quek and M. Z. Win, “Analysis of UWB transmitted-
reference communication systems in dense multipath chan-
nels,” IEEE Journal on Selected Areas in Communications, vol.
23, no. 9, pp. 1863–1874, 2005.
[14] L. Yang and G. B. Giannakis, “Optimal pilot waveform assisted
modulation for ultrawideband communications,” IEEE Trans-
actions on Wireless Communications, vol. 3, no. 4, pp. 1236–
1249, 2004.
[15]S.Zhao,H.Liu,andZ.Tian,“Decisiondirectedautocor-
relation receivers for pulsed ultra-wideband systems,” IEEE
Transactions on Wireless Communications,vol.5,no.8,pp.
2175–2184, 2006.
[16] N. Guo and R. C. Qiu, “Improved autocorrelation demodu-
lation receivers based on multiple-symbol detection for UWB
communications,” IEEE Transactions on Wireless Communica-
tions, vol. 5, no. 8, pp. 2026–2031, 2006.
[17] V. Lottici and Z. Tian, “Multiple symbol differential detection
for UWB communications,” IEEE Transactions on Wireless
Communications, vol. 7, no. 5, pp. 1656–1666, 2008.
[18] J. Jald
´
en and B. Ottersten, “On the complexity of sphere
decoding in digital communications,” IEEE Transactions on
Signal Processing, vol. 53, no. 4, pp. 1474–1484, 2005.
[19] S. Gezici, H. Kobayashi, H. V. Poor, and A. F. Molisch,
“Performance evaluation of impulse radio UWB systems with
pulse-based polarity randomization,” IEEE Transactions on
Signal Processing, vol. 53, no. 7, pp. 2537–2549, 2005.
[20] A. A. M. Saleh and R. A. Valenzuela, “A statistical model for
indoor multipath propagation,” IEEE Journal on Selected Areas
in Communications, vol. 5, no. 2, pp. 128–137, 1987.