Báo cáo hóa học: "Research Article Low-Complexity One-Dimensional Edge Detection in Wireless Sensor Networks" ppt
Bạn đang xem bản rút gọn của tài liệu. Xem và tải ngay bản đầy đủ của tài liệu tại đây (1.04 MB, 13 trang )
Hindawi Publishing Corporation
EURASIP Journal on Wireless Communications and Networking
Volume 2010, Article ID 751520, 13 pages
doi:10.1155/2010/751520
Research Article
Low-Complexity One-Dimensional Edge Detection in Wireless
Sensor Networks
Marco Martal
`
o and Gianluigi Ferrari
WASN Laboratory, Department of Information Engineering, University of Parma, I-43124 Parma, Italy
Correspondence should be addressed to Marco Martal
`
o,
Received 16 February 2010; Accepted 26 May 2010
Academic Editor: Osvaldo Simeone
Copyright © 2010 M. Martal
`
o and G. Ferrari. This is an open access article distributed under the Creative Commons Attribution
License, which permits unrestricted use, distribution, and reproduction in any medium, provided the original work is properly
cited.
In various wireless sensor network applications, it is of interest to monitor the perimeter of an area of interest. For example, one
may need to check if there is a leakage of a dangerous substance. In this paper, we model this as a problem of one-dimensional edge
detection, that is, detection of a spatially nonconstant one-dimensional phenomenon, observed by sensors which communicate
to an access point (AP) through (possibly noisy) communication links. Two possible quantization strategies are considered at
the sensors: (i) binary quantization and (ii) absence of quantization. We first derive the minimum mean square error (MMSE)
detection algorithm at the AP. Then, we propose a simplified (suboptimum) detection algorithm, with reduced computational
complexity. Noisy communication links are modeled either as (i) binary symmetric channels (BSCs) or (ii) channels with additive
white Gaussian noise (AWGN).
1. Introduction and Related Work
Sensor networks have been an active research field in the
last years [1]. In particular, many civilian applications have
been developed on the basis of this technology, for example,
for environmental monitoring [2]. Several frameworks have
been proposed for the analysis of sensor networks with
a common binary phenomenon under observation [3–6].
While there are scenarios where the presence of a common
phenomenon is meaningful, in other scenarios one may be
interested in determining where the physical phenomenon
changes its status (e.g., from presence to absence, or vice
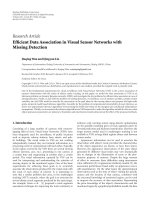
versa). As an illustrative example, consider the scenario
shown in Figure 1(a). Suppose that in a given area there is a
chemical facility where a dangerous gas is used. Obviously,
it is of interest to detect any gas leakage. To this purpose,
one may place a linear sensor network surrounding this
area: in the example in Figure 1(a) there are six sensors.
(In the remainder of this paper, by “sensor” we will denote
the wireless transceiver which includes the sensing element.
However, it has also (limited) processing capabilities and can
communicate with the AP.) At a given time, it may happen
that there is a leakage: some of the sensors (namely, sensors
s
2
, s
3
, s
5
,ands
6
in Figure 1(b)) thus detect the presence
of the gas (namely, sensors s
2
, s
3
, s
5
,ands
6
) whereas the
remaining sensors (namely, s
1
and s
4
)donot.Thisproblem
reduces to a distributed detection problem of a spatially
nonconstant binary phenomenon, as shown in Figure 1(c)
and described in more detail later. We remark that this
is an illustrative example of a possible one-dimensional
edge detection application. Our goal is to show how low-
complexity distributed detection can be successfully applied
to solve a general one-dimensional edge detection problem.
In [7], the authors consider a scenario with a single
phenomenon status change (denoted, in the following,
as edge) and propose a framework, based on minimum
mean square error (MMSE) estimation, to determine the
position of this edge. In [8], under the assumption of
proper regularity of the observed edge, a reduced complexity
MMSE decoder is proposed. In [9], the authors show
that an MMSE decoder is unfeasible for large-scale sensor
networks, due to its computational complexity, and propose
a distributed detection strategy based on factor graphs
and the sum product algorithm. Moreover, MMSE-based
distributed detection schemes have also been investigated
in scenarios with (i) a common binary phenomenon under
2 EURASIP Journal on Wireless Communications and Networking
observation and (ii) bandwidth constraints [10]. In [11, 12],
the authors examine the problem of determining edges
of natural phenomena through proper processing of data
collected by sensor networks. In these papers, particular
attention is devoted to the estimation accuracy, given in
terms of the confidence interval of the results obtained with
the proposed framework.
The problem of edge detection is also well known in the
realm of image processing, where it may be of interest to
characterize the intensity changes in the processed image.
In [13], the authors characterize, from a theoretical point of
view, the types of possible intensity changes. In [14], using
numerical optimization, optimal operators are preliminary
derived for ridge and roof edges, and then specialized for
step edges. In [15], the edge detection problem is tackled as
a statistical inference problem. Other interesting approaches
to edge detection, especially for noisy information fusion
scenarios, are proposed in [16, 17].
In [18], we have proposed a preliminary analytical
approach to the design of decentralized detection schemes
for scenarios with spatially nonconstant binary phenomena,
that is, phenomena with status (either “0” or “1”) which
may vary from sensor to sensor. We have also derived MMSE
detection algorithms at the access point (AP), considering
different quantization strategies at the sensors. In order
to make our approach practical, a simplified detection
algorithm, with a computational complexity much lower
than that of the MMSE detection rule, has been proposed.
In this paper, we extend the approach presented in [18]to
network scenarios where the communication links between
the sensors and the AP may be noisy. These links are modeled
either as binary symmetric channels (BSCs) or as additive
white Gaussian noise (AWGN) channels. In particular, we
study the relative impacts of communication and observa-
tion noises on the system performance, evaluated in terms of
(i) distance between estimated and true phenomena and (ii)
probability of local status estimation error (LSEE). As will
be shown in the following, the proposed simplified detection
algorithm incurs a limited performance loss with respect
to the MMSE algorithm, yet guaranteeing a remarkable
complexity reduction. Finally, the robustness and complexity
of the proposed algorithms are investigated.
The structure of this paper is the following. In
Section 2, we give preliminaries on decentralized detection.
In Section 3, we derive the optimum MMSE detection rules
at the AP in a scenario with noisy communication links and
multiedge phenomena. In Section 4, we propose a simplified
detection algorithm in order to reduce the computational
complexity of the proposed decentralized detection scheme.
In Section 5, numerical results on the performance of
the proposed detection algorithms are presented. Finally,
concluding remarks are given in Section 6.
2. Preliminaries on Decentralized Detect ion
As anticipated in Section 1,wefocusonanetworkscenario
where the status of the phenomenon under observation is
characterized by a number N
bs
of “edges,” that is, sensor
positions where the phenomenon changes its status from
“0” (e.g., absence of a critical gas) to “1” (e.g., presence of
a critical gas) or vice versa. For the sake of simplicity, we
assume that the status of the phenomenon is independent
from sensor to sensor. The proposed approach, however, can
be extended to take into account the presence of correlation
between sensors. In general, the presence of correlation
would limit the number of edges and, if properly exploited
at the AP, improve the performance with respect to that
obtained in the following. A pictorial description of the
proposed scenario is given in Figure 1(c).Inparticular,we
investigate the performance when the communication links
between the sensors and the AP are noisy, that is, errors may
be introduced during data transmission. Note that, under the
assumption that the geographical positions are known, from
the estimated edges’ positions the real geographic structure
of the phenomenon (e.g., area with gas leakage) can be
immediately determined.
Denote the overall phenomenon status as H
=
[H
1
, , H
N
], where H
i
∈{0, 1} is the status at the ith sensor
(i
= 1, ,N). The signal observed at the ith sensor can be
expressed as
r
i
= c
E,i
+ n
i
,
(1)
where
c
E,i
⎧
⎨
⎩
0, if H
i
= 0,
s,ifH
i
= 1,
(2)
and
{n
i
} are additive observation noise samples. Assuming
that the noise samples
{n
i
} are independent with the same
Gaussian distribution N (0, σ
2
), the common signal-to-noise
ratio (SNR) at the sensors can be defined as follows:
SNR
sensor
=
E
c
E,i
| H
i
= 1
−E
c
E,i
| H
i
= 0
2
σ
2
=
s
2
σ
2
.
(3)
Each sensor processes (through proper quantization) the
observed signal and the value output by the ith sensor is
denoted as d
i
f
quant
(r
i
), where the function f
quant
(·)
depends on the specific quantization strategy. In the follow-
ing, we consider (i) binary quantization and (ii) absence
of quantization. The analytical framework in the case of
multilevel quantization can be easily derived from that
presented in [18] for a scenario with ideal communication
links. Upon reception of the messages sent by the sensors, the
goal of the AP is to estimate, through MMSE or simplified
detection strategies, the status of the binary phenomenon
H. As reference performance indicator, we will consider
the quadratic distance (simply referred to as “distance”) D
between the observed phenomenon H and its estimate
H,
that is,
D
H,
H
H ⊕
H
2
,
(4)
where the notation
⊕ stands for bit-by-bit EX-OR and
H is
the estimated phenomenon. Given that α
= [α
1
, , α
N
bs
]
EURASIP Journal on Wireless Communications and Networking 3
s
2
s
3
s
4
s
5
s
6
s
1
Chemical
facility
AP
Monitored area
(a)
s
2
s
3
s
4
s
5
s
6
s
1
Chemical
facility
AP
Monitored area
(b)
s
2
s
3
s
4
s
1
s
5
s
6
n
i
r
i
c
E,i
d
i
AP
0011 11
01 1110
Noisy
communication
links
Sensors
Observation
noise
Phenomenon status
at the i-th sensor
Phenomenon
MMSE or simplified detector
(c)
Figure 1: Illustrative scenario of interest: (a) a chemical facility processing dangerous gas; (b) scenario after gas leakage; (c) logical
representation of the sensor network.
are the true edges’ positions,
H = [
H
1
, ,
H
N
]canbe
directly derived from the estimated edges’ positions
α =
[α
1
, , α
N
bs
].Therefore,ourgoalistoaccuratelyestimate
α. The particular expression for
α depends on the chosen
distributed detection strategy, as will be shown in the fol-
lowing. We will also consider, as a meaningful performance
indicator, the probability of LSEE, that is, the probability that
the estimated phenomenon status at a sensor is wrong. In
Section 5.2, it will be shown how the probability of LSEE is
related to D.
3. MMSE One-Dimensional Edge Detection
The following assumptions are expedient to simplify the
derivation of the MMSE one-dimensional edge detection
strategy:
(i) the edges cannot be in correspondence to the first
sensor and the last sensor: the number of edges must
then be such that 1
≤ N
bs
≤ N − 2 (in particular,
H
N
= H
N−1
);
(ii) the phenomenon status is perfectly known at the first
sensor: without loss of generality, we assume H
1
= 0.
According to the above assumptions, the positions of the N
bs
edges {α
1
, , α
N
bs
} have to satisfy the following conditions:
2
≤ α
1
<α
2
< ···<α
k−1
<α
k
< ···<α
N
bs
≤ N −1.
(5)
Therefore, between positions 1 and α
1
− 1 the phenomenon
status is “0,” between positions α
1
and α
2
− 1 the phe-
nomenon status is “1,” and so on. The following bound on
the position of the kth edge must necessarily hold:
k +1<α
k
≤
(
N
−1
)
−
(
N
bs
−k
)
= N −N
bs
+ k − 1,
k
= 1, , N
bs
.
(6)
For each value of k, condition (6) formalizes the intuitive idea
that the kth edge cannot fall beyond the (N
−1 −N
bs
+ k)th
position, in order for the successive (remaining) N
bs
−k edges
to have admissible positions.
In the remainder of this section, we derive the MMSE
detection rules depending on the quantization strategy at the
sensors.
3.1. Binary Quantization. In this scenario, the ith sensor
makes a decision comparing its observation r
i
with a
4 EURASIP Journal on Wireless Communications and Networking
threshold value τ
i
, and computes a local binary decision d
i
=
f
quant
(r
i
) = U(r
i
−τ
i
), where U(·) is the unit step function. To
optimize the system performance, the thresholds
{τ
i
}need to
be properly selected. In this paper, regardless of the value of
N,acommonvalueτ
s/2atallsensorsisconsidered[18].
In the presence of binary quantization at the sensors, the
noisy communication links are modeled as BSCs. We denote
as d the sequence of binary decisions at the sensors and d
AP
as
the sequence of binary decisions received at the AP. Under the
assumption of BSCs, the received decisions d
AP
might differ
from d (there could be “bit-flipping” in some of the links). In
particular, the ith decision received at the AP (i
= 1, ,N)
can be expressed as
d
AP
i
=
⎧
⎨
⎩
d
i
,withprobability
1 − p
,
1
−d
i
,withprobabilityp,
(7)
where p is the cross-over probability of the BSC.
Theorem 1. Assuming that N
bs
isknownattheAPand
denoting by α
= (α
1
, , α
N
bs
) the positions of the edges, the
kth (k
= 1, , N
bs
)MMSEdetectededgecanbeexpressedas
α
k
=
N−N
bs
+k−1
α
k
=k+1
α
k
P
α
k
| d
AP
.
(8)
(For ease of notational simplicity, in (8) we use the same symbol
α
k
to denote both the random variable (in the second term) and
its realization (in the third and fourth terms). This simplified
notational approach w ill be considered in the remainder of
Section 3. The context should eliminate any ambiguity.)
Proof. The MMSE detection strategy leads to the selection of
the following vector of edges [19]:
α = E
α | d
AP
. (9)
The kth component (k
= 1, , N
bs
)ofthevectorα can then
be written as
α
k
= E
α
k
| d
AP
=
N
α
k
=1
α
k
P
α
k
| d
AP
.
(10)
Taking into account the constraint (6), the upper and lower
limits of the sum in (10) can be further refined, obtaining the
right-hand side expression in (8).
The computation of the conditional probabilities appear-
ing at the right-hand side of (8) can be carried out as
outlined in Appendix A.1.
3.2. Absence of Quantization. In this case, a local likelihood
value, such as the conditional probability density function
(PDF) of the observable, is transmitted from each sensor
to the AP. Obviously, this is not a practical approach, since
an infinite bandwidth would be required to transmit a
PDF value. However, investigating this case allows to derive
useful information about the limiting performance of the
considered detection schemes, since transmission of the
PDFs of the observables does not entail any information
loss at the sensors. Note that this limiting performance can
be achieved by using multilevel quantization at the sensors
with an increasing number of quantization bits [18]. Since
the sensors transmit real numbers (the likelihood values)
to the AP, the BSC model for noisy communication links
does not apply. In order to obtain results comparable with
those associated with a scenario with binary quantization, we
consider AWGN communication links. In other words, the
ith observable at the AP (i
= 1, , N), denoted as r
AP
i
,can
be written as
r
AP
i
= r
sensor
i
+ n
comm
i
,
(11)
where r
sensor
i
is the observable transmitted by the ith sensor
and n
comm
i
has a Gaussian distribution N (0,σ
2
comm
). The
value of σ
2
comm
is set in order to make the AWGN scenario
consistent with the BSC scenario. In particular, in the
presence of uncoded binary phase shift keying (BPSK)
transmission over AWGN links, the bit error rate is [20]
BER
= Q
E
b
σ
2
comm
(12)
with Q(x)
∞
x
(1/
√
2π)exp(−y
2
/2)dy. Therefore, imposing
that the BER in (12) is equal to the cross-over probability p of
the equivalent BSC, the corresponding value of σ
2
comm
can be
obtained. This makes the performance comparison between
the cases with binary quantization and without quantization
consistent.
Theorem 2. Assuming that N
bs
is known at the AP, the kth
(k
= 1, , N
bs
) MMSE detected edge can be recursively
computed from
α
k
= E
α
k
| r
AP
=
N−N
bs
+k−1
α
k
=k+1
α
k
P
α
k
| r
AP
.
(13)
Proof. The proof follows exactly that of Theorem 1,butfor
replacing d
AP
with r
AP
.
The computation of the conditional probabilities appear-
ing at the right-hand side of (13) can be carried out as
outlined in Appendix A.2.
3.3. Remarks. We would like to remark that the MMSE
strategy outlined above is based, regardless of the quan-
tization strategy, on the assumption of knowledge of the
number of edges N
bs
at the AP. However, in the scenario
of interest, for example, monitoring of a gas leakage, this
knowledge may not be a priori available and N
bs
should be
properly estimated. In this case, by averaging over all possible
realizations of N
bs
, the average performance, with respect to
the number of edges, could be determined. This extension
goes beyond the scope of this paper. In fact, the performance
of the MMSE algorithm with knowledge of N
bs
at the AP will
be used as a benchmark for the performance of the simplified
(and feasible) one-dimensional edge detection algorithms
introduced in Section 4.
EURASIP Journal on Wireless Communications and Networking 5
4. Simplified One-Dimensional Edge Detection
Since the computational complexity of the MMSE detec-
tion strategy increases very quickly with the number of
phenomenon edges (see Section 5.4 for more details), the
derivation of a simplified distributed detection algorithm
with low complexity (but limited performance loss) is
crucial. As considered in Section 3 for MMSE detection, we
distinguish between scenarios with binary quantization and
without quantization.
4.1. Binary Quantization. Define the following “reconstruc-
tion” function:
f
bq
k, d
AP
k
, p
1 − 2p
k
i=1
P
H
i
= 0 | d
AP
i
−
P
H
i
= 1 | d
AP
i
,
(14)
where d
AP
k
= (d
AP
1
, , d
AP
k
)(k = 1, , N) and the
conditional probabilities
{P(H
i
= | d
AP
i
)} are eval-
uated in Appendix B.1. The key idea of our approach is
the following. While the phenomenon does not change
its status, the function f
bq
(k, d
AP
k
, p) is a monotonically
increasing (or decreasing) function of k. In correspondence
to each change of the phenomenon status, the function
f
bq
(k, d
AP
k
, p) changes its monotonic behavior. More pre-
cisely, a phenomenon variation from “0” to “1” corresponds
to a change, trendwise, from increasing to decreasing; a
phenomenon variation from “1” to “0” corresponds to a
change, trendwise, from decreasing to increasing. Therefore,
through the monotonicity changes of f
bq
one can detect the
positions of the edges. Moreover, since p
∈ (0, 0.5) it follows
that the term (1
− 2p) is always positive and, therefore, can
be neglected to study the monotonicity of f
bq
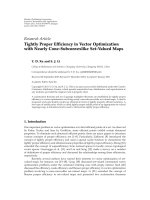
.Anillustrative
example of the behavior of f
bq
is shown in Figure 2,where
the phenomenon under observation and the reconstruction
function are shown, together with the detected edges. In this
pictorial example, the estimated phenomenon coincides with
the observed phenomenon.
4.2. Absence of Quantization. In the absence of quantization
at the sensors, one can define the following reconstruction
function:
f
nq
k, r
AP
k
k
i=1
P
H
i
= 0 | r
AP
i
−
P
H
i
= 1 | r
AP
i
(15)
where r
AP
k
= (r
AP
1
, , r
AP
k
)(k = 1, , N)and{P(H
i
=
| r
AP
i
)} are computed in Appendix B.2. The edge detection
algorithm at the AP is then identical to that presented in the
case with binary quantization, but for the use of f
nq
at the
place of f
bq
.
4.3. Remarks. One should observe that, unlike the MMSE
strategy, our simplified edge detection algorithm (with
f
bq
Phenomenon
Estimated boundaries
1
1
2
2345 678
k
Figure 2: Illustrative example: the phenomenon under observation
(solid line with circles) and the corresponding reconstruction
function f
bq
in (14) (dashed arrows). The estimated edges are
indicated by vertical arrows.
binary quantization and no quantization, resp.) does not
require knowledge of the number of edges N
bs
at the
AP. Therefore, the simplified algorithm is suitable for area
monitoring applications, since in this scenario N
bs
is not
a priori known. Obviously, we expect that the proposed
algorithm will incur a performance degradation with respect
to the MMSE algorithm. However, this loss will be limited, as
shown with simulation results in Section 5.
5. Numerical Results
5.1. Perfor mance Analysis: Distance. The performance of the
proposed detection schemes is first analyzed by evaluating of
the distance D
= D(H,
H) between the true phenomenon
H and the estimated phenomenon
H. More precisely, the
Monte Carlo simulation results are obtained through the
following steps:
(1) the number of edges is randomly generated—the AP
is assumed to know this number in the MMSE case;
(2) for a selected number of edges, their positions are
randomly generated (From an operative viewpoint,
in a scenario where the number of edges is larger than
one, after the position of an edge is extracted, the
following edge position is randomly chosen among
the remaining positions. After all edges’ positions are
extracted, they are ordered.) ;
(3) either the sensors’ decisions or the PDFs of the
observables, according to the chosen quantization
strategy at the sensors, are transmitted to the AP;
(4) a noisy version of the transmitted data is received at
the AP;
(5) the AP detects the edges’ positions through either
MMSE or simplified detection algorithms;
(6) the distance D is evaluated, on the basis of the
detected sequence of edges’ positions;
(7) steps (1)
÷ (6) are repeated for sufficiently large
number of times in order to derive statistically
meaningful results;
6 EURASIP Journal on Wireless Communications and Networking
MMSE
Simplified
0
0
5
10
D
15
20
0.1 0.2 0.3
p
0.4 0.5
SNR
sensor
= −10 dB
SNR
sensor
= 0dB
SNR
sensor
= 10 dB
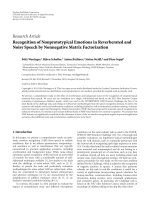
Figure 3: Distance, as a function of the cross-over probability p,
in a scenario with N
= 8 sensors and binary quantization. Three
values for the sensor SNR are considered: (i)
−10 dB, (ii) 0 dB, and
(iii) 10 dB. Both MMSE and simplified detection algorithms at the
AP are considered.
(8) the average distance D is finally computed as the
arithmetic average of the distances computed at the
previous iterations (in step (6) at each iteration).
In Figure 3, the distance is shown, as a function of the
cross-over probability p, in a scenario with N
= 8sensors
and binary quantization—in this case, the communication
links are modeled as BSCs. Three values for the sensor SNR
are considered: (i)
−10 dB, (ii) 0 dB, and (iii) 10 dB. Both
MMSE and simplified detection algorithms at the AP are
considered. As expected, the use of the simplified detection
algorithm at the AP leads to a performance worse than
that with the MMSE detection algorithm. However, the
higher is the sensor SNR, the lower is the difference between
the performance of the two algorithms. Moreover, one can
observe that the distance might not converge to zero (as in
the case with ideal communication links), due to the presence
of two independent noise components (i.e., observation and
communication noises). For a sufficiently large value of the
sensor SNR, however, the distance reduces to zero when p
tends to zero, in agreement with the results in [18].
In Figure 4, the distance
D is shown, as a function of
the sensor SNR, in a scenario with N
= 8 sensors and
binary quantization at the sensors. Four different values of
the cross-over probability p are considered: (i) 0.1, (ii) 0.2,
(iii) 0.3, and (iv) 0.4. The performance with both MMSE
and simplified detection algorithms at the AP is investigated.
Unlike the results presented in [18] for a scenario with
ideal communication links, there appears to be a distance
floor (higher than zero) for larger and larger values of the
sensor SNR. This is to be expected, since the communication
noise (independent of the observation noise at the sensors)
prevents the AP from correctly recovering the data sent by
the sensors. In particular, when the cross-over probability
is sufficiently large (e.g., p
= 0.4), the performance does
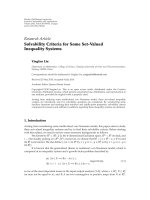
MMSE
Simplified
−20
0
3
6
9
D
12
15
−15 −10 −550
SNR
sensor
(dB)
10 15 20
p
= 0.1
p
= 0.2
p
= 0.3
p
= 0.4
Figure 4: Distance, as a function of the sensor SNR, in a scenario
with N
= 8 sensors and binary quantization. Four different values
of the cross-over probability p are considered: (i) 0.1, (ii) 0.2, (iii)
0.3, and (iv) 0.4. Both MMSE and simplified detection algorithms
at the AP are considered.
not depend on the value of the sensor SNR, since the noisy
communication links make the data sent by the sensors
very unreliable, regardless of the observation quality. Finally,
one can observe that, for small values of the sensor SNR,
the simplified detection algorithm shows a nonnegligible
performance loss with respect to the MMSE detection
algorithm. However, this loss reduces to zero, for increasing
values of the sensor SNR, only for sufficiently small values
of p. In other words, if the communication links are not
reliable, then increasing the accuracy of the observations at
the sensors is useless.
In Figure 5 the distance
D is shown, as a function of the
sensor SNR, in a scenario with N
= 8 sensors and absence of
quantization—in this case, the noisy communication links
are modeled as AWGN channels. Two different values of
the bit error rate p (corresponding to different values of
σ
2
comm
according to (12)) are considered: (i) 0.1 and (ii) 0.2.
The performance of both MMSE and simplified detection
algorithms at the AP is evaluated. One can observe that,
unlike the case with binary quantization at the sensors, the
distance reduces to zero when the sensor SNR increases,
that is, no floor appears. Moreover, the distance with the
simplified detection rule at the AP approaches that with
the MMSE detection rule, that is, it reduces to zero. This
means that the proposed simplified detection algorithm is
(asymptotically) effective. Obviously, this is only a theoretical
performance limit. In fact, even if the communication links
were noisy, the transmission of the “exact” observables
(requiring an infinite bandwidth) from the sensors would
allow a correct estimation of the true phenomenon. This can-
not happen in realistic scenarios with limited transmission
bandwidths.
In order to evaluate the loss incurred by the use of the
simplified detection algorithm, it is expedient tointroduce
EURASIP Journal on Wireless Communications and Networking 7
−20
0
3
6
9
D
12
15
−16 −12 −8 −4
SNR
sensor
(dB)
40 8 12 16 20
MMSE detection rule, p
= 0.1
MMSE detection rule, p
= 0.2
Simplified detection rule, p
= 0.1
Simplified detection rule, p
= 0.2
Figure 5: Distance, as a function of the sensor SNR, in a scenario
with N
= 8 sensors and absence of quantization. Two different
values of the equivalent bit error rate p (corresponding to different
values of σ
2
comm
according to (12)) are considered: (i) 0.1 and (ii)
0.2. Both MMSE and simplified detection algorithms at the AP are
considered.
the following percentage loss:
L
D
simp
−D
MMSE
D
MMSE
Te r m
1
·
D
simp
−D
MMSE
N
2
Te r m
2
,
(16)
where
D
simp
and D
MMSE
correspond to the distances obtained
with the simplified and MMSE detection algorithms, respec-
tively. The intuition behind the definition of L in (16),
corresponding to the geometric average of Term
1
and Term
2
,
is the following. Term
1
represents the relative loss of the
simplified detection rule with respect to the MMSE detection
rule. However, using only this term could be misleading.
In fact, for high sensor SNRs, the terms
D
simp
and D
MMSE
aremuchlowerthanN
2
(the maximum possible distance).
Therefore, even if
D
simp
> D
MMSE
(e.g., D
simp
= 4and
D
MMSE
= 1withN = 32), both algorithms might
perform very well. The introduction of Term
2
eliminates
this ambiguity, since it represents the relative loss (between
MMSE and simplified detection algorithms) with respect to
the maximum (quadratic) distance, that is, N
2
.InFigure 6,
the behavior of L is shown, as a function of the sensor SNR, in
a scenario with N
= 8. In the region of interest (SNR
sensor
≥
0 dB), one can observe that L is lower than 20%, that is, the
proposed simplified detection algorithm is effective.
In Figure 7(a), we investigate the distance, as a function
of the cross-over probability p, in a scenario with binary
quantization. Three values for the number of sensors are
considered: (i) 16, (ii) 32, and (iii) 64. For each number of
sensors, the sensor SNR assumes three possible values: (i)
−10 dB, (ii) 0 dB, and (iii) 10 dB. In these scenarios, only
−20
0
10
20
SNR
sensor
(dB)
L (%)
30
40
−16 −12 −8 −440 8 12 16 20
No quantization, p
= 0
No quantization, p
= 0.1
No quantization, p
= 0.2
Binary quantization, p
= 0.2
Binary quantization, p
= 0.1
Binary quantization, p
= 0
Figure 6: Percentage loss, as a function of the sensor SNR, in
a scenario with N
= 8 and simplified detection algorithm at
the AP. Both absence of quantization and binary quantization
at the sensors. Three values for p are considered: (i) 0 (ideal
communication links), (ii) 0.1, and (iii) 0.2.
the simplified detection algorithm is considered, since the
computational complexity of the MMSE detection algorithm
becomes unfeasible (see Section 5.4). In all cases, the distance
is a monotonically nondecreasing function of p,butitmight
notconvergetozeroforp
→ 0
+
, because of the residual
observation noise. For a sufficiently high value of the sensor
SNR, however, the distance becomes very low when p
→ 0
+
,
in agreement with the results in Figure 3. Moreover, note that
for p
= 0.5 the distance, for a given number of sensors,
reaches the same value, regardless of the sensor SNR. This is
due to the fact that, when p
= 0.5, the AP receives “random”
decisions and its estimate
H is extracted randomly among all
possible ones for the corresponding number of edges. This
limit (for p
= 0.5), denoted as D
rand
, depends only on N and
in Appendix C we derive a simple analytical approximation
for it.
In order to better understand the impacts of the commu-
nication and observation noises, it is expedient to normalize,
sensor SNR by sensor SNR,
D = D(SNR
sensor
, p, N)by
D
rand
(N). In this way, the normalized distance D/D
rand
,
denoted as
D
norm
= D
norm
(SNR
sensor
, p, N), assumes values
in [0, 1] and allows to directly compare scenarios with
different numbers of sensors. The normalized versions of
the distance curves of Figure 7(a) are shown in Figure 7(b).
Obviously, when p
= 0.5 the distance goes to the same
value (i.e., 1), regardless of the values of N and SNR
sensor
.
Asexpected,foragivenvalueofp (i.e., the communication
quality), the higher the sensor SNR is (i.e., the observation
quality) the more pronounced is the performance degrada-
tion for increasing values of N.
8 EURASIP Journal on Wireless Communications and Networking
0
10
−1
10
0
10
1
D
10
2
10
3
N = 64
N
= 32
N
= 16
0.10.20.3
p
0.40.5
SNR
sensor
= −10 dB
SNR
sensor
= 0dB
SNR
sensor
= 10 dB
(a)
0
10
−4
10
−3
10
−2
D
norm
10
−1
10
0
SNR
sensor
= 0dB
SNR
sensor
= 10 dB
0.1
SNR
sensor
= −10 dB
0.20.3
p
0.40.5
N
= 16
N
= 32
N
= 64
(b)
Figure 7: Distance, as a function of the cross-over probability p,
in a scenario with binary quantization and simplified detection
algorithm. Three values for the number of sensors are considered:
(i) 16, (ii) 32, and (iii) 64. For a given number of sensors, three
values for the sensor SNR are analyzed: (i)
−10 dB, (ii) 0 dB, and
(iii) 10dB. In case (a), the distance is shown, whereas in case (b)
the distance is normalized, for each value of N, to its corresponding
maximum value (
D(p = 0.5)).
5.2. Performance Analysis: Probability of Local Status Estima-
tion Error. Considering the same Monte Carlo simulation
scenario described at the beginning of Section 5.1, the
probability of LSEE can be approximated as follows:
P
LSEE
1
N
trials
N
trials
i=1
P
(i)
LSEE
,
(17)
−5
10
−6
10
−5
10
−4
10
−3
P
LSEE
10
−2
10
−1
SNR
sensor
(dB)
0 5 10 15 20
MMSE detection rule, p
= 0.1, UB
MMSE detection rule, p
= 0.2, UB
Simplified fusion rule, p
= 0.1, UB
Simplified fusion rule, p
= 0.2, UB
MMSE detection rule, p
= 0.1
Figure 8: Probability of LSEE, as a function of the sensor SNR, for
the same cases shown in Figure 5. For the MMSE case with p
= 0.1,
the exact performance and the UB are shown. For the other cases,
only the UBs are shown.
where N
trials
is the number of simulation runs, and P
(i)
MD
is
the probability of LSEE at the ith simulation run and can be
written as
P
(i)
LSEE
D
i
N
,
(18)
where D
i
is the distance at the ith simulation run. It then
follows:
P
LSEE
1
N
trials
N
trials
i=1
D
i
N
=
1
N
N
trials
i=1
D
i
N
trials
−→
N
trials
→∞
1
N
√
D.
(19)
Observing that
√
· is a concave function and by using the
Jensen inequality [21], one can write
√
D = E
√
D
≤
E
[
D
]
=
D.
(20)
Therefore, the probability of LSEE can be upper bounded as
follows:
P
LSEE
D
N
.
(21)
In other words, the evaluation of the average distance
D
allows to directly derive un upper bound (UB) on the
probability of LSEE. In Figure 8, the probability of LSEE is
shown, as a function of the sensor SNR, for the same cases
EURASIP Journal on Wireless Communications and Networking 9
shown in Figure 5 (note that similar considerations hold for
all other scenarios considered in Section 5.1). For the sake
of graphical clarity, the exact performance is reported only
for the scenario with the MMSE detection rule and p
= 0.1.
However, in all cases the maximum SNR distance between
the UB and the true curve is less than 2 dB (for P
LSEE
≤
10
−2
). From the results in Figure 8, a bimodal behavior of the
probability of LSEE can be observed. In fact, this probability
decreases very slowly, for increasing SNRs, till a value around
10
−2
, below which it drops very rapidly to zero. The knee of
the probability of LSEE is placed at an SNR which depends
on the chosen detection (MMSE or simplified) strategy and
on the communication noise level. Note that at very low SNR
the probability of LSEE tends to be 0.5, that is, it randomly
decides on the phenomenon status at each sensor.
5.3. System Robustness. We now investigate the robustness of
the proposed simplified distributed detection algorithm with
respect to possible mismatches between the actual system
parameters and the used ones. In particular, we focus on a
scenario with binary quantization at the sensors. Our conclu-
sions hold also in other scenarios with different quantization
strategies. In order to investigate the system robustness,
we consider possible mismatches in the observation and
communication phases, respectively.
(i) In the observation phase, we assume that there could
be an error in the decision threshold used at each
sensor. More precisely, denoting by
τ the optimized
decision threshold (
τ /2), we assume that each
sensor makes use of an actual decision threshold
which is uniformly distributed in [
τ −η
o
τ, τ + η
o
τ],
where η
o
∈ [0, 1]. The decision thresholds at different
sensors are supposed to be independent.
(ii) In the communication phase, we assume that, while
the detection algorithm at the AP assumes a constant
cross-over probability (denoted as
p) for all com-
munication links, the actual cross-over probabilities
in the various links are independent and uniformly
distributed in the [
p−η
c
p, p+η
c
p], where η
c
∈ [0, 1].
For the sake of simplicity, we consider a scenario with
N
= 8 sensors, binary quantization at the sensors, and
simplified detection rule at the AP. In Figure 9, we show the
performance results, in terms of distance versus (a) η
o
and
(b) η
c
, in the presence of mismatches in the (a) observation
phase and (b) communication phases, respectively. In case
(a), three values of the cross-over probability p of the
communication links are considered: (i) 0, (ii) 0.2, and (iii)
0.5. In case (b), three values are considered for the average
cross-over probability
p: (i) 0.1, (ii) 0.2, and (iii) 0.5. For
each value of p or
p, three values for the sensor SNR are
considered: (i)
−10 dB, (ii) 0 dB, and (iii) 10 dB.
In case (a), one can observe that, for sufficiently high
values of the communication noise intensity p, there is
a performance degradation (i.e., the distance increases)
for increasing observation threshold mismatch (i.e., for
increasing values of η
o
), regardless of the sensor SNR.
On the other hand, for low values of the communication
0
0
5
10
D
15
20
p
= 0
p
= 0.5
p
= 0.2
0.2
SNR
sensor
= −10 dB
SNR
sensor
= 0dB
SNR
sensor
= 10 dB
0.40.6
η
o
0.81
(a)
0
0
5
10
D
15
20
p = 0
p = 0.5
p = 0.2
0.2
SNR
sensor
= −10 dB
SNR
sensor
= 0dB
SNR
sensor
= 10 dB
0.40.6
η
c
0.81
(b)
Figure 9: Distance, as a function of (a) η
o
and (b) η
c
,inthepresence
of mismatches in the (a) observation phase and (b) communication
phases, respectively. In all cases, we consider N
= 8 sensors, binary
quantization at the sensors, and simplified detection rule at the AP.
Various combinations of the values of p (in case (a)),
p (in case (b)),
and the sensor SNR are considered.
noise intensity p and very high values of the sensor SNR
(e.g., SNR
sensor
= 10 dB), for increasing values of η
o
the
distance slightly increases. Finally, for low values of the
communication noise intensity p and low/medium values of
the sensor SNR, the distance slightly decreases for increasing
values of η
o
—this is due to the fact that in the presence
of strong observation noise, the considered local decision
strategy is no longer optimized. In all possible situations, the
distance saturates at η
o
= 0.1. In other words, the proposed
simplified detection strategy is robust against local decision
threshold mismatches.
In case (b), instead, the decision threshold τ at the
sensors is fixed to s/2.Asonecansee,forhighvaluesof
p,
10 EURASIP Journal on Wireless Communications and Networking
for increasing variability of the communication link quality
(i.e., for increasing values of η
c
) the performance rapidly
degrades. For low values of
p, for increasing η
c
there is a
slight decrease of the distance, that is, a slight performance
improvement—as previously commented, this depends on
the fact that local sensor decision and AP detection strategies
arenolongeroptimized.Asincase(a),theperformance
with any scheme saturates at η
c
= 0.1, that is, the proposed
simplified detection rule is robust also against mismatches in
the communication phase.
As a final remark, we point out that the fact that the
proposed simplified detection rule is insensitive to strong
fluctuations of the observation and communication qualities
means that the system performance basically depends on the
average observation and communication conditions.
5.4. Computational Complexity. Finally, we evaluate the
improvement, in terms of computational complexity reduc-
tion with respect to the MMSE detection rule, brought by
the use of the simplified detection algorithms. As complexity
indicators, we choose the numbers of additions and mul-
tiplications (referred to as N
s
and N
m
,resp.)requiredby
the considered detection algorithms, evaluated as functions
of the number of sensors N. In a scenario with noisy
communication links, the same considerations carried out in
[18] for a scenario with ideal communication links still hold.
In fact, the structures of the proposed detection algorithms
are the same in both scenarios, since only the expressions
of the used probabilities and PDFs change. Therefore, it can
be shown that the numbers of additions and multiplications
required by the MMSE detection algorithm would be N
opt
s
=
Θ(N
N−2
)andN
opt
m
= Θ(N
N−1
). On the other hand,
the computational complexity of the proposed simplified
detection algorithm is characterized by N
sub−opt
m
= 0and
N
sub−opt
s
= N, showing a significant complexity reduction
with respect to the MMSE detection algorithm—this also
justifies the performance loss at small values of the sensor
SNR.
6. Concluding Remarks
In this paper, we have analyzed the problem of one-
dimensional edge detection in wireless sensor networking
scenarios with noisy communication links. This situation
arises in many practical applications such as those where
an area of interest needs to be actively monitored to detect
the presence of a phenomenon, for example, the presence
of a gas leakage. We have proposed an analytical framework
considering two quantization strategies at the sensors: (i)
no quantization at the sensors and (ii) binary quantization.
In each case, the MMSE detection algorithm at the AP has
been derived and the impacts of relevant network parameters
(e.g., the sensor SNR, the communication noise level, and
the number of sensors) have been investigated. Then, a low-
complexity and feasible detection algorithm, which does not
require any a priori information on the number of edges,
has been derived. We have shown that the performance
penalty induced by the use of the simplified detection
algorithms is asymptotically (for high sensor SNR and low
communication noise level) negligible. Moreover, the sim-
plified detection algorithm has proved to be robust against
system parameters’ variations. Finally, we have quantified the
relevant computational complexity reduction brought by the
use of the simplified detection algorithms with respect to the
MMSE ones.
Appendices
A. Details on the MMSE Distributed
Detection Strategy
A.1. Binary Quantization. The probability P(α
k
| d)(k =
1, , N
bs
) can be obtained by marginalizing the joint
probabilities of the edges’ positions as follows:
P
α
k
| d
AP
=
α
1
···
α
k−1
α
k+1
···
α
n
P
α | d
AP
=
α:α
k
P
α | d
AP
,
(A.1)
where k
= 1, , N
bs
and the notation α : α
k
indicates all
sequences α with α
k
at the kth position.
At this point, one needs to evaluate the joint conditional
probability mass functions (PMFs) at the right-hand side
of (A.1). By applying the Bayes formula and the total
probability theorem [22], after a few manipulations one
obtains
P
α | d
AP
=
P
d
AP
| α
P
(
α
)
×
⎡
⎢
⎣
N−N
bs
α
1
=2
···
N−N
bs
+k−1
α
k
=k+1
···
N−1
α
N
bs
=N
bs
+1
P(d
AP
| α)P(α)
⎤
⎥
⎦
−1
.
(A.2)
We now characterize the three multiplicative terms at the
right-hand side of (A.2). The first multiplicative term at the
right-hand side of (A.2)canbewrittenas
P
d
AP
| α
=
N
i=1
P
d
AP
i
| α
=
α
1
−1
i
0
=1
P(d
AP
i
0
| α)
H
i
0
=0
α
2
−1
i
1
=α
1
P(d
AP
i
1
| α)
H
i
1
=1
···
N
i
N
bs
=α
N
bs
P(d
AP
i
N
bs
| α)
H
i
N
bs
=0or1
,
(A.3)
where we have used the fact that the sensors’ decisions are
conditionally independent. Note that H
i
N
bs
= 0ifN
bs
is even,
whereas H
i
N
bs
= 1ifN
bs
is odd. The component conditional
EURASIP Journal on Wireless Communications and Networking 11
probabilities at the right-hand side of (A.3) can be expressed
as follows:
P
d
AP
i
| α
=
⎧
⎪
⎪
⎪
⎪
⎪
⎨
⎪
⎪
⎪
⎪
⎪
⎩
p +
1 − 2p
P
n
i
d
AP
i
=0
<
d
>
AP
i
=1
τ
,ifi ∈ I
0
(
α
)
,
p +
1 − 2p
P
n
i
d
AP
i
=0
<
d
>
AP
i
=1
τ −s
,ifi ∈ I
1
(
α
)
,
(A.4)
where
I
(
α
)
positions {i} such that H
i
= | α
= 0,1.
(A.5)
After a few manipulations, one obtains:
P
d
AP
i
| α
=
⎧
⎪
⎨
⎪
⎩
p +
1 − 2p
Ψ
d
AP
i
, τ, σ,0
if i ∈ I
0
(
α
)
p +
1 − 2p
Ψ
d
AP
i
, τ, σ,1
if i ∈ I
1
(
α
)
,
(A.6)
where
Ψ
d
AP
i
, τ, σ, m
1 − d
AP
i
1 − Q
τ −s ·m
σ
+ d
AP
i
Q
τ −s ·m
σ
(A.7)
with Q(x)
∞
x
(1/
√
2π)exp(−y
2
/2)dy.
The second multiplicative term at the right-hand side of
(A.2) can be written, using the chain rule [22], as
P
(
α
)
=
N
bs
i=1
P
(
α
i
| α
i−1
, , α
1
)
= P
(
α
1
)
N
bs
i=2
P
(
α
i
| α
i−1
)
,
(A.8)
where we have used the fact that the position of the ith edge
depends only on the position of the (previous) (i
− 1)th
edge. The multiplicative terms at the right-hand side of (A.8)
can be evaluated by observing that each edge is spatially
distributed according to the constraints in (6). In particular,
by using combinatorics, it follows that
P
(
α
1
)
=
1
N −N
bs
+1
P
(
α
k
| α
k−1
)
=
1
N −N
bs
+ k − α
k−1
k = 2, , N
bs
.
(A.9)
The last term at the right-hand side of (A.2) (i.e., the
denominator) can be easily computed by observing that it
is composed of terms similar to those evaluated in (A.3)and
(A.8).
A.2. Absence of Quantization. The conditional probabili-
ties at the right-hand side of (13) can be obtained, as
in Appendix A.1, through proper marginalization of joint
conditional PMFs of the following type:
P
α | r
AP
=
p
r
AP
| α
P
(
α
)
×
⎡
⎢
⎣
N−N
bs
α
1
=2
···
N−N
bs
+i−1
α
i
+1
···
N−1
α
N
bs
=α
N
bs
−1
+1
p(r
AP
| α)P(α)
⎤
⎥
⎦
−1
.
(A.10)
Since sensors’ observations are independent, it holds that
p
r
AP
| α
=
N
i=1
p
r
AP
i
| α
,
(A.11)
where
p
r
AP
i
| α
=
⎧
⎪
⎨
⎪
⎩
p
comm
r
AP
i
,ifi ∈ I
0
(
α
)
,
p
comm
r
AP
i
−s
,ifi ∈ I
1
(
α
)
,
p
comm
(
r
)
1
2π
σ
2
+ σ
2
comm
exp
−
r
2
2
σ
2
+ σ
2
comm
.
(A.12)
One can notice that the effects of observation and communi-
cation AWGNs add directly.
B. Details on the Simplified One-Dimensional
Edge Detection Strategy
B.1. Binary Quantization. The conditional PMFs P(H
i
= |
d
AP
i
)( = 0, 1; i = 1, ,N)in(14) can be written, by
applying the Bayes formula, as
P
H
i
= | d
AP
i
=
P
d
AP
i
| H
i
=
P
d
AP
i
| H
i
= 0
+ P
d
AP
i
| H
i
= 1
,
(B.1)
where we have used the fact that P(H
i
= 0) = P(H
i
= 1) =
1/2and
P
d
AP
i
| H
i
=
=
p +
1 − 2p
P
n
i
d
AP
i
=0
<
>
d
AP
i
=1
τ −s ·
=
1 − d
AP
i
p +
1 − 2p
1 − Q
τ −s ·
σ
+ d
AP
i
p +
1 − 2p
Q
τ −s ·
σ
.
(B.2)
B.2. Absence of Quant ization. The conditional PMFs
{P(H
i
= | r
AP
i
)} at the right-hand side in (15)canbe
computed as follows
P
H
i
= | r
AP
i
=
p
comm
r
AP
i
−s ·
p
comm
r
AP
i
+ p
comm
r
AP
i
−s
(B.3)
and p
comm
(r)hasbeendefinedinAppendix A.2.
12 EURASIP Journal on Wireless Communications and Networking
C. Limiting Distance for High
Communication Noise
The limiting distance when p = 0.5canbecomputed,by
averaging over the possible (equiprobable) values for the
number of edges N
bs
,as
D
rand
(
N
)
=
1
N −2
N−2
N
bs
=1
D
(
N
bs
)
,
(C.1)
where
D(N
bs
) is the average distance in the presence of N
bs
edges. The value of D(N
bs
)caninturnbecomputedbyaver-
aging over all possible pair-wise distances between the true
phenomenon configurations and all possible configurations
with N
bs
edges for the (randomly) estimated phenomenon at
the AP. We denote these sets of edges as
{α
phen
} and {α
AP
},
respectively. The distance between the phenomena (true and
estimated) associated to a pair of these sequences is
D
N
bs
, α
phen
, α
AP
=
D
H
α
phen
,
H
(
α
AP
)
. (C.2)
The number of all possible sequences of N
bs
edges can be
computed by simply counting all possible configurations for
the edges’ positions, that is, as follows:
g
(
N
bs
, N
)
=
N−N
bs
α
1
=2
···
N−N
bs
+k−1
α
k
=k+1
···
N−1
α
N
bs
=N
bs
+1
1.
(C.3)
Therefore, one can write
D
(
N
bs
)
=
1
g
(
N
bs
, N
)
·
{
α
phen
}
1
g
(
N
bs
, N
)
{α
AP
}
D
H
α
phen
,
H
(
α
AP
)
.
(C.4)
Finally, the limiting distance in (C.1)is
D
rand
(
N
)
=
1
N −2
N−2
N
bs
=1
1
g(N
bs
, N)
2
·
{
α
phen
}
{α
AP
}
D
H
α
phen
,
H
(
α
AP
)
.
(C.5)
The computation of the above expression is analytically
very cumbersome. However, as shown in Figure 7 (a), it
can be obtained out through simulations. In particular,
our results show that an accurate approximation (through
interpolation) is given by
D
rand
(N) φN
2
,whereφ =
0.33—in this case, the relative error between D
rand
(N)and
φN
2
is lower than 2.4% for N ∈{8, , 512}.
Acknowledgment
The authors would like to thank Marco Sarti (Elettric 80
S.p.A., Viano, Reggio Emilia, Italy) for his help in the
derivation of part of the simulator.
References
[1] I. F. Akyildiz, W. Su, Y. Sankarasubramaniam, and E. Cayirci,
“A survey on sensor networks,” IEEE Communications Maga-
zine, vol. 40, no. 8, pp. 102–114, 2002.
[2] S. N. Simic and S. Sastry, “Distributed environmental mon-
itorning using random sensor networks,” in Proceedings of
the 2nd International Workshop on Information Processing in
Sensor Networks, pp. 582–592, Palo Alto, Calif, USA, April
2003.
[3] R. Viswanathan and P. K. Varshney, “Distributed detection
with multiple sensors—part I: fundamentals,” Proceedings of
the IEEE, vol. 85, no. 1, pp. 54–63, 1997.
[4] I. Y. Hoballah and P. K. Varshney, “Information theoretic
approach to the distributed detection problem,” IEEE Transac-
tions on Information Theory, vol. 35, no. 5, pp. 988–994, 1989.
[5] N. Gnanapandithan and B. Natarajan, “Joint optimization
of local and fusion rules in a decentralized sensor network,”
Journal of Communications, vol. 1, no. 6, pp. 9–17, 2006.
[6] G. Ferrari and R. Pagliari, “Decentralized binary detection
with noisy communication links,” IEEE Transactions on
Aerospace and Electronic Systems, vol. 42, no. 4, pp. 1554–1563,
2006.
[7] R. Nowak and U. Mitra, “Boundary estimation in sensor
networks: theory and methods,” in Proceedings of the 2nd
International Workshop on Information Processing in Sensor
Networks, pp. 80–95, Palo Alto, Calif, USA, April 2003.
[8] R. Nowak, U. Mitra, and R. Willett, “Estimating inhomoge-
neous fields using wireless sensor networks,” IEEE Journal on
Selected Areas in Communications, vol. 22, no. 6, pp. 999–1006,
2004.
[9] J. Barros and M. T
¨
uchler, “Scalable decoding on factor
trees: a practical solution for wireless sensor networks,” IEEE
Transactions on Communications, vol. 54, no. 2, pp. 284–294,
2006.
[10] Z Q. Luo, “An isotropic universal decentralized estimation
scheme for a bandwidth constrained ad hoc sensor network,”
IEEE Journal on Selected Areas in Communications, vol. 23, no.
4, pp. 735–744, 2005.
[11] S. Duttagupta and K. Ramamritham, “Distributed
boundary estimation using sensor networks,” Tech. Rep.,
Indian Institute of Technology, Mumbai, India, 2006,
/>[12] S. Duttagupta, K. Ramamritham, and P. Ramanathan, “Dis-
tributed boundary estimation using sensor networks,” in
Proceedings of the International Conference on Mobile Ad-
hoc and Sensor Systems (MASS ’06), pp. 316–325, Vancouver,
Canada, October 2006.
[13] V. Torre and T. A. Poggio, “On edge detection,” IEEE
Transactions on Pattern Analysis and Machine Intelligence, vol.
8, no. 2, pp. 147–163, 1986.
[14] J. Canny, “A computational approach to edge detection,” IEEE
Transactions on Pattern Analysis and Machine Intelligence, vol.
8, no. 6, pp. 679–698, 1986.
[15] S. Konishi, A. L. Yuille, J. M. Coughlan, and C. Z. Song,
“Statistical edge detection: learning and evaluating edge cues,”
IEEE Transactions on Pattern Analysis and Machine Intelligence,
vol. 25, no. 1, pp. 57–74, 2003.
[16] A. Khashman, “Noise-dependent optimal scale in edge
detection,” in Proceedings of the International Symposium on
Industrial Electronics (ISIE ’02), vol. 2, pp. 467–471, L’Aquila,
Italy, July 2002.
EURASIP Journal on Wireless Communications and Networking 13
[17] L. Jia and J. Xiaojun, “Edge detection based on decision-
level information fusion and its application in hybrid image
filtering,” in Proceedings of the International Conference on
Image Processing (ICIP ’04), vol. 1, pp. 251–254, Singapore,
October 2004.
[18] G. Ferrari, M. Martal
`
o, and M. Sarti, “Sensor networks as data
acquisition devices—reduced-complexity decentralized detec-
tion of spatially non-constant phenomena,” in Grid Enabled
Instrumentation and Measurement,F.Davoli,N.Meyer,R.
Pugliese, and S. Zappatore, Eds., Signals and Communication
Technology, pp. 33–54, Springer, New York, NY, USA, 2008.
[19] S. M. Kay, Fundamentals of Statistical Signal Processing, Volume
I: Estimation Theory, Prentice-Hall, Upper Saddle River, NJ,
USA, 1993.
[20] J. G. Proakis, Digital Communications, McGraw-Hill, New
York, NY, USA, 4th edition, 2001.
[21] T. M. Cover and J. A. Thomas, Elements of Information Theory,
John Wiley & Sons, New York, NY, USA, 1991.
[22] A. Papoulis, Probability, Random Variables and Stochastic
Processes, McGraw-Hill, New York, NY, USA, 1991.