báo cáo hóa học:" Reduction of graphene oxide by an in-situ photoelectrochemical method in a dye-sensitized solar cell assembly" ppt
Bạn đang xem bản rút gọn của tài liệu. Xem và tải ngay bản đầy đủ của tài liệu tại đây (552.44 KB, 13 trang )
This Provisional PDF corresponds to the article as it appeared upon acceptance. Fully formatted
PDF and full text (HTML) versions will be made available soon.
Reduction of graphene oxide by an in-situ photoelectrochemical method in a
dye-sensitized solar cell assembly
Nanoscale Research Letters 2012, 7:101 doi:10.1186/1556-276X-7-101
Chen Chen ()
Mingce Long ()
Min Xia ()
Chunhua Zhang ()
Weimin Cai ()
ISSN 1556-276X
Article type Nano Express
Submission date 17 November 2011
Acceptance date 2 February 2012
Publication date 2 February 2012
Article URL />This peer-reviewed article was published immediately upon acceptance. It can be downloaded,
printed and distributed freely for any purposes (see copyright notice below).
Articles in Nanoscale Research Letters are listed in PubMed and archived at PubMed Central.
For information about publishing your research in Nanoscale Research Letters go to
/>For information about other SpringerOpen publications go to
Nanoscale Research Letters
© 2012 Chen et al. ; licensee Springer.
This is an open access article distributed under the terms of the Creative Commons Attribution License ( />which permits unrestricted use, distribution, and reproduction in any medium, provided the original work is properly cited.
Reduction of graphene oxide by an in-situ photoelectrochemical
method in a dye-sensitized solar cell assembly
Chen Chen
1
, Mingce Long*
1
, Min Xia
1
, Chunhua Zhang
1
, and Weimin Cai
1
1
School of Environmental Science and Engineering, Shanghai Jiao Tong University,
Dongchuan Road 800, Shanghai 200240, People's Republic of China
∗Corresponding authors:
Email addresses:
CC:
MCL:
MX:
CHZ:
WMC:
Abstract
Reduction of graphene oxide [GO] has been achieved by an in-situ
photoelectrochemical method in a dye-sensitized solar cell [DSSC] assembly, in which
the semiconductor behavior of the reduced graphene oxide [RGO] is controllable. GO
and RGO were characterized by X-ray photoelectron spectroscopy, Raman spectroscopy,
high-resolution transmission electron microscope, and Fourier-transform infrared
spectroscopy. It was found that the GO film, which assembled in the DSSC assembly as
the counter electrode, was partly reduced. An optimized photoelectrochemical assembly
is promising for modulating the reduction degree of RGO and controlling the band
structure of the resulting RGO. Moreover, this method appeared to be a green progress
for the production of RGO electrodes.
Keywords: graphene oxide; reduction; photoelectrochemical; J-V curve; dye-sensitized
solar cells.
Introduction
Nowadays chemical conversion of solar energy has attracted considerable attention
[1-3]. Graphene is a new carbon material with diverse properties being suitable for
energy conversion and storage [4]. Graphene oxide [GO], produced by exfoliation of
graphite oxide, has been traditionally considered to be a precursor for graphene [5-7].
GO has recently attracted research interest due to its good solubility in water and other
solvents, which allows it to be easily deposited onto a wide range of substrates [8, 9].
Besides, GO has variable optical, mechanical, and electronic properties that can be
tuned by controlling the degree of oxidation [10, 11]. Reduced graphene oxide [RGO],
characterized as an incompletely reduced product of GO, is the intermediate state
between graphene and GO. Because the oxygen bonding forms the sp
3
hybridization on
RGO [12] and oxygen atoms have a larger electronegativity than carbon atoms, RGO
becomes a doped semiconductor where the charge flow creates negative oxygen atoms
and a positively charged carbon grid [13, 14]. However, understanding the controllable
semiconductor behavior of RGO is still a big challenge. Normally, the bandgap of RGO
increases with the oxidation level. Controlling the ratio of sp
2
carbon atoms to sp
3
carbon atoms by reduction chemistry is a powerful way to tune its bandgap. Therefore,
RGO can be controllably transformed from an insulator (GO) to a conductor (graphene)
[10, 15]. Owing to these characteristics, RGO has great potential to be applied in
biosensors [16], optical devices [17], plastic electronics [18], and solar cells [19]. The
reduction of GO is typically achieved by thermal annealing and exposure to hydrazine
gas, as described in former cases [20-22]. These methods involved either high
temperatures or a poisonous and explosive gas.
In this work, we present a green and controllable approach for the in-situ reduction
of GO in a dye-sensitized solar cell [DSSC] assembly. The GO film was fabricated in
the DSSC as a counter electrode. In typical DSSCs, upon illumination, photoinduced
electrons from the excited dye transfer toward the conduction band of TiO
2
photoanodes, accompanying the oxidation of redox species in the electrolyte (e.g.,
I
−
/I
3
−
), and simultaneously, the reduction reaction occurs at the counter electrodes by
accepting the electrons. By substituting the Pt counter electrode with the GO film, the
photoinduced electrons could be captured by GO and result in the reduction of GO.
Inspired by this, in this contribution, we provide an easy approach to an in-situ
photoelectrochemical reduction of GO with a GO drop-cased fluorine-doped tin oxide
[FTO] glass as the counter electrode in a DSSC assembly. Moreover, according to the
transition mechanism, an optimized photoelectrochemical assembly can be fabricated
for the controllable modulation of the band positions of RGO materials.
Experimental section
Preparation of GO
GO was synthesized from natural graphite powder (100 µm; Qingdao Graphite
Company, Qingdao, Shandong, China) by a modified Hummers' method [23]. In a
typical experiment, the graphite powder (1 g) and NaNO
3
(0.5 g) were introduced to
concentrated H
2
SO
4
(23 mL) in an ice bath. KMnO
4
(3 g) was added gradually under
stirring to prevent rapid temperature rise, and the temperature of the mixture was kept
below 20°C. The mixture was then stirred at 35°C for 4 h. Then, deionized water (46
mL) was slowly added to the solution, followed by stirring the mixture at 98°C for 15
min. The reaction was terminated by adding deionized water (140 mL) and H
2
O
2
(1 mL,
30 wt.%) under stirring at room temperature. The resulting graphite oxide was washed
with deionized water by filtration. Graphene oxide was obtained from the graphite oxide
solution by ultrasonication at room temperature for 30 min. Unexfoliated graphite oxide
in suspension after ultrasonication was removed by centrifugation at 3,000 rpm for 5
min.
Fabrication of DSSCs
To realize the in-situ photoelectrochemical reduction, GO counter electrode was used
for DSSCs. The GO electrode was prepared by drop casting the GO solution of 1 mg/ml
on a clean FTO glass substrate and dried in room temperature. N719-sensitized TiO
2
film anode was prepared according to the literature method [24]. In brief, 1.6 g of
nanocrystalline TiO
2
and 0.7 g of ethyl cellulose were suspended with 6 mL of
terpilenol. Five layers of 20-nm-sized TiO
2
particles and two layers of 400-nm-sized
TiO
2
particles were screen printed on a TiCl
4
-treated FTO glass. These films were
heated to 500°C in air and sensitized with a 0.36 mg/ml N719 dye solution for 24 h. The
cell had an active area of 0.36 cm
2
and was sealed with an electrolyte solution
containing 0.1 M lithium iodide, 0.05 M iodine, 0.5 M 4-tert-butylpyridine, and 0.6 M
ionic liquid (1, 2-Dimethyl-3-propylimidazolium bis(trifluoromethylsulfonyl)imide).
Characterization
Solar conversion efficiency and current density-voltage [J-V] curves were measured
under air mass [AM] 1.5 G light with a solar simulator (HMT Co., Bangalore, India),
and a potentiostat (Keithley 2400, Keithley Instruments Inc., Cleveland, OH, USA) was
used to apply various loads. The incident light intensity was calibrated using a standard
solar cell composed of a crystalline silicon solar cell and an infrared cutoff filter (KG-5,
Schott AG, Mainz, Germany).
Raman spectra were obtained on a Senterra R200-L dispersive Raman microscope
(Bruker Optik Gmbh, Ettlingen, Germany) with a 633-nm laser source. The morphology
and structure were observed by a JEM-2100F high-resolution transmission electron
microscope [HRTEM] (JEOL Ltd., Akishima, Tokyo, Japan) operated at 200 kV.
Fourier transform infrared [FT-IR] spectroscopy was conducted using a Fourier
transform infrared spectrometer (EQUINOX 55, Bruker Optik Gmbh, Ettlingen,
Germany). X-ray photoelectron spectroscopy [XPS] experiments were carried out on a
RBD-upgraded PHI-5000C ESCA system (PerkinElmer, Waltham, MA, USA) with
AlKα radiation (hv = 1486.6 eV).
Results and discussion
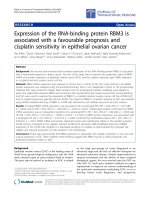
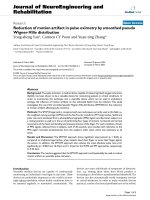
The J-V characteristics of DSSCs were taken under AM 1.5 G light. The changes of fill
factors [FF] and solar conversion efficiencies [η] in 40 tests were tracked and shown in
Figure 1. Upon illumination during the J-V tests, FF and η increase sharply on the first
few tests. It is due to the reduction of the GO film by the photoinduced electrons. With
the reduction proceeding, the increase of FF and η slows down and approaches to a
limitation at last. After the photoelectrochemical reduction, the GO film on the counter
electrode is reduced into RGO. The FF and η enhance from 0.10 and 0.24% to 0.28 and
1.75%, respectively, indicating that a significantly improved conductivity of the RGO
film has been achieved. After the reduction, the RGO counter electrode was immersed
in acetonitrile for 1 h to remove the adsorbed I
−
and I
3
−
and dried with N
2
flow for
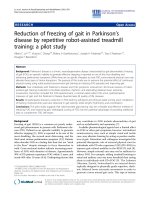
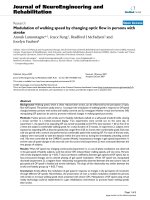
further characterization. From the images of Figure 2a, the color of the film changed
obviously from brown to black, indicating that a reduction was achieved for the GO
electrode.
To confirm the reduction of GO, Raman spectroscopy, a powerful nondestructive tool
to characterize crystal structures of carbon, was employed. The typical features for
carbon in Raman spectra are the G line around 1,582 cm
−1
(E
2g
phonon of sp
2
carbon
atoms) and D line around 1,350 cm
−1
(κ-point phonons of A
1g
symmetry). Figure 2b
shows the Raman spectra of GO and RGO. The intensity ratio (I
D
/I
G
) is about 0.96 for
GO, while the ratio of RGO is much higher (1.27). Comparing with the results by
chemical reduction methods, such as NaBH
4
(>1) [22], hydrazine hydrate (1.63) [25],
and hydrothermal reduction (0.90) [26], the high ratio of 1.27 implies that GO on the
FTO glass was reduced significantly by the photoinduced electrons in the DSSC.
The reduction of GO was described by X-ray photoelectron spectroscopy as well. The
C1s spectrum of the original GO film (Figure 2c) reveals that there are four different
peaks centering at 284.4, 286.0, 287.1, and 288.7 eV, corresponding to C=C/C-C, C-O
(hydroxyl and epoxy), C=O (carbonyl), and O-C=O (carboxyl) groups, respectively.
After the in-situ photoelectrochemical reduction in the DSSC, the peaks of
oxygen-containing groups, especially the peak of C-O, decrease dramatically (shown in
Figure 2d), and the percentages of oxygen-containing groups are shown in Table 1. The
results reveal that most of the oxygen-containing groups are removed. In addition, the
atomic ratio of carbon and oxygen (C/O), obtained by taking the ratio of C1s and O1s
peak areas in XPS spectra, increases from 2.7 to 5.1, which also indicates the reduction
of GO did take place during the in-situ reduction in the DSSC.
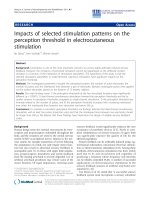
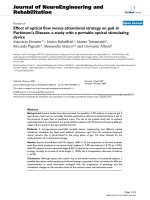
The reduced GO film was removed from the FTO glass for the tests of FT-IR
spectroscopy and HRTEM. FT-IR spectroscopy was also used to indicate the reduction
of oxygen-containing groups of GO. Figure 3a shows the characteristic bands of GO
around 1,106 cm
−1
for C-O (ν(alkoxy and epoxy)), 1,403 cm
−1
for O-H (ν(carboxyl)),
1,634 cm
−1
for C=C, and 3,446 cm
−1
for O-H of intercalated water. After the reduction,
the absorption bands of both C-O and O-H are considerably decreased. The
characteristic band of C=O (carboxyl) was not detected by FT-IR. The results imply that
most of the oxygen-containing groups of GO were reduced by the photoinduced
electrons.
RGO obtained by in-situ reduction was analyzed by HRTEM. Figure 3b shows a low
magnification image of a typical RGO nanosheet. The sheets resemble crumpled silk
veil waves on the carbon-coated copper grid. As reported previously, corrugation and
scrolling are intrinsic to graphene nanosheets [27]. The ordered graphene lattices are
clearly visible in the HRTEM image of RGO (Figure 3c). A 0.39-nm intersheet spacing
obtained from this image indicates a moderate oxidation level of RGO because the layer
distance of typical oxidized graphite is between 0.6 to 0.7 nm [28].
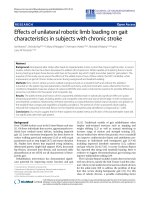
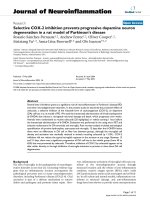
According to the results of characterization on the GO film before and after reduction,
it was confirmed that the GO film was partly reduced when the DSSC was exposed
upon irradiation. A scheme for the in-situ photoelectrochemical reduction of the GO
film was depicted in Figure 4. As we know, GO/RGO can be regarded as
semiconductors with changeable energy band positions depending on the ratios of sp
2
carbon to sp
3
carbon [9, 10]. Initially, the reduction potential of photoinduced electrons
at the counter electrode is powerful enough to reduce GO and makes its oxidation level
reduced. Moreover, electrons are not easy to be captured efficiently by the ions I
3
−
due
to the relatively higher oxidation power and lower conductivity of GO, resulting in
lower conversion efficiencies and higher open voltages at the first few measurements.
With the reduction of GO, the atomic ratio of carbon to oxygen increases and the
bandgap of GO decreases; meanwhile, the valence band of GO shifts upward. With the
increased conductivity of GO, J
SC
, FF, and η of the as-assembled DSSC rise
continuously. However, the reduction decelerates and ceases when the valence band of
RGO shifts to the position which is higher than the reduction potential of I
−
/I
3
−
. By then,
electrons are captured by I
3
−
; meanwhile, the efficiency of the DSSC no longer
increases. That is the reason for the incomplete reduction of GO and the relatively lower
solar conversion efficiency of the resulting DSSC. However, this method is convenient
to obtain a RGO film with different reduction degrees. Moreover, it provides a
promising strategy for modulating the band positions of RGO.
Conclusions
RGO is obtained by the in-situ photoelectrochemical reduction of GO in a DSSC
assembly. The reduction results in a partial removal of oxygen-containing groups of
GO. This method avoids the high-temperature processing and the usage of harmful
chemical reagents. The reduction of GO is changeable by controlling the irradiation
time or substituting the reduction couples of I
−
/I
3
−
in the electrolyte; a further improved
performance can be achieved by the optimized photoelectrochemical assembly.
Competing interests
The authors declare that they have no competing interests.
Authors' contributions
CC carried out the total experiment and wrote the manuscript. MCL supervised all the
study and performed the statistical analysis. MX participated in the detection of the
TEM and FT-IR. CHZ participated in the detection of the J-V curves and DSSC
assemblage. WMC participated in the design of the study and mechanism analysis. All
authors read and approved the final manuscript.
Acknowledgments
This work was financially supported by the National Natural Science Foundation of
China (No. 20907031).
References
1. Kamat PV, Tvrdy K, Baker DR, Radich JG: Beyond photovoltaics:
semiconductor nanoarchitectures for liquid-junction solar cells. Chem Rev 2010,
110:6664-6688.
2. Long MC, Jiang JJ, Li Y, Cao RQ, Zhang LY, Cai WM: Effect of gold
nanoparticles on the photocatalytic and photoelectrochemical performance of
Au modified BiVO
4
. Nano-Micro Lett 2011, 3:171-177.
3. Cook TR, Dogutan DK, Reece SY, Surendranath Y, Teets TS, Nocera DG: Solar
energy supply and storage for the legacy and nonlegacy worlds. Chem Rev 2010,
110:6474-6502.
4. Kamat PV: Graphene-based nanoassemblies for energy conversion. J Phys
Chem Lett 2011, 2:242-251.
5. Stankovich S, Dikin DA, Piner RD, Kohlhaas KA, Kleinhammes A, Jia Y, Wu Y,
Nguyen ST, Ruoff RS: Synthesis of graphene-based nanosheets via chemical
reduction of exfoliated graphite oxide. Carbon 2007, 45:1558-1565.
6. Park S, Ruoff RS: Chemical methods for the production of graphenes. Nature
Nanotech 2009, 4:217-224.
7. Si Y, Samulski ET: Synthesis of water soluble graphene. Nano Lett 2008,
8:1679-1682.
8. Yamaguchi H, Eda G, Mattevi C, Kim H, Chhowalla M: Highly uniform 300
mm wafer-scale deposition of single and multilayered chemically derived
graphene thin films. ACS Nano 2010, 4:524-528.
9. Eda G, Fanchini G, Chhowalla M: Large-area ultrathin films of reduced
graphene oxide as a transparent and flexible electronic material. Nature
Nanotech 2008, 3:270-274.
10. Lahaye RJWE, Jeong HK, Park CY, Lee YH: Density functional theory study
of graphite oxide for different oxidation levels. Phys Rev B 2009, 79:125435.
11. Saxena S, Tyson TA, Negusset E: Investigation of the local structure of
graphene oxide. J Phys Chem Lett 2010, 1:3433-3437.
12. Gomez-Navarro C, Weitz RT, Bittner AM, Scolari M, Mews A, Burghard M,
Kern K: Electronic transport properties of individual chemically reduced
graphene oxide sheets. Nano Lett 2007, 7:3499-3503.
13. Lu GH, Ocola LE, Chen JH: Reduced graphene oxide for room-temperature
gas sensors. Nanotech 2009, 20:445502-445509.
14. Chen C, Cai WM, Long MC, Zhou BX, Wu YH, Wu DY, Feng YJ: Synthesis
of visible-light responsive graphene oxide/TiO
2
composites with p/n
heterojunction. ACS Nano 2010, 4:6425-6432.
15. Eda G, Mattevi C, Yamaguchi H, Kim H, Chhowalla M: Insulator to
semimetal transition in graphene oxide. J Phys Chem C 2009, 113:15768-15771.
16. Dong XC, Huang W, Chen P: In-situ synthesis of reduced graphene oxide
and gold nanocomposites for nanoelectronics and biosensing. Nanoscale Res
Lett 2011, 6:60.
17. Loh KP, Bao QL, Eda G, Chhowalla M: Graphene oxide as a chemically
tunable platform for optical applications. Nature Chem 2010, 2:1015-1024.
18. Lee BJ, Yu HY, Jeong GH: Controlled synthesis of monolayer graphene
toward transparent flexible conductive film application. Nanoscale Res Lett
2011, 5:1768-1773.
19. Kavan L, Yum JH, Grätzel M: Optically transparent cathode for
dye-sensitized solar cells based on graphene nanoplatelets. ACS Nano 2011,
5:165-172.
20. Akhavan O: The effect of heat treatment on formation of graphene thin
films from graphene oxide nanosheets. Carbon 2010, 48:509-519.
21. Park S, An J, Potts JR, Velamakanni A, Murali S, Ruoff RS:
Hydrazine-reduction of graphite and graphene oxide. Carbon 2011,
49:3019-3023.
22. Shin HJ, Kim KK, Benayad A, Yoon S-M, Park HK, Jung I-S, Jin MH, Jeong
H-K, Kim JM, Choi J-Y, Lee YH: Efficient reduction of graphite oxide by
sodium borohydride and its effect on electrical conductance. Adv Funct Mater
2009, 19:1987-1992.
23. Hummers WS, Offeman RE: Preparation of graphitic oxide. J Am Chem Soc
1958, 80:1339-1339.
24. Ito S, Murakami TN, Comte P, Liska P, Grätzel C, Nazeeruddin MK, Grätzel M:
Fabrication of thin film dye sensitized solar cells with solar to electric power
conversion efficiency over 10%. Thin Solid Films 2008, 516:4613-4619.
25. Yan J, Fan ZG, Wei T, Qian WZ, Zhang ML, Wei F: Fast and reversible
surface redox reaction of graphene-MnO
2
composites as supercapacitor
electrodes. Carbon 2010, 48:3825-3833.
26. Zhou Y, Bao QL, Tang LAL, Zhong YL, Loh KP: Hydrothermal dehydration
for the "green" reduction of exfoliated graphene oxide to graphene and
demonstration of tunable optical limiting properties. Chem Mater 2009,
21:2950-2956.
27. Meyer JC, Geim AK, Katsnelson MI, Novoselov KS, Booth TJ, Roth S: The
structure of suspended graphene sheets. Nature 2007, 446:60-63.
28. Compton OC, Nguyen ST. Graphene Oxide: Highly reduced graphene oxide,
and graphene: versatile building blocks for carbon-based materials. Small 2010,
6:711-723.
Figure 1. Fill factor and solar conversion efficiency in different tests.
Figure 2. Digital picture and Raman and XPS spectra. (a) Digital picture of GO and
RGO, (b) Raman spectra of GO and RGO, and (c) C1s XPS spectra of GO before and
(d) after reduction.
Figure 3. FT-IR spectra and TEM and HRTEM images. (a) FT-IR spectra of GO
and RGO and (b) TEM and (c) HRTEM images of RGO.
Figure 4. Mechanism of in-situ photoelectrochemical reduction of GO in a DSSC
assembly.
Table 1. Percentages of oxygen-containing groups of GO and RGO from XPS data
Sample C-O C=O O-C=O
GO 20.8 10.0 6.1
RGO 11.5 6.9 2.9
Figure 1
Figure 2
Figure 3
Figure 4