báo cáo hóa học:" Research Article Design and Implementation of a Testbed for IEEE 802.15.4 (Zigbee) Performance Measurements" doc
Bạn đang xem bản rút gọn của tài liệu. Xem và tải ngay bản đầy đủ của tài liệu tại đây (1.6 MB, 11 trang )
Hindawi Publishing Corporation
EURASIP Journal on Wireless Communications and Networking
Volume 2010, Article ID 103406, 11 pages
doi:10.1155/2010/103406
Research Article
Design and Implementation of a Testbed for IEEE 802.15.4
(Zigbee) Performance Measurements
Patrick R. Casey, Kemal E. Tepe, and Narayan Kar
Electrical and Computer Engineering Depar tment, University of Windsor, Windsor, Ontario, Canada N9B 3P4
Correspondence should be addressed to Kemal E. Tepe,
Received 1 June 2009; Revised 2 October 2009; Accepted 19 February 2010
Academic Editor: Christian Ibars
Copyright © 2010 Patrick R. Casey et al. This is an open access article distributed under the Creative Commons Attribution
License, which permits unrestricted use, distribution, and reproduction in any medium, provided the original work is properly
cited.
IEEE 802.15.4, commonly known as ZigBee, is a Media Access Control (MAC) and physical layer standard specifically designed
for short range wireless communication where low rate, low power, and low bandwidth are required. This makes ZigBee an ideal
choice when it comes to sensor networks for monitoring data collection and/or triggering process responses. However, these very
characteristics bring into question ZigBee’s ability to perform reliably in harsh environments. This paper thoroughly explains the
experimental testbed setup and execution to demonstrate ZigBee’s performance in several practical applications. This testbed is
capable of measuring the minimum, maximum, and average received signal strength indicator (RSSI), bit error rate (BER), packet
error rate (PER), packet loss rate (PLR), and the bit error locations. Results show that ZigBee has the potential capabilities to be
used in all four tested environments.
1. Introduction
As digital technology is rapidly advancing in the 21st century,
much of this technology is oriented toward efficiently moni-
toring and reacting accordingly. Whether it is monitoring for
building automation, assembly line manufacturing, or even
National Security, sensor networks play a crucial role. There
are several mediums in which to construct sensor networks
with each having their own strengths for certain applications.
IEEE 802.15.4 (ZigBee) is a leading technology for wireless
short-range sensor networks. In order to discover the full
potential of ZigBee devices, it is necessary to challenge them
in as many diverse applications as possible. In order to do this
a reliable and efficient testbed is necessary. Such a testbed can
be used to discover physical layer performance boundaries
to increase utilization of ZigBee networks. The goal of this
paper is to thoroughly describe a testbed design, and release
statistics describing ZigBee’s physical and medium access
control (MAC) layer reliability.
There are studies regarding ZigBee’s performance based
on theory and simulations such as [1, 2]. Hameed et al.
in [1] put forward a scheduling scheme for guaranteed
time slots for real-time applications, and in [2] Zeghdoud
et al. obtained optimal throughput for different clear channel
assessment modes in the presence of IEEE 802.11 interfer-
ence. On the other hand, performance studies that examine
transmission reliability for off the shelf ZigBee devices are
scarce. Ilyas and Radha in [3] is one of these studies that
investigated the error process in IEEE 802.15.4 devices for
indoor and outdoor environments. Using transmission data,
they collected and modelled the channel using the bit error
rate (BER) probability density function and correlation
coefficient. Industry is interested in the performance of
ZigBee in different applications, such as in vehicles and in
industrial settings like [4, 5] by General Motors, and General
Electric and Sensicast Systems, respectively. These studies
combined with this paper’s experimental results for several
environments will give researchers an excellent foundation
for ZigBee’s ability to optimally perform in many real-time
applications.
Home automation is gaining popularity with network
enabled appliances like dishwashers, washing machines,
fridges, furnaces, hot water heaters, and many other devices
that could be used to form a single home network. These
appliances can be controlled to operate at ideal times of
the day to minimize energy costs and maximize usage with
2 EURASIP Journal on Wireless Communications and Networking
smart meter technology. Reinisch et al. in [6] demonstrated
that ZigBee is the most appropriate communication tech-
nology for home automation and Kim et al. in [7]put
forward a scheduling scheme for frames and subframes
in order to acquire optimal network parameters. Huo et
al. in [8] conducted in home experiments to determine
interference levels of common household products. The
largest interfering agent was IEEE 802.11b, however, for
the most part its effects could be avoided through proper
ZigBee channel selection. The microwave oven creates a
tolerable but unavoidable interference on the entire 2.45 GHz
band. Bluetooth technology was the least interfering agent.
Both the microwave oven and bluetooth interference can be
minimized further by an increase in distance separation of
only a couple of meters.
Although this paper focuses on home automation,
there are other similar applications that would benefit
from physical layer assessment of indoor locations. One
of these would be personal area networks (PAN) for
patient monitoring. Fort et al. in [9]createamodelto
understand radio narrow band propagation near the body
at the 915 MHz and 2.45 GHz bands. A model is developed
for path loss, small-scale fading, and RMS delay spread.
Another indoor application is building monitoring. Wilson
et al. in [10] created an advanced monitoring system that
is completely dependent upon a reliable wireless network.
Some functions of this system include firefighter localization
and electronically determining safe and hazardous escape
routes through sensors for smoke, carbon monoxide, and
temperature. All this information would be integrated onto a
digital building layout which is displayed in each firefighters’
mask.
One possible outdoor application of ZigBee is environ-
mental monitoring, which would be beneficial to scientists
and the agricultural industry. ZigBee would provide the
ability to network a wide range of sensors which detect
soil and air moisture, the richness of the soil, temperature,
solar radiation, wind speed and direction, and atmospheric
pressure. This data can then be used to predict weather pat-
terns, or determine optimal times to dispense water or other
nutrients to plants. Siuli Roy and Bandyopadhyay in [11]
provided a ZigBee network where soil properties are sensed
for real-time monitoring. Another outdoor application is
looking after city water distribution systems as proposed by
Lin et al. in [12]. ZigBee sensor nodes are concluded to
be feasible for use in monitoring water leaks. A path loss
model for underground to above ground communication is
also developed. Utilizing wireless sensor networks (WSNs)
for transmission line and power grid monitoring has also
gained much momentum. Casey in [13] employed ZigBee
technology coupled with IEEE 802.11 to give support to
a transmission line fault detection system. An end-to-end
prototype is developed and a complete explanation is given.
Effects of multiple access on throughput is also conducted.
Additionally, Huang et al. in [14]useZigBeedevicesand
GSM as a backbone to detect ice build up and to deice
transmission lines. Sensors measure the ice thickness and
current weather conditions so the minimum power needed
to melt the ice can be determined. A testbed that determines
the performance of ZigBee devices in outdoor environments
would help these applications to flourish.
The idea of wireless communication within a vehicle
is gaining interest for many reasons. Primarily, it results
in much faster installation times by cutting the need for
wiring many components together from all corners of the
vehicle, and it also greatly reduces the weight of the vehicle
by eliminating the need to install up to several kilometers
of cables. Ahmed et al. in [4] state issues as to why ZigBee
technology is not yet ready for automotive applications,
however these do not include transmission error reliability.
Two main reasons are that ZigBee does not necessarily meet
timing requirements depending on the sensor (shown in
the popular NS-2 simulator), and these devices are still too
expensive to be offset by the savings in cable costs. Although
these issues are out of the scope of this paper, the designed
testbed is used to verify ZigBee’s communication capabilities
in vehicle environments at the bit level. Tsai et al. in [15]
conducted packet level experiments to also challenge ZigBee’s
communication capabilities. In addition to engine noise, the
in-car bluetooth device was operated simultaneously to study
its effects. An adaptive strategy was developed to recognize a
fading channel and to take appropriate action.
Many industry solutions are now going wireless in an
attempt to cut costs. It is not uncommon for data cables
to snap which are connected to sensors on robotic arms or
other mobile parts. The down time to repair and replace
these cables create an unnecessary cost to manufacturers.
Additionally, the installation time for a wireless solution is
much faster. Gungor and Hancke in [16] thoroughly discuss
challenges, development, and design goals and approaches
about modern industrial wireless sensor networks. Some
of the topics that are covered include resource constraints,
dynamic topologies, harsh conditions, QoS requirements,
integration with other networks, and scalable architectures.
It was determined that these networks do possess the poten-
tial for usefulness in industrial settings. A machine shop
would be an accurate representation for a manufacturing
facility. The University of Windsor’s machine shop was
used for the experiments conducted in this paper. Tang
et al. in [17] is an example of a ZigBee wireless channel
investigation for a similar environment. Their analysis is
primarily based on RSSI and the link quality indicator (LQI).
The packet error rate (PER) is calculated by assuming if
a packet did not arrive then it was in error. This is not
necessarily the case. It is possible that a packet could not
arrive simply because the ZigBee radios are out of range, or
there was a physical obstruction blocking the transmission.
Furthermore, many of the papers published in this area focus
on the latency issues of wireless networks and do not address
error rates. For this reason, this research focuses on physical
layer corruption during data transmissions in several key
application scenarios.
Judging from the large number of quickly emerging
applications for low-power WSNs, it is imperative that a
thorough understanding of physical layer performance be
attained. This paper develops a testbed that collects raw data
regarding ZigBee transmission packet errors in four different
environments. Section 2 of this paper describes the testbed
EURASIP Journal on Wireless Communications and Networking 3
Control packet
AM
identifier
0
×00
(1 byte)
Destination
address
(2 bytes)
Link source
address
(2 bytes)
Message
length
(1 byte)
Group ID
(1 byte)
Active
message
handler
type
(1 byte)
Number of packets
to send
(2 bytes)
Number
of packets
per
second
(1 byte)
AM header Payload
Data packet
AM
identifier
0
×00
(1 byte)
Destination
address
(2 bytes)
Link source
address
(2 bytes)
Message
length
(1 byte)
Group ID
(1 byte)
Active
message
handler
type
(1 byte)
Dummy data payload
(24 bytes)
Counter
value
(1 byte)
RSSI
value
(1 byte)
AM header Payload
BS added
data
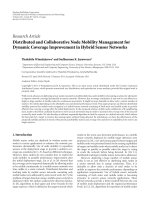
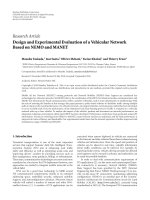
Figure 1: Packet structures for control and data packets.
building blocks and its structure. Specific details regarding
the functionality of the testbed is also explained. Section 3
describes the experimental procedure that was conducted
for each test environment and comments on the results.
Furthermore, a clear representation of the test sites and
transmitter locations are given. The paper is concluded in
Section 4.
2. Testbed Components and Structure
There are two types of nodes in the designed testbed. The
first node is referred to as the base station (BS), which
encompasses a ZigBee mote on a Crossbow MIB510 [18]
programming board connected to a laptop. This connection
is made via an RS-232 to USB cable. The second node
is simply the transmitter, which is a stand alone ZigBee
mote. The ZigBee motes that are used are the Crossbow
MicaZ mote, which utilize the Chipcon CC2420 radio.
The TinyOS-2.x environment [19] is used to program the
MicaZ devices and they transmit data on channel 26 with
a maximum transmission power of 0 dBm (1 mW). The BS
laptop communicates with the serial port (and therefore,
the ZigBee programming board and mote) using a Java
program during the experiment execution. This program is
referred to as BaseStation.java. Furthermore, the laptop has
Java Development Kit (JDK) 6 installed, and this runs in an
open source Mandriva Linux 2008 environment.
Once the BS and transmitter nodes are in place and
activated, the test begins by running BaseStation.java as a
console command. Three of the input arguments include: the
node ID of the transmitter node that is asked to send the
data packets, the number of data packets the transmitter is
to send in return, and the packet transmission rate (how
many of these packets are to be sent within one second).
Passing these arguments to BaseStation.java increases the
flexibility of the testbed and allows the parameters of each
trial to be changed. It also allows consecutive trials to be
conducted without the need to turn the transmitter node
BS
Tx
Computer domain
BaseStation.java
Start
command
Received
packets
Listen on
USB port
Write
Tr ial
x.dat
Read
Analyze.java
Calculate
BER, etc
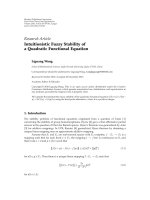
Figure 2: Testbed Structure.
off and then back on. This feature is helpful when the
transmitter is in a location that is difficult to reach (e.g.,
under the hood of a car while driving.) Once executed,
BaseStation.java builds a proper TinyOS Active Message
(AM) packet containing this information and sends it to the
serial port connected to the programming board. Figure 1
illustrates both the control packet and data packet structures.
The ZigBee mote of the BS simply transmits from the radio
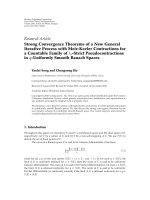
interface whatever is received on the serial interface. Figure 2
offers a graphical representation of the testbed structure.
The computer domain contains the laptop hardware and
software. Figure 3 shows the packet transmission sequence
during the trials.
4 EURASIP Journal on Wireless Communications and Networking
BS Tx
1
2
.
.
.
N
.
.
.
Control packet
Data packets
Figure 3: Packet transmission sequence.
In order for the BS to calculate the number of errors
caused by the wireless channel, the transmitter node always
transmits the same data packet. The first 8 octets are AM
header information and the dummy data payload is decimal
number 85 which was chosen simply because it is alternating
0’s and 1’s in binary. The total packet length is 32 octets.
Upon receiving these data packets, the BS mote adds two
additional octets of information (shown in blue) on to the
end of the packet before it forwards them through the serial
port to the laptop. The first octet is a counter value, which
will be discussed later, and the second octet is the radio’s
calculation of the RSSI for that particular packet. All of these
packets are picked up by BaseStation.java listening on the
USB port and it saves each consecutive packet in a file for
future analysis. A new file is created for each trial.
AsecondJavaprogram(Analyze.java) was developed
to analyze the saved files containing the received packets.
Since the transmitted data is known, this program can easily
calculate the bit error rate (BER) and PER for all received
packets in each trial. In addition, it determines packet loss
rate (PLR) for each trial, the bit error locations, the number
of packets received, and the maximum, minimum, and
average RSSI values for every trial. A conversion chart for
CC2420’s RSSI values to dBm is given in [20,page49].The
BER, PER, and PLR characteristics are defined as follows:
BER =
(
Number of incorrect bits
)
(
Total number of received bits
)
PER
=
Number of received packets with at least one error
+
Number of partial packets received
Total number of received packets
PLR =
Number of packets sent
−
Number of packets received
Number of packets sent
(1)
By default, the ZigBee mote radio chips conduct a cyclic
redundancy check (CRC) on each packet. Packets that do not
pass the CRC are immediately dropped by the CC2420 radio
and would not be available for analysis. This poses a problem
when there is a need to calculate BER and even PER, and
creates ambiguity because it is not known whether the packet
had an error or was lost. Also, the BER would be impossible
to determine when erroneous packets are dropped after
CRC. In order to circumvent this, some modifications to the
TinyOS driver files for the radio chip were made in order
to allow not only the correct packets through, but also the
packets that have errors.
TheBSZigBeemoteappendsacountervaluetothe
end of incoming packets. Since this mote has been modified
to allow error packets through, occasionally only partial
packets will be received during poor channel conditions.
Sizes of these partial packets vary, which would make for
an unnecessarily complicated Analyze.java program to deal
with them correctly. Instead, simply the occurrences of
partial packets are counted and such packets are dropped.
Consequently, accepted packets do not have errors in the
length field of the packet header. Partial packets are included
in the PER calculation.
3. Experiment Procedure and Results
In this section, the experimental procedures and results
will be provided, along with a clear representation of the
test sites and transmitter locations. The indoor, outdoor,
vehicle, and machine shop test sites were chosen because
most application environments will relate to one of these
settings. The numerical results for all trials are shown in
Ta bl e 1 . This includes the approximate distance between the
nodes, the BER, PER, PLR, the maximum, minimum, and
average RSSI, and the number of partial packets received.
3.1. Indoor. The house in which the indoor trials were
conducted was a 12.5m
× 8.7m two-story home with a
basement. Figures 4(a) and 4(b) are the layouts of the first
floor and basement, respectively. Trials were done with the
BS located in three different areas. First, the BS was located in
the kitchen (main floor) while the transmitter was positioned
in several key locations around the house. Second, the BS was
placed in front of the fuse box (basement) while the same key
locations were tested. In the final trial the BS was positioned
on the front control unit of the furnace while the transmitter
was placed one floor above on the thermostat. Additionally,
EURASIP Journal on Wireless Communications and Networking 5
Table 1: Test locations and results.
Transmitter Location Approximate
BER PER PLR
Maximum Minimum Average Number of Partial
(Description) Distance(m) RSSI RSSI RSSI Packets Dropped
Indoor: BS in Kitchen
1 (Below One Floor) 3.69 0.00176 0.05527 0.024 −37 −51 −48.838 1
2 (Dishwasher) 2.00 0.00101 0.00702 0.003
−30 −47 −38.772 0
3 (Basement Fridge) 8.27 No Reception
4 (Kitchen Fridge) 2.50 0 0 0
−27 −29 −28.745 0
5(Fusebox) 3.50 0.00062 0.00502 0.004
−27 −29 −28.964 0
6 (Furnace) 6.08 No Reception
7 (Hot Water Heater) 8.47 No Reception
8(HydroMeter) 3.00 0.00119 0.01103 0.003
−31 −43 −41.686 0
9 (On Stove) 2.80 0 0 0
−27 −38 −29.109 0
Indoor: BS at Fuse Box
1 (Dishwasher) 1.90 0.00228 0.02010 0.006 −29 −46 −40.785 1
2 (Basement Fridge) 8.50 0.00299 0.03473 0.021
−33 −50 −47.753 0
3 (Kitchen Fridge) 4.58 0.00292 0.02823 0.008
−29 −44 −42.812 0
4(Furnace1) 6.73 0.00197 0.03644 0.012
−35 −50 −47.868 0
4(Furnace2) 6.73 0.00513 0.05555 0.029
−35 −51 −48.157 1
5 (Hot Water Heater Trial 1) 8.63 0.00660 0.32110 0.136
−35 −51 −49.257 8
5 (Hot Water Heater Trial 2) 8.63 0.00638 0.11207 0.074
−36 −51 −48.640 2
6(HydroMeter) 2.00 0.00155 0.01515 0.010
−41 −46 −45.102 0
7(TV) 7.30 0.00185 0.01301 0.001
−23 −31 −30.957 0
8 (Up Two Floors) 4.33 0.00243 0.02020 0.010
−33 −47 −46.021 0
9 (Washing Machine) 6.05 0.00184 0.01511 0.007
−27 −38 −36.992 0
Indoor: BS at Furnace
1(Thermostat) 4.26 0.00095 0.00903 0.003 −37 −50 −44.742 0
Outdoor
2000−20 −29 −23.054 0
10 0 0 0
−31 −35 −33.311 0
20 0 0 0
−39 −45 −43.725 0
25 0.03134 0.79167 0.978
−48 −50 −49.318 2
(1.2 m Tx Height) 25 0.00050 0.03704 0.029
−44 −49 −46.765 1
30 0.00004 0.00502 0.004
−44 −49 −47.444 0
(1.2 m Tx Height) 30 0 0 0
−42 −47 −44.640 0
40 0 0 0
−43 −47 −44.859 0
50 0 0 0
−44 −46 −45.101 0
60 0.00002 0.00100 0.003
−45 −49 −47.039 0
70 0.00010 0.00906 0.007
−46 −49 −48.048 0
80 0.00688 0.48765 0.241
−46 −51 −49.501 10
85 0.03819 0.96970 0.822
−48 −52 −50.820 20
90 0.00375 0.34777 0.157
−48 −51 −49.491 11
95 0.09005 1.00000 0.997
−51 −52 −51.333 0
Vehicle Idle: Engine Off
1 (Behind Driver’s Visor) 0 0 0 −6 −15 −10.476 0
2 (Behind Peddles) 0 0 0
−8 −21 −12.385 0
3(InsideDoorHandle) 0 0 0
−11 −43 −21.746 0
4(InsideDoorHandle) 0 0 0
−9 −30 −16.027 0
5(InsideDoorHandle) 0 0 0
−10 −26 −17.794 0
6(InsideDoorHandle) 0 0 0
−7 −21 −12.102 0
7 (On Centre of Dash Board) 0 0 0
−5 −11 −8.898 0
8 (In the Trunk) 0 0 0
−8 −15 −11.766 0
9 (Under Driver’s Seat) 0 0 0
−9 −40 −18.677 0
6 EURASIP Journal on Wireless Communications and Networking
Table 1: Continued.
Transmitter Location Approximate
BER PER PLR
Maximum Minimum Average Number of Partial
(Description) Distance(m) RSSI RSSI RSSI Packets Dropped
10 (Under Hood, Drivers Side) 0 0 0 −23 −35 −26.287 0
11 (Under Hood, Bottom of Grill) 0 0 0
−37 −43 −39.781 0
12 (Under hood, Passengers Side) 0 0 0
−31 −33 −31.340 0
Vehicle Idle: Engine On
1 (Behind Driver’s Visor) 0 0 0 −8 −33 −15.565 0
2 (Behind Peddles) 0 0 0
−4 −41 −19.350 0
3(InsideDoorHandle) 0 0 0
−8 −21 −11.545 0
4(InsideDoorHandle) 0.00003 0.00050 0.002
−9 −46 −18.018 0
5(InsideDoorHandle) 0 0 0
−8 −19 −11.689 0
6(InsideDoorHandle) 0 0 0
−5 −16 −10.363 0
7 (On Centre of Dash Board) 0 0 0
−5 −12 −9.232 0
8 (In the Trunk) 0 0 0.001
−9 −19 −14.925 0
9 (Under Driver’s Seat) 0 0 0
−8 −36 −13.164 0
10 (Under Hood, Drivers Side) 0 0 0
−23 −30 −26.169 0
11 (Under Hood, Bottom of Grill) 0.00052 0.03711 0.030
−43 −51 −46.409 0
12 (Under hood, Passengers Side) 0 0 0
−27 −31 −29.126 0
Vehicle Driving: Street
11 (Central to Walker) 0 0 0.003 −36 −50 −42.355 0
11 (Across City) 0.00024 0.00881 0.016
−35 −52 −42.880 1
9(AcrossCity) 0.00002 0.00067 0
−14 −50 −22.095 0
11 (Walker Rd.) 0.00021 0.00672 0.01
−31 −51 −36.367 1
11 (Across City) 0.00032 0.00517 0.011
−37 −51 −43.620 1
11 (Riverside Dr.) 0.00085 0.03706 0.113
−32 −52 −43.735 4
11 (Howard Ave.) 0.00025 0.01690 0.013
−32 −51 −44.320 0
Vehicle Driving: Expressway
11 (Central to Lesperance) 0.00017 0.01076 0.009 −37 −51 −41.985 1
11 (Lesperance to Central) 0.00125 0.04766 0.193
−37 −52 −44.097 6
11 (Central to Lesperance) 0.00128 0.04348 0.082
−37 −52 −44.903 2
11 (Banwell to Walker) 0.00005 0.00250 0.001
−32 −51 −37.704 0
11 (Central to Banwell) 0.00025 0.01087 0.019
−37 −51 −43.200 0
11 (Banwell to Howard) 0 0 0
−32 −43 −37.357 0
Machine Shop: BS in Office
1 (Head Height) 10.60.00022 0.00503 0.006 −35 −50 −38.354 0
2 (Shoulder Height) 11.50.00387 0.13726 0.493
−41 −52 −47.809 3
2 (On Light Banister: 2.4 m) 11.50.00047 0.00804 0.005
−41 −51 −44.994 0
3 (Shoulder Height: Off)7.6000
−33 −46 −38.079 0
3 (Shoulder Height: On) 7.6000
−33 −48 −36.855 0
4 (Shoulder Height) 13.60.00051 0.02156 0.026
−40 −51 −45.188 0
5 (Shoulder Height) 15.40.00119 0.05606 0.130
−40 −51 −46.939 4
6 (Shoulder Height) 10.90.08955 1.00000 0.976
−46 −52 −51.125 6
7 (Waist Height) 5.80.00010 0.00201 0.004
−33 −51 −39.376 0
8 (Head Height) 6.20.00423 0.07000 0.101
−35 −52 −42.795 1
9 (Head Height) 8.60.00220 0.04158 0.064
−36 −53 −44.581 2
Machine Shop: BS in Centre of Shop Floor
1 (Head Height) 4.0000−26 −33 −28.839 0
2 (Shoulder Height) 4.0000
−29 −37 −33.631 0
3 (Shoulder Height) 3.50.00001 0.00100 0.001
−33 −49 −39.208 0
4 (Shoulder Height) 5.6000
−29 −37 −31.397 0
5 (Shoulder Height) 7.8000
−33 −42 −36.819 0
6 (Shoulder Height) 8.7 No Reception
7(WaistHeight) 10.70.00657 0.23366 0.502
−44 −52 −48.588 7
EURASIP Journal on Wireless Communications and Networking 7
Up
Down
Hydro meter
BS
spot
1
2
3
5
6
1
3
6
1
(a)
BS
spot
3
BS
spot
2
Up
HW
Fuse box
Furnace
1
4
2
4
5
7
9
8
(b)
Figure 4: (a) Main Floor Layout. (b) Basement Layout. The triangles represent the transmitter test locations. Red is for trials conducted with
the BS in the kitchen. Green is for trials with the BS at the fuse box. Blue is for the trial with the BS at the furnace.
there was no movement of residents in the house during test
execution and each location/trial called for 1000 packets to
be transmitted at a rate of 5 packets per second.
The results were very good when the BS was located
in the kitchen while the transmitter was placed at either
the various kitchen appliances, the electricity (hydro) meter
directly outside of the kitchen wall, or one floor below.
However, reception was either extremely poor or nonexistent
for certain key areas such as the hot water heater and furnace
in the basement. In these cases the direct transmission path
wasimpededbyseveralwallsandappliancessuchasa
refrigerator, stove, or furnace.
When the BS was located in the basement at the fuse box,
the results were much better. There was reception from all
key locations and this proved to be a more ideal location for
a BS. For the final indoor test the BS and transmitter were
not located very far apart, even though they were on separate
floors. The transmission was reliable with less than a 1% PER
8 EURASIP Journal on Wireless Communications and Networking
8
34
12
7
BS
9
5
6
10
11
12
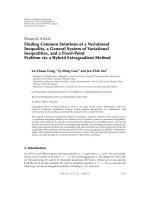
Figure 5: Test vehicle and transmission locations.
and 0.09% BER demonstrating that a wireless connection
between furnace and thermostat is viable.
Since no two indoor environments are the same, it is
difficult to formulate precise conclusions. Nevertheless, these
results give a good indication on how ZigBee may perform in
a home automation system. Although performance greatly
depends on the indoor layout and node locations, it may be
agoodideatohaveaBSforeveryfloorinahome,orone
for every 7 meters (m) radius. This radius can be increased
if ZigBee uses mesh network technology, where some nodes
may relay packets for others.
3.2. Outdoor. The outdoor tests were conducted in two
different large open fields. The results for both were very
similar. The transmitter node was placed on a tripod so that
its antenna was 1.5 m above the ground. The BS’s receiving
antenna was 1.15 m above the ground and the laptop was
positioned behind and below it to minimize interference.
For each trial 1000 packets were transmitted at 5 packets per
second. It was mostly sunny and there was no precipitation
during these tests.
As can be seen, the error rates start to significantly climb
beyond a 70 m distance. Strangely, the devices experienced
a poor communication region between 20 m and 30 m.
However, when the height of the transmitter was changed,
reception greatly improved. This was likely caused by multi-
paths destructively interfering given the original height of the
antennas and the distance between them. Furthermore, the
reception at 90 m was more reliable than at 80 m and 85 m.
This could be attributed to small scale fading as described
in the 20 m to 30 m fading region. Although extremely poor,
there was still reception at 95 m, and no reception was
experienced at 100 m. This test showed that a distance of
70 m appears to be a reliable range if the transmitter is at least
1 m above the ground with no obstructions.
3.3. Automotive Internal Monitoring. For this test a 1994
Toyota Corolla was used. The BS mote receiver was placed in
the closed glove box closest to the centre of the car. In the
event that ZigBee technology is used in this environment,
we hypothesized that the master node would be located
somewhere in the front dashboard. Also, only one person
was present in the car during the trials and was sitting in
the driver’s seat. The transmitter node was placed at twelve
key locations around the car including under the hood, in
the trunk, and in the passenger cabin as shown in Figure 5.
All twelve trials were conducted both when the engine was
on and off, but always in park. Each trial had 1000 packets
transmitted at 5 packets per second. Although the state
of the engine had little effect on the performance, errors
only occurred when the engine was running. Generally, all
packets were received and error free in almost all trials.
The biggest interferer seemed to be the human body if
it was located in between the transmitter and receiver
nodes.
In addition to the above automotive tests, trials were
conducted with the transmitter under the hood (at position
11) while driving on the expressway and through the city.
The city driving trials were typical 15-minute drives (4500
packets at 5 packets per second) while zigzagging across the
city. There were plenty of stops, turns, and straight runs. The
speed of the car ranged from 0 km/h to 65 km/h. The wireless
transmissions performed the best when the car was either
stopped or moving at an approximate constant velocity. The
majority of the bit errors were observed to occur during
acceleration. This is not to say that they occurred during all
accelerations, nor did they only occur during acceleration.
The expressway test was interesting in that on some
trials almost all packets were transmitted perfectly, and on
others trials packet transmission was not so impressive.
It is possible that the wind from the high speeds altered
the antenna position when driving in one direction and
not the other. The speed of the car during the expressway
trials ranged from 100 km/h to 120 km/h and trials had
either 1500 or 1200 packets transmitted at 5 packets per
second. The communication performance in the car was
much better than expected, particularly for the expressway
and city driving tests with the worst case scenario having a
PERof4.8%.
3.4. Machine Shop Floor. Trials were conducted in a similar
fashion as in the indoor test. Two separate locations were
used for the BS while several key spots were chosen to place
the transmitter. Figure 6 shows the layout of the machine
shop. Shop workers were present and were free to move
around during testing. Shop machines were on and off as the
workers proceeded with their normal daily work schedule.
When the BS was at the first location there are two
noteworthy points to make. The first is that when the
transmitter was on the CNC lathe machine (position 3),
the test was conducted twice, once with the machine off
and then once with it running. The running lathe machine
had virtually no effect on the results from the first trial.
The second noteworthy point is the drastically improved
reception at position 2 when the transmitter was placed high
on the ceiling lights compared to at shoulder height.
The second BS position in the middle of the shop floor
had much better reception results overall, since it was closer
to most of the transmitter locations. There was not any
reception with the transmitter at position 6, since it was
behind a thick concrete wall. Also, there was poor reception
at position 7, which is likely attributed to the fact that a
worker was standing directly in the transmission path while
operating one of the machines. The machine shop illustrated
that a BS for every 10 m without major obstructions would
be appropriate.
EURASIP Journal on Wireless Communications and Networking 9
BS
spot
2
BS
spot
1
1
2
4
3
5
6
7
8
9
Figure 6: Machine shop layout.
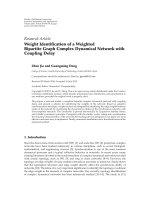
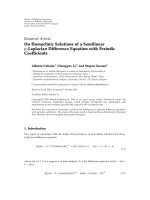
3.5. Bit Error Locations. Aswasmentioned,thistestbedis
able to determine the position of every bit error that occurs.
Figure 7 displays the bit error distributions for the individual
tested environments. A uniform distribution is discovered
for all locations except for the machine shop. This exception
is represented by a slight increase in bit errors toward the end
of the packets.
3.6. Multiple Access. The transmit and receive buffer sizes for
the CC2420 radio on the MicaZ motes are equivalent. As a
result, the motes are capable of receiving data at the same
rate they can send data. With only one transmitter sending
data to the BS, a maximum transmit rate of 19.7 kilo bits per
second (kbps) is found. This transmission rate is bounded
by the serial connection speed. Otherwise ZigBee allows up
to 250 kbps operation in the wireless channel.
The ZigBee motes implement carrier sense multiple
access (CSMA). This means that before the radio transmits,
it senses the wireless channel to see if it is currently busy.
If not then there is a small back off time before the
transmission that is the same for all devices. If the channel
is currently in use, then the device will wait a small random
amount of time and then try again. The drawback transpires
when two motes want to transmit at the same time. Both
motes will sense that the channel is not being used, they
will transmit, and a collision will take place. This can be
avoided using a more sophisticated multiple access scheme,
or scheduling algorithm. At its best, the BS will receive all
the transmitted packets as long as the combined sending rate
of all transmitters do not exceed the maximum transmission
rate of the interface between ZigBee and the computer. In our
set-up, this rate was 19.7 kbps.
4. Conclusion
This paper has provided a flexible testbed that is capable
of determining many performance measurements, and also
gives a detailed description of its structure and operation.
This testbed was used to discover ZigBee’s natural commu-
nication capabilities in four different practical environments
without any additional techniques to improve reception.
From these tests, some notable observations can be made.
Firstly, none of the environments tested extremely hindered
the communication of the MicaZ motes. Based on these
results, it is reasonable to believe that these devices are
capable of operating in similar conditions, and that they
will be even more reliable as technology advances. Secondly,
the absorption of the human body reduces the receiver’s
ability to interpret the signal by decreasing the RSSI value
20 to 30 units. This is more severe than multi paths created
by reflections from walls and metal objects. Consequently,
performance of the wireless connections greatly depends
on the transmitter and receiver locations. As discovered in
the machine shop, higher installation locations are better
in order to avoid signal reflection and absorption from
machines and workers. It was also noticed in the outdoor
trials that the closer the transmitter was to the ground, the
shorter the communication range became.
10 EURASIP Journal on Wireless Communications and Networking
30282624222018161412108631
Packet byte position
Inside (BS kitchen)
0
10
20
30
40
50
60
Number of bit errors
(a)
30282624222018161412108631
Packet byte position
Indoor (BS at fusebox)
0
50
100
150
200
250
300
350
Number of bit errors
(b)
30282624222018161412108631
Packet byte position
Outdoor
0
20
40
60
80
100
120
140
160
180
Number of bit errors
(c)
30282624222018161412108631
Packet byte position
City driving
0
10
20
30
40
50
60
70
Number of bit errors
(d)
30282624222018161412108631
Packet byte position
Expressway driving
0
5
10
15
20
25
30
35
40
45
Number of bit errors
(e)
30282624222018161412108631
Packet byte position
Machine shop (BS in office)
0
20
40
60
80
100
120
140
160
180
Number of bit errors
(f)
30282624222018161412108631
Packet byte position
Machine shop (BS out on floor)
0
5
10
15
20
25
30
35
40
45
50
Number of bit errors
(g)
Figure 7: Bit error histograms broken down by their byte position within the data packets.
EURASIP Journal on Wireless Communications and Networking 11
An important general point is that, all the environments
tested do not necessarily require strict, low-power consump-
tion restrictions. The ZigBee devices can transmit at a higher
power without considering battery life if they are connected
to the power supply of a building, or vehicle. Connecting
directly to the power supply would also help avoid the need to
regularly change batteries. With this in mind, it is possible to
use ZigBee devices with a higher transmitting power in order
to help overcome interference from noise or obstructions.
References
[1] M. Hameed, H. Trsek, O. Graeser, and J. Jasperneite, “Per-
formance investigation and optimization of IEEE802.15.4 for
industrial wireless sensor networks,” in Proceedings of the IEEE
Symposium on Emerg ing Technologies and Factory Automation
(ETFA ’08), pp. 1016–1022, Hamburg, Germany, September
2008.
[2] M. Zeghdoud, P. Cordier, and M. Terr
´
e, “Impact of clear
channel assessment mode on the performance of ZigBee
operating in a WiFi environment,” in Proceedings of the 1st
Workshop on Operator-Assisted (Wireless-Mesh) Community
Networks (OpComm ’06), Berlin, Germany, September 2006.
[3] M. U. Ilyas and H. Radha, “Measurement based analysis and
modeling of the error process in IEEE 802.15.4 LR-WPANs,”
in Proceedings of the 27th IEEE Conference on Computer
Communications (INFOCOM ’08), pp. 1948–1956, Phoenix,
Ariz, USA, April 2008.
[4]M.Ahmed,C.U.Saraydar,T.Elbatt,J.Yin,T.Talty,and
M. Ames, “Intra-vehicular wireless networks,” in Proceedings
of the IEEE Global Telecommunications Conference (GLOBE-
COM ’07), Washington, DC, USA, November 2007.
[5] D. Sexton, M. Mahony, M. Lapinski, and J. Werb, “Radio
channel quality in industrial wireless sensor networks,” in
Proceedings of the ISA/IEEE Sensors for Industry Conference
(Sicon ’05), pp. 88–94, Houston, Tex, USA, February 2005.
[6] C. Reinisch, W. Kastner, G. Neugschwandtner, and W.
Granzer, “Wireless technologies in home and building
automation,” in Proceedings of the IEEE International Confer-
ence on Industrial Informatics (INDIN ’07), vol. 1, pp. 93–98,
Vienna, Austria, July 2007.
[7] H. S. Kim, J H. Song, and S. Lee, “Energy-efficient traffic
scheduling in IEEE 802.15.4 for home automation networks,”
IEEE Transactions on Consumer Electronics, vol. 53, no. 2, pp.
369–374, 2007.
[8] H. Huo, Y. Xu, C. C. Bilen, and H. Zhang, “Coexistence issues
of 2.4 GHz sensor networks with other RF devices at home,”
in Proceedings of the 3rd International Conference on Sensor
Technologies and Applications (SENSORCOMM ’09), pp. 200–
205, Athens, Greece, June 2009.
[9] A. Fort, C. Desset, P. Wambacq, and L. V. Biesen, “Indoor
body-area channel model for narrowband communications,”
IET Microwaves, Antennas and Propagation, vol. 1, no. 6, pp.
1197–1203, 2007.
[10] J. Wilson, V. Bhargava, A. Redfern, and P. Wright, “A wireless
sensor network and incident command interface for urban
firefighting,” in Proceedings of the 4th Annual International
Conference on Mobile and Ubiquitous Systems: Computing,
Networking and Services (MobiQuitous ’07), Philadelphia, Pa,
USA, August 2007.
[11] A. D. Siuli Roy and S. Bandyopadhyay, “Agro-sense: precision
agriculture using sensor-based wireless mesh networks,” in
Proceedings of the 1st ITU-T Kaleidoscope Academic Confer-
ence: Innovations in NGN: Future Network and Services (K-
INGN ’08), Geneva, Switzerland, May 2008.
[12] M. Lin, Y. Wu, and I. Wassell, “Wireless sensor network:
water distribution monitoring system,” in Proceedings of the
IEEE Radio and Wireless Symposium (RWS ’08), pp. 775–778,
Orlando, Fla, USA, January 2008.
[13] P. Casey, Design and implementation of a cross-platform
sensor network for transmission line monitoring, M.S. thesis,
University of Windsor, Windsor, Canada, 2009.
[14] X. Huang, Q. Sun, and J. Ding, “An on-line monitoring system
of transmission line conductor de-icing,” in Proceedings of the
3rd IEEE Conference on Industrial Electronics and Applications
(ICIEA ’08), pp. 891–896, Singapore, June 2008.
[15]H M.Tsai,O.K.Tonguz,C.Saraydar,T.Talty,M.Ames,
and A. MacDonald, “Zigbee-based intra-car wireless sensor
networks: a case study,” IEEE Wireless Communications, vol.
14, no. 6, pp. 67–76, 2007.
[16] V. C. Gungor and G. P. Hancke, “Industrial wireless sen-
sor networks: challenges, design principles, and technical
approaches,” IEEE Transactions on Industrial Electronics, vol.
56, no. 10, pp. 4258–4265, 2009.
[17] L. Tang, K C. Wang, Y. Huang, and F. Gu, “Channel
characterization and link quality assessment of IEEE 802.15.4-
compliant radio for factory environments,”
IEEE Transactions
on Industrial Informatics, vol. 3, no. 2, pp. 99–110, 2007.
[18] Crossbow Technology, May 2009, .
[19] TinyOS, May 2009, .
[20] Chipcon,“CC2420 Data Sheet,” May 2009, />docs/prod/folders/print/cc2420.html.