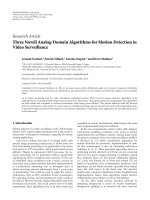
báo cáo hóa học:" Research Article Linking Users’ Subjective QoE Evaluation to Signal Strength in an IEEE 802.11b/g Wireless LAN Environment" doc
Bạn đang xem bản rút gọn của tài liệu. Xem và tải ngay bản đầy đủ của tài liệu tại đây (9.8 MB, 12 trang )
Hindawi Publishing Corporation
EURASIP Journal on Wireless Communications and Networking
Volume 2010, Article ID 541568, 12 pages
doi:10.1155/2010/541568
Research Article
Linking Users’ Subjective QoE Evaluation to Signal Strength in
an IEEE 802.11b/g Wireless LAN Environment
Katrien De Moor,
1
Wout Joseph,
2
Istv
´
an Ketyk
´
o,
2
Emmeric Tanghe,
2
Tom Der yckere,
2
Luc Martens,
2
and Lieven De Marez
1
1
Department of Communication Sciences, Ghent University/IBBT, Korte Meer 7-9-11, 9000 Ghent, Belgium
2
Department of Information Technology, Ghent University/IBBT, Gaston Crommenlaan 8, 9050 Ghent, Belgium
Correspondence should be addressed to Katrien De Moor,
Received 30 July 2009; Revised 3 November 2009; Accepted 7 February 2010
Academic Editor: Andreas Kassler
Copyright © 2010 Katrien De Moor et al. This is an open access article distributed under the Creative Commons Attribution
License, which permits unrestricted use, distribution, and reproduction in any medium, provided the original work is properly
cited.
Although the literature on Quality of Experience (QoE) has boomed over the last few years, only a limited number of studies
have focused on the relation between objective technical parameters and subjective user-centric indicators of QoE. Building on
an overview of the related literature, this paper introduces the use of a software monitoring tool as part of an interdisciplinary
approach to QoE measurement. In the presented study, a panel of test users evaluated a mobile web-browsing application (i.e.,
Wapedia) on a PDA in an IEEE 802.11b/g Wireless LAN environment by rating a number of key QoE dimensions on the device
immediately after usage. This subjective evaluation was linked to the signal strength, monitored during PDA usage at four different
locations in the test environment. The aim of this study is to assess and model the relation between the subjective evaluation of
QoE and the (objective) signal strength in order to achieve future QoE optimization.
1. Introduction
In today’s mobile ICT environment, a plethora of innova-
tions on the market are pushing the boundaries of what is
technically feasible and offering new technologies and access
networks to end-users. It is often assumed that the growth
and optimization on the supply side will automatically
result in their swift adoption on the consumption side.
In this respect, however, numerous examples of failing
innovations seem to confirm the observation that end-users
nowadays display a greater selectivity and a more critical
attitude in their adoption and appropriation behavior. It is
believed that new applications and services are increasingly
evaluated by users in terms of Quality of Experience (QoE).
Moreover, it is assumed that applications or services that
meet users’ requirements and expectations and that allow
them to have a high QoE in their personal context will
probably be more successful (e.g., in terms of adoption)
than applications or services that fail to meet users’ high
demands and expectations. As a result, the importance of a
far-reaching insight into the expectations and requirements,
as well as into the actual quality of users’ experiences
with mobile applications, is widely acknowledged. To date,
however, it is still largely unknown how the objective
and subjective counterparts of these experiences can be
measured and linked to each other in order to achieve further
optimization.
In this paper, we therefore focus on the crucial, but often
overlooked, relation between technical quality parameters
and subjective indicators of QoE. Indeed, in line with [1],
QoE is conceived as a multidimensional concept that consists
of both objective (e.g., network-related parameters) and
subjective (e.g., contextual, user-related) aspects. In this
respect, the paper presents a software tool that is embedded
in an interdisciplinary approach for QoE measurement and
that enables us not only to assess the subjective evaluation
of QoE by end-users and to monitor Quality of Service-
(QoS-) related aspects of mobile applications, but also to
model their relation in order to achieve the optimization of
QoE. As an illustration, this paper shares results from an
empirical study in which a mobile web-browsing application
(Wapedia) was tested on a Personal Digital Assistant (PDA)
2 EURASIP Journal on Wireless Communications and Networking
and evaluated in terms of QoE by a user panel in an
indoor IEEE 802.11b/g Wireless LAN environment. By
means of a short questionnaire presented to the users on the
device, a number of key QoE dimensions were evaluated.
This subjective evaluation was then linked to the signal
strength, whose usage was monitored by means of the above-
mentioned software tool at four different locations in the test
environment. The aim of this study is to assess and model the
relation between the subjective QoE (as evaluated by the test
users) and signal strength in order to gain more insight into
the interplay between these components of QoE, information
that is crucial for its optimization.
The remainder of this paper is organized as follows.
Section 2 deals with related work from the literature,
while Section 3 expands on the proposed interdisciplinary
approach for user-centric QoE measurement and the soft-
ware tool for determining the relation between objective
and subjective QoE dimensions. Details about the study
setup are discussed in Section 4, followed by an overview
and discussion of the results in Section 5. Finally, Section 6
is dedicated to our conclusions and suggestions for future
research on QoE in mobile living lab environments.
2. Related Work
2.1. Definition and Dimensions of Quality of Experience. A
review of the relevant literature shows that most defini-
tions and empirical studies of QoE tend to stay close to
the technology-centric logic and disregard the subjective
character of user experiences [2, 3]. It is rather uncom-
mon to integrate concepts from other fields less technical
than telecommunications in definitions of QoE. A relevant
example is the domain of “Human-Computer Interaction,”
in which concepts such as “User Experience” and “Usability”
closely related to QoE are very important [4].
Often, narrow, technology-centric interpretations of
QoE go hand in hand with the assumption that by optimizing
the QoS, the end-user’s QoE will also increase. However, this
is not always the case: even with excellent QoS, QoE can be
really poor [5]. There are several examples of studies where
QoE is interpreted in such a narrow way. For example, in
[2], the QoS of the network is seen as the main determinant
of QoE. In [3], QoE is defined as the “general service
application performance,” consisting of properties (such
as service accessibility, availability, and integrity) that are
measured during service consumption. In yet another study
[6], QoE is determined by looking at the video quality within
a video-conferencing system.
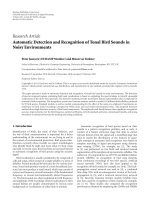
In this paper, however, QoE is approached from a broader
interdisciplinary perspective. It is seen as a multidimensional
concept that consists of five main building blocks. The
identification of these building blocks and their integration
into a more comprehensive model of QoE are based on a
thorough literature review and a consultation with interna-
tional experts on QoE, QoS and User Experience. This model
does not only take into account how the technology performs
in terms of QoS, but also what people can do with the
technology, what they expect from it, in what context people
use it/intend to use it, and to what degree it meets their
expectations [7]. It represents a classification of the wide
range of aspects and metrics that may influence the quality
of a user’s experience when using a certain application or
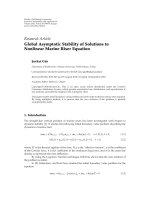
service. These five building blocks, which are shown in
Figure 1,areasfollows[7].
(i) Qualit y of Effectiveness . It deals with technical per-
formance (at the level of the network, infrastructure,
application, and device). This building block repre-
sents the traditional QoS parameters, which represent
acrucialcomponentofQoE.
(ii) Qualit y of Efficiency. It determined by the way
technical performances are appreciated by the user,
thus requiring a subjective evaluation.
(iii) Usability. It deals with how easy it is for the user to
accomplish tasks.
(iv) Expectations. The quality of users’ experiences (good
or bad) is influenced by the degree to which users’
expectations “ex ante”aremet.
(v) Context. It deals with the various contextual aspects
that might influence a user’s QoE (e.g., individual
context, social context, etc.).
The empirical study presented in this paper draws on
this conceptual definition of QoE. Similar to this concep-
tualization, both technical and nontechnical dimensions
are identified in [8]. This approach distinguishes between
measurable and nonmeasurable metrics.
In Section 3, we demonstrate the way in which the
identified building blocks were integrated into our approach
and how the selected QoE dimensions were measured. In the
next section, we discuss some of the current approaches for
QoE measurement.
2.2. Measuring QoE. The literature on QoE measurement
usually draws a distinction between objective and subjective
assessment methods. These aim to evaluate that “perceived
QoEs” from a user perspective are not automated and involve
real users to some degree. As a result, they are usually
considered as too time-consuming and too expensive [9].
Although one could expect “subjective methods” to allow
researchers to gain a deeper understanding of the subjective
dimensions of QoE (see Section 2.1), this seems to be a
misconception. The use of Mean Opinion Scores (MOSs)
as a subjective performance measure is rather common in
QoE measurement. Although MOS testing has a “subjective
measure” label, it draws on the conversion of objective
quantities into subjective scores [10, 11]. It is an approach
that is used for the evaluation of quality parameters by users
and by means of standardized scales (with labels such as
Excellent, Good, Fair, Poor, Bad [12]). For a number of
reasons, the use of MOS testing has been criticized and
extended to other “subjective” measures such as acceptability
measures and (semi-) automated subjective measures such as
the Pseudosubjective Quality Assessment (PSQA) [11, 13].
Perceptual objective test methods such as Perceptual
Evaluation of Speech Quality (PESQ) [14, 15]andPerceptual
EURASIP Journal on Wireless Communications and Networking 3
Application/service
Server
Network
Device/handset
Device/handset
Network
Application/service
Usability
Environmental context
Personal and social context
Cultural context
Te c h n o l o g i c a l c o n t e x t
Organisational context
Context
Expectations
Quality of efficiency
∼Does it work well
enough for the user?
Quality of effectiveness
∼Does it work?
QoS
Experience limited to the
specific technology/device
and its performance
QoE
From user’s point of view
Experience in broader context
Figure 1: Conceptual model of QoE [7].
Evaluation of Video Quality (PEVQ) [16, 17] can also be
mentioned in this context. Both are objective, automated
assessment methods that involve perceptual models of
human behavior. They are based on real subjective tests
and enable researchers to assess speech and video quality,
respectively, as experienced by users.
Whereas the MOS concept is mainly used in the voice
domain as a subjective measure of voice quality, similar con-
cepts have been developed to measure performance aspects
of web-browsing in a user-centric way (i.e., the concept
of dataMOS) [10]. Although this study and others [18]
have tried to relate technical parameters to the (somewhat
ambiguous) concept of “perceived QoE,” these approaches
have been criticized from a more user-oriented perspective
for various reasons, for example, undervaluation of the
subjective character of QoE, little attention to the influence of
contextual variables, only one research context, and so forth.
However, an increasing number of studies have tried
to go beyond the limitations of “single-context” research
environments. Ponce de Leon et al. [19] studied QoE in a
distributed mobile network testbed environment drawing on
the living lab approach. Perkis et al. [8] discuss a framework
for measuring the QoE of multimedia services, while Li-
yuan et al. [18] describe a new approach for evaluating QoE
in a pervasive computing environment. In the context of
measuring QoE in natural settings, some existing solutions
such as the mobile QoS agent (MQA), which can be used
for the measurement of service quality on cellular mobile
terminals, can be mentioned [3]. Although these solutions
for collecting data regarding the “What?” dimension of QoE
in the context of mobile and wireless network usage are
very valuable, they do not allow us to gain insights into
the more subjective (e.g., “Why?” “Where?” “With whom?”)
dimensions of QoE that were identified in Section 2.1.We
believe that the combination of state-of-the-art technical
measures and user-oriented measurement techniques might
offer important opportunities in this respect. This also
implies that the evaluation of QoE should be embedded
in an interdisciplinary approach, in which the traditional
testbed setting is extended to a more user-centric, flexible,
and multicontext research environment. In this respect, it
is relevant to mention the open-source MyExperience tool
[20] for supporting computerized in situ data collection
that draws on experience sampling (self-reports) in natural
settings. Once implemented on a mobile device, this device
becomes a data collection instrument. A similar approach
underlies this study.
3. An Interdisciplinary QoE
Measurement Approach
3.1. Five-Step Interdisciplinary Approach for User-Centric QoE
Measurement. As mentioned above, the use of the software
tool presented in this paper is embedded in an interdisci-
plinary approach for user-centric QoE measurement. In this
context, “interdisciplinary” refers to our multidimensional
conceptualization of QoE. It implies that for the evaluation
of the five distinct dimensions identified in Section 2.1,a
more holistic and integrated approach is required. As a
result, our proposed approach combines knowledge and
tools from different disciplines in order to link user-centric
QoE evaluation measures to technical (QoS-related) QoE
parameters and to model the relation between the former
and the latter. This interdisciplinary methodology consists of
the following steps.
4 EURASIP Journal on Wireless Communications and Networking
(1) Preusage user research based on a combination of
qualitative and quantitative methods; that is, to
detect the “most relevant QoE dimensions and users”
expectations based on a tailored concretization of the
conceptual model described in Section 2.1.
(2) Preusage translation workshops to find an optimal
match between user-indicated QoE dimensions and
measurable and objective QoE parameters. This step
intends to bridge the gap between the social/user
perspective and the technical perspective.
(3) Monitoring of QoS parameters during usage: this step
includes the actual usage of the selected application
or service by the test users. In order to collect the
relevant data, a software probe model that measures
data across different QoE dimensions was developed.
This software tool is described in detail in Section 3.2.
(4) Postusage questions on device (e.g., PDA): during this
step, respondents receive a number of questions on
the device asking them to evaluate the quality of
their experience by rating a number of relevant QoE
dimensions (based on the conceptual model and the
outcomeofstep(1).
(5) Postusage comparison of expectations versus the quality
of the experience in order to identify and explain
differences/matches between expectations and actual
experiences (based on information gathered in step
(3) and further user research).
This paper will restrict itself to focus mainly on the
monitoring of QoS parameters during usage (step (3)). In the
discussion of the study setup (Section 4), we also elaborate
on the postusage questions on the device (step (4)) that
served as an evaluation of QoE by the test users.
3.2. Software Monitoring Tool. The idea of the monitoring
tool is proposed in [21, 22]. The QoE engine is the core
system that coordinates all the actions involved in QoE
monitoring and assessment. It facilitates the measurement of
QoE as a multidimensional concept that is built according to
a probe model and distributed across end-user devices and
the network. In order to collect the relevant information,
this probe model measures data across the different building
blocks that might influence users’ QoE (see Section 2.1).
It is an insitu application [23] connected to back-end
infrastructure that stores and analyzes the incoming data.
Our monitoring tool consists of three layers, with each
one consisting of one or more software monitoring probes.
These are modular components that can be inserted, enabled,
or disabled within the QoE engine. The coordination of all
these components is executed by means of a QoE processor.
Each probe fulfills a specific task.
(i) The contextual probes consist of software probes
that deal with the determination of the context of
the application usage. This can consist of GPS data
(environmental context), information coming from
the user’s agenda, or data reflecting the user’s current
mood or activities.
(ii) The experience probes consist of the software probes
with built-in intelligence in order to capture the sub-
jective character of users’ experiences. For example,
automatic questionnaires can be sent to the user on
the mobile device before, after, or even during appli-
cation usage. Other examples include the detection of
application usage by monitoring keystrokes, tracing
events (such as video player activity based on system
logs, changes in location, etc.), and the like.
(iii) The QoS probes consist of the software probes
that deal with the monitoring of the technical
parameters such as network performance (e.g.,
throughput), device performance and capabilities
(e.g., CPU power), and application properties (e.g.,
video codec).
Partitioning of the monitoring model in these three
layers enables interdisciplinary collaboration among experts
with different backgrounds such as social researchers, ICT
researchers, and usability experts. Moreover, this modular
approach of the QoE engine does not only enable easy
monitoring of currently available parameters, but it can
also be extended to new parameters (e.g., face recognition,
contextual information, etc.). In view of this, additional
modules can be created and inserted into each category of
probes.
We now turn to a concrete study in which the above-
mentioned tool was used for evaluating a mobile web-
browsing application in terms of QoE. The proposed
approach (including the use of the software tool) can also
be applied to other applications and circumstances than the
ones discussed in this paper.
4. Empirical Study Setup
4.1. Ob jectives. The aim of this study was to evaluate
the QoE of a web-browsing application in a controlled
wireless environment by combining implicit, objective data
on signal strength (collected by the monitoring tool using a
QoS probe) and explicit, subjective data (on selected QoE
dimensions evaluated by test users using the experience
probe). More specifically, we wanted to investigate and model
the relation between these objective and subjective data in
order to gain more insight into the interplay between these
dimensions of QoE. The motivation for focusing on just
one technical parameter here (i.e., signal strength) stems
from the notion that QoE is a highly complex concept
consisting of various parameters and dimensions. Given this
complexity, it is necessary to gain a deeper understanding of
these distinct parameters and dimensions before the relation
between various technical parameters and subjective QoE
dimensions can be modeled successfully. Moreover, in [24],
linear regression models were given to predict QoE related to
mobile multimedia. Based on the results in that study, block
error rate (BER) appears more relevant than other quality
metrics in the prediction of QoE. Therefore, we have chosen
the signal strength as the first technical parameter to study
because it obviously has a high correlation with BER in the
case of wireless networks. Moreover, the delay also has a
EURASIP Journal on Wireless Communications and Networking 5
high level of correlation with the signal strength because at
the network layer level, the Transmission Control Protocol
resends lost packages when low-signal strength situations
occur as a result of high BERs.
We will now briefly discuss how we tried to attain
the main aim of the study by successively describing the
user panel, the application, the measurement approach and
measurement equipment, the test environment and, finally,
the evaluation procedure.
4.2. User Panel. As the current paper presents a concept
that will be extended to larger-scale research in living lab
environments, and as the setup of this kind of study is
resource-intensive, the size of the user panel in this study was
limited. The panel consisted of 10 test users (mean value M
= 35.1 years, standard deviation SD = 12.1 years) who were
recruited based on predefined selection criteria (i.e., sex, age,
profession) by a specialized recruitment office. Although this
way of working entails a significant cost, it allowed us to
compose a diverse panel consisting of people with different
profiles. The ages of the participants ranged from 19 to 51
years, and six of them were older than 30 years. Four test
users were female, and six were male. The professions of
the participants also varied: housewives, employees, workers,
and students participated. The test users completed all five
steps in the above-mentioned interdisciplinary approach:
before and after the actual usage of the application, they
were interviewed by a social scientist who inquired about
their current experiences with mobile applications and their
expectations and personal interpretation of a good/bad QoE.
However, the results from this qualitative research are not
discussed here.
4.3. Application: Wapedia. For the tests, we used a mobile
web-browsing application, Wapedia, which is a mobile
Wiki and search application. This application is similar to
“Google Internet search,” but adapted for use on PDAs and
Smartphones.
4.4. Measurement Approach and Measurement Equipment:
PDA. In this study, the experience probe (see Section 3.2)
was implemented as a questionnaire on the PDA. Using a
QoS probe, the Received Signal Strength Indication (RSSI)
was monitored. This RSSI is an indication (values ranging
from 0 to 255 depending on the vendor) of the power present
in a received radio signal and can be used to calculate the
signal strength P [25].Acontextualprobewasusedtokeep
track of the locations where the tests took place. The final
implementation of the client software was done in C# within
the NET Compact Framework 2.0 and by using Windows
Forms. Auxiliary classes were taken from the Smart Device
Framework v2.1 from OpenNetCF [26]. This framework
provided classes within which to retrieve the RSSI value for
the received power, as measured by the available wireless
network card. For the sake of reusability and extensibil-
ity, we used C# Reflection for the dynamic loading and
unloading of additional monitoring probes. The back-end
was programmed in Java using the Java Enterprise Edition
5 framework and the standard Sun Application server with
a Derby database. The communication between the client
and back-end was carried out using the SOAP (Service-
Oriented Architecture Protocol) web services protocol. For
the “mobile device,” we selected the HP IPAQ rw 6815. The
PDA/Smartphone weighs 140 g and has a 2.7” screen with a
color display. It incorporates GSM/GPRS/EDGE, WiFi (IEEE
802.11b/g), and Bluetooth. The device has 128 MB of storage
memory and 64 MB of RAM. This high-end device thus
enables access to the Internet on the move.
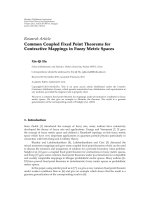
4.5. Test Environment: Indoor Wireless. The tests took place
in an indoor Wi-Fi office environment (IEEE 802.11b/g),
in which four different locations were selected. At every
location, another usage scenario had to be executed. The
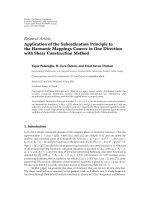
floor plan (Figure 2) provides a better overview of the test
environment and indicates the four locations (P1, P2, P3,
P4). These locations were at different distances from the
access point (type D-Link DI-624 wireless access point, red
dot in the floor plan), corresponding with different measured
signal strengths P. For example, location 1 was the closest
to the access point resulting in the highest median signal
strength.
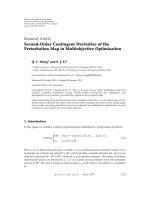
4.6. Evaluation Procedure. The flow graph of Figure 3 sum-
marizes the evaluation procedure and gives a schematic
overview of the study setup components discussed above.
As already mentioned, this paper only focuses on steps
(3) and (4) of the five-step approach described in Section 3.1.
The participants were given a PDA and after a short briefing,
they were asked to execute four usage scenarios using the
Wapedia application at the four different locations. These
locations and scenarios were selected at random for each
user. Completing a single usage scenario took about 10 to
20 minutes. Different usage scenarios were proposed. For
example, during a “holiday” in Paris, the participants had
to find out where the Mona Lisa painting was located and
retrieve some pictures of the museum, among other tasks.
For each scenario, there were different usage contexts and
topics (e.g., retrieving geographical information, looking
up information on a music band, looking for a specific
supermarket). By using different scenarios, the influence of
repeated tests was minimized.
During the tests, the received signal strength, linked
to the “Quality of Effectiveness” building block from
Section 2.1, was monitored by means of the software tool
described above. For the subjective evaluation of QoE by
the test users, a set of questions related to a number of
QoE dimensions selected from the conceptual model was
integrated into a short questionnaire. After finishing a usage
scenario, the users were asked to complete this questionnaire,
which was automatically displayed on the PDA. It contained
questions dealing with the expectations of the test users, their
evaluation of the performance, the usability and use of the
application, and their general experience. As these aspects
were discussed in detail during the qualitative preusage
interviews and during the briefing, the questionnaire itself
was deliberately kept as short as possible in order to lower
6 EURASIP Journal on Wireless Communications and Networking
P1
AP
P2
P4
P3
Figure 2: Floor plan of the test environment.
(a)
(c)
Figure 2
Quality of effectiveness
Quality of efficiency
Usability
Expectations
Context
Signal strengthSubjective QoE evaluation
Relation between subjective
QoE evaluation and true signal strength
QoS probe: monitoring of
signal strength P (dBm)
Experience probe:
questionnaire on PDA
5 building blocks
Contextual probe:
information about indoor
locations
QoE/QoS monitoring tool
Context: indoor wireless
User panel
Application: Wapedia
Device: PDA
Selection
Usage scenarios
(b)
Figure 3: Flow graph of the following procedure.
EURASIP Journal on Wireless Communications and Networking 7
the burden for the test users and in order to limit the level
of interruption. The test users were asked to evaluate these
QoE aspects by rating them on five-point Likert scales. The
interpretation of these scores was explained in the briefing.
The survey consisted of the following questions linked to a
number of dimensions from the conceptual QoE building
blocks identified in Section 2.1 (translated from Dutch).
(i) Q1: Did the application meet your expectations?
(linked to building block “Expectations” in the con-
ceptual model.) In this respect, we can also refer to
Roto [27], who stated that for mobile web-browsing
experiences, the expectations of the users have to be
taken into consideration as they might influence the
QoE as evaluated by the users.
(ii) Q2: Could you indicate whether or not you are
satisfied about the speed of the application? (linked
to building block “Quality of Effectiveness” in the
conceptual model.)
(iii) Q3: Could you indicate whether or not you found
the application easy to use? (linked to building block
“Usability” in the conceptual model.)
(iv) Q4: Could you indicate whether or not you felt frus-
trated during the usage of the application? (linked to
building block “Context” (personal context: feelings)
in the conceptual model.)
(v) Q5: After having tried the application, would you
reuse it? (linked to building block “Context” (per-
sonal context) and building block “Expectations”
[anticipation of behavior] in the conceptual model.)
(vi) Q6: In general, how would you rate your experience?
(linked to building block “Quality of Effectiveness” in
conceptual model.)
As people tend to adjust and change their expectations of
an object all the time based on both internal and external
sources, these questions were asked after every scenario.
Although the test users in this study were not aware of the
fact that the different locations corresponded with different
signal strengths, it could be interesting to investigate in future
research whether the subjective evaluation of QoE differs
significantly when users do receive information regarding
technical parameters.
After completion of the questionnaire, the monitored
signal strength and the responses were saved on the PDA and
automatically transmitted to the server for further analysis.
The 10 participants, thus, answered six questions at each of
the four locations, resulting in 60 samples per location, or
40 samples per question, and a total of 240 samples. We now
turn to the most important results of this study.
5. Results and Discussion
In this section, we first take a look at the field strengths in the
different locations. Next, the evaluation of QoE dimensions
by the test users is tackled. Finally, the relation between this
subjective evaluation of QoE dimensions and the objective
parameter of signal strength is assessed and modeled.
5.1. Technical Quality: Field Strength. A relatively constant
signal strength (with unit decibel mW, noted as dBm, and
calculated from the RSSI) for all the scenarios can be noticed.
This is expected because the tests were performed in an
indoor environment with little or no movement. The median
values for the different locations 1–4 were equal to
−43 dBm
(SD
= 4.0 dB), −61 dBm (SD = 4.0 dB), −79 dBm (SD
= 5.1 dB), and −83 dBm (SD = 4.4 dB), respectively. The
best reception conditions (QoS), that is, the highest signal
strength, were measured at locations 1 and 2. Locations 3 and
4 had the worst signal quality. In an outdoor situation, the
standard deviations would be much larger.
5.2. Evaluation of QoE Dimensions by the Test Users. First,
the experience of a randomly selected user at the different
locations is discussed. Next, differences among users are
discussed, and a comparison between different users at
different locations is made.
5.2.1. Results for a Specific User. As an illustration of
the proposed approach (see Section 3.1), and because we
believe that investigating the results of one or more specific
participants in detail might help us to gain insight into the
complex QoE concept, we first discuss the results of user 10
(male of 33 years old), who was randomly selected from the
test panel. When we consider some results for user 10 from
the research preceding the actual usage of the application
(Section 3.1, step (1)), we record that this user displayed
high expectations with respect to the availability and speed
of the network and the response time at the application level.
Moreover, these aspects were rated as very important by user
10. Steps (3) and (4) included monitoring during usage and
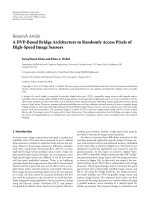
postusage question on the device ,respectively.Figure 4 shows
user 10’s ratings for all questions (Q1 to Q6) as a function of
the median signal strength P in dBm at the different indoor
locations (see Section 5.1). The ratings indicate that user 10
shows great satisfaction up to
−79 dBm, with ratings of 5
for expectations, reuse, and general experience. At
−79 dBm,
a slight reduction in speed is noticed by this user due to
the much lower signal strength; more time is needed to
load pictures, for example, onto the PDA and, as a result,
the application appears to be slower. The ratings for speed
and general experience drop significantly at
−83 dBm (rating
1). Expectations and reuse remain relatively high for user
10, and despite the bad experience at
−83 dBm, he would
still reuse this application. When we look at the level of
frustration (Q4), we notice that user 10 did not feel frustrated
at locations 1 and 2 (
−43 and −61 dBm, resp.). At location 3
(
−79 dBm), user 10 already notices the decreased speed due
to the lower signal strength. At
−83 dBm, he is slightly more
frustrated due to the very low speed. During the postusage
user research (step (5)), it became clear that respondent
10 was not very satisfied with the above-mentioned QoE
subdimensions, and given the importance attached to these
aspects, this resulted in an experience gap for user 10. This
example illustrates how the proposed approach allows us to
gain insight into the user’s subjective evaluation of QoE by
looking at what is happening at the technical level.
8 EURASIP Journal on Wireless Communications and Networking
−44 −61 −79 −83
Signal strength (dBm)
0
1
2
3
4
5
Rating (−)
(Q1) expectations
(Q2) speed
(Q3) usability
(Q4) frustration
(Q5) use again
(Q6) general
Figure 4: Ratings of the questionnaire (Q1, Q2, Q3, Q4, Q5, Q6) as
a function of the signal strength for user 10.
12345678910
User
0
1
2
3
4
5
Rating (−)
(Q1) expectations
(Q2) speed
(Q6) general
Figure 5: Actual ratings of the questionnaire (Q1, Q2, and Q6) for
all users at location 2 (high signal strength).
5.2.2. Results for All Users at Different Locations. Figure 5
shows the actual ratings for expectations (Q1), speed (Q2),
and general experience (Q6) for location 2, where a high
median signal strength of
−61 dBm is monitored. The ratings
at this location are very high: average ratings of 4.5, 4.3, and
4.4 are obtained for questions Q1, Q2, and Q6, respectively
(see also Table 1 , Section 5.3).
The ratings for the same questions at location 4 (median
P
=−83 dBm) are depicted in Figure 6. The ratings at
location 4 are considerably lower than at location 2; the
average ratings here are 3.8, 2.3, and 3.1 for questions Q1,
Q2, and Q6, respectively (see Table 1 , Section 5.3). Users 1,
5, and 10 give ratings of 1 compared to ratings of 4 or 5 at
location 2.
This shows that a relation may exist between the
subjective QoE evaluation by the test users and the signal
strength (see Section 5.3). But one has to be careful: despite
12345678910
User
0
1
2
3
4
5
Rating (−)
(Q1) expectations
(Q2) speed
(Q6) general
Figure 6: Ratings of the questionnaire (Q1, Q2, and Q6) for all
users at location 4 (very low signal strength).
the low signal quality at location 4, users 3, 6, and 8 still
had a reasonable-to-good experience, while user 9 was very
satisfied (ratings of 5 for each question). User 9 is a housewife
who is 43 years old with three children, and she mentioned
in the preusage interview that she was not familiar with
advanced mobile applications, so she was excited about the
possibilities of the application on the PDA, even when the
application worked very slowly.
In Figures 7 and 6, we compare the levels of frustration
for all users at location 2 (P
=−61 dBm) and at location
4(P
=−83 dBm). Again, the lowest level of frustration is
found at location 2; all frustration ratings are lower or equal
to the ratings at location 4, where the level of frustration
is much higher in general. But despite the low speed and
low signal strength, users 6 and 7 have the same low levels
of frustration for both locations; users 6 and 7 also had a
somewhat higher median signal strength of
−80 dBm. User
9 also gave a rating of 2 as his level of frustration for location
4. In general, though, the frustration increases for all users
when the signal strength is lower.
5.3. Relation between QoE as Subjectively Evaluated by the Test
Users and the Objective Parameter of Sig nal Strength: Models
and Discussion. In Table 1 , the average ratings (M), standard
deviations (SD), and correlation coefficients for the ratings of
Q1–Q6 at locations 1–4 are presented. The average ratings of
Q2, Q4, and Q6 at locations with high median signal strength
(locations 1 and 2) are considerably higher than at location 4
with very low signal strength.
The correlation coefficients ρ for speed (Q2), frustration
(Q4), and general experience (Q6) are 0.40,
−0.33, and 0.31,
respectively. These correlations are significant at P<.05.
They are not very high because the questions of speed and
general experience received low ratings only at the locations
EURASIP Journal on Wireless Communications and Networking 9
12345678910
User
0
1
2
3
4
5
Rating frustration (−)
Position 2
Position 4
Figure 7: Comparison of ratings of frustration (Q4) for all users at
location 2 (P
=−61 dBm) and at location 4 (P =−83 dBm).
with very low signal strengths. Moreover, some people were
relatively satisfied even when the signal strength was bad (see
also Section 5.2.2). The correlations for Q1 (expectations),
Q3 (usability), and reuse (Q5) are 0.18, 0.08, and 0.20 (with
P-values much higher than .05), respectively, indicating that
these aspects hardly depend upon signal strength.
We now investigate which questions depend upon signal
strength. Therefore, we performed an analysis of variance
(ANOVA), which tests the null hypothesis that the average
ratings at the different locations are equal:
M
Qx,pos1
= M
Qx,pos2
= M
Qx,pos3
= M
Qx,pos4
,(1)
where M is the average value of the rating of Qx (Question
x; x
= 1, 2, ,6) and pos y is the y position (y = 1, ,4).
This analysis thus tests if the average ratings for the questions
in Table 1 depend significantly on the position or median
signal strength P.
Prior to performing the analysis of variance, various
assumptions about the samples of the ratings have to be
checked. Firstly, we assume that ratings for a question at
the different positions are independent. This is realized by
defining different scenarios for the users and by randomly
assigning a location and a scenario to each user in successive
experiments (randomization) (see Section 4.6). Therefore, it
is assumed that the ratings for a question at the different
positions are independent due to experimental design.
We realize that users may be influenced by the previous
expectations or multiple uses of the Wapedia application, but
these aspects were also taken into account in the qualitative
research and in the briefing before the actual usage.
Secondly, a Kolmogorov-Smirnov (K-S) test for nor-
mality was carried out on the ratings for Q1–Q6 at the
different positions. All executed K-S tests passed at a
significance level of 5%. Thirdly, Levene’s test was applied
to the ratings for Q1–Q6 at the different positions to check
homogeneity of variances (i.e., square of SD for rating of
Qx is equal for all positions, x
= 1, ,6, see Ta ble 1 ). For
all combinations of the ratings at the different distances,
Levene’s test passed at a significance level of 5%, so the
−90 −85 −80 −75 −70 −65 −60 −55 −50 −45 −40
Median signal strength P (dBm)
1
2
3
4
5
Rating Q6: general experience (−)
Extreme
value
Linear regression
Exponential regression
Observations
Figure 8: Rating of general experience (Q6) as a function of the
monitored median signal strength and the regression fits.
assumption of homoscedasticity was met. In conclusion, all
assumptions were found to be valid [28].
The analysis of variance shows that the null hypothesis
of formula (1) was rejected for Q2 (speed), Q4 (frustration),
and Q6 (general experience). For these specific cases, Tukey’s
range test was then used for pair-wise comparison of
M
Qx,pos1
, M
Qx,pos2
, M
Qx,pos3
, M
Qx,pos4
(x = 2, 4, 6) at a simul-
taneous significance level of 5%. A significant difference in
Q2, Q4, and Q6 was found between positions 1 and 4, 2
and 4, and 3 and 4, demonstrating that for these questions,
the average ratings differ significantly for the different
positions. Ta ble 1 summarizes the results. For these ratings,
regression analysis is also provided. For Q1 (expectations),
Q3 (usability), and Q5 (reuse), the null hypothesis was not
rejected, showing that these aspects of QoE do not depend
on the different signal strengths. This was expected from
Section 5.2.2, for example, for Q5, the reuse of an applica-
tion will depend more upon the personal interests of the
participant than on the available signal strength and, thus,
speed.
Both linear and exponential regression models were
applied to the data set. In the literature, we found that in
case of real-time communication (such as voice and video
communication), exponential regression (IQX hypothesis)
[29] might be most suitable. When studying “traditional”
web-browsing experiences, however, logarithmic regression
[30]isproposed.Figure 8 shows the general experience as a
function of the monitored signal strength for all users at all
locations with both regression fits.
The observation (at
−90 dBm, experience rating of 4) is
treated as an extreme value and excluded from the analyzed
data set. It was given by user 9 (see also Section 5.2.2),
who was not familiar with advanced mobile applications
and completely fascinated by the opportunity of mobile
10 EURASIP Journal on Wireless Communications and Networking
Table 1: Average ratings and standard deviations for ratings of different locations by all users.
Question Quantity
Average rating M and SD at different locations [
−] location
Correlation coefficient
1234
Q1: expectations
M 4.3 4.5 4.2 3.8 0.18
SD 0.48 0.53 0.63 0.79 P
= .27
Q2: speed
M 4.2 4.3 3.6 2.3 0.40
SD 0.79 0.48 1.35 1.25 P
= .01
Q3: usability
M 4.1 4.0 4.1 3.4 0.08
SD 0.88 0.67 0.87 1.08 P
= .61
Q4: level of
frustration
M 1.9 1.4 2.6 3.0 −0.33
SD 1.29 0.97 1.08 1.33 P
= .03
Q5: reuse
M 4.0 3.9 4.2 4.0
−0.20
SD 0.94 1.10 0.92 0.82 P
= 0.17
Q6: general
experience
M 4.2 4.4 4.2 3.1 0.31
SD 0.42 0.52 0.63 1.52 P
= .03
Table 2: Exponential regression models for rating Q2, Q4, and Q6.
R
2
= 1-(Residual Sum of Squares)/(Corrected Sum of Squares) Exponential formula
R
2
= 0.36 Rating Q2 = 3.90 − 2.26 ∗ exp(−0.94 ∗ P − 52.55)
R
2
= 0.25 Rating Q4 = 1.93 + 2.66E − 26 ∗ exp(−0.72 ∗ P − 0.01)
R
2
= 0.74 Rating Q6 = 4.26 − 3.18E − 19 ∗ exp(−1.08 ∗ P − 45.99)
Table 3: Linear regression models for rating Q2, Q4, and Q6.
R
2
Linear formula
R
2
= 0.16 Rating Q2 = 0.03 ∗ P +5.76
R
2
= 0.11 Rating Q4 =−0.03 ∗ P +0.37
R
2
= 0.07 Rating Q6 = 0.02 ∗ P +5.1
web-browsing and who consistently gave high scores for all
of the different network conditions. The accuracy of the
exponential regression fit is larger by one order of magnitude
than the linear regression fit (data in Tables 2 and 3).
The exponential regression fits shown in Ta ble 2 were
obtained for Q2 (speed), Q4 (frustration), and Q6 (general
experience) as a function of the monitored median signal
strength P (using least-squares fit).
The linear regression fits shown in Ta ble 3 were obtained
for Q2 (speed), Q4 (frustration), and Q6 (general experi-
ence) as a function of the monitored median signal strength
P (using least-squares fit).
The slope for the ratings of Q2 and Q6 is positive and
for the level of frustration (Q4) is negative (higher signal
strength results in lower frustration).
Another approach is to build a regression tree model
[31]. In this respect, Figure 9 shows a regression tree, which
predicts the average ratings of general experience (Q6). The
R
2
of the resulting regression tree is 48%. The entry point
is at the top of the tree and the deviation is in a top-down
direction. The root is at
−81.5 dBm; in case of a lower signal
strength of
−81.5 dBm, the predicted average rating of Q6 is
2.2. This value can be found at the left side of the tree. In
case of greater signal strength (e.g.,
−69.5 dBm) on the other
SNR < −79.5
4.125 4.2
SNR <
−81.5
2.2
SNR <
−69.5
SNR < −74.5
SNR <
−51
4.143
4.6
4.2
Figure 9: Regression tree of the monitored median signal strength.
(The terminal nodes represent the average ratings of Q6.)
hand, the predicted average ratings are always higher than
4. These higher values are situated at the rightmost side
of the tree. This type of analysis could be used as input
for optimization purposes based on the predicted impact of
specific QoE parameters on a user’s experience.
It is, however, important to emphasize that these QoE
models are only valid for the Wapedia application and in
the described context of use. Our aim with these models
is not to generalize the results that were obtained. Rather,
we wanted to illustrate that there is a relation between
the subjective evaluation of QoE and an objective technical
parameter, in this case the signal strength, and that this
relation can be modeled and expressed numerically. By doing
this kind of research with large numbers of test users in
EURASIP Journal on Wireless Communications and Networking 11
flexible, multicontext living lab research environments and
with different types of applications, it may be possible to
obtain more generally usable models that can be used for
QoE optimization. Moreover, the proposed interdisciplinary
approach might also help to gain more insight not only into
the “What?” but also into the more user-centric aspects of
QoE(i.e.,“Why?”“Where?”,etc.)
6. Conclusion and Future Research
Although the literature on QoE has boomed over the
last few years, most definitions and empirical studies of
QoE tend to disregard the subjective character of the
experience concept and hold onto a narrow QoS-related
interpretation. As a result, few studies have focused on
the relation between objective technical QoE parameters
and subjective, user-centric indicators of QoE from a more
holistic and interdisciplinary perspective. In this paper, QoE
was therefore defined as a more holistic concept. Five main
building blocks that may influence the quality of a user’s
experience when using a certain application or service were
discussed.
Building on this conceptual definition of QoE and on
an overview of the relevant literature, a five-step interdisci-
plinary approach for measuring QoE as a multidimensional
concept and for relating objective technical parameters
to subjective user-related dimensions was introduced. An
essential part of this approach is the software monitoring
tool that facilitates the measurement of QoE. This tool is
built according to a probe model consisting of three layers
and is distributed across end-user devices and the network.
The modularity of the software tool implies that it can easily
be extended to new parameters. As a result, it offers many
possibilities for the development of tailored or extended
software tools for measuring the QoE of various types of
mobile media.
In this paper, we discussed the use of this software tool
in a study in which a panel of test users evaluated a mobile
web-browsing application (Wapedia) on a PDA in an indoor
IEEE 802.11b/g Wireless LAN environment. The aim was
to assess and model the relation between the subjective
evaluation of QoE and the signal strength. The test users
were asked to execute four usage scenarios at four different
locations. Immediately after completing a scenario, they were
given a short questionnaire on the device (corresponding
with QoE dimensions from the conceptual model). This
subjective evaluation was linked to the signal strength, which
was monitored during usage at the four different locations in
the test environment.
It was shown that perceived speed, frustration, and gen-
eral experience can be related to the available signal strength,
for example, average ratings of 4.3
∼4.4 for perceived speed
and general experience were obtained at a location with
high signal strength, while the average ratings decreased
to 2.3
∼3.1 at the location with very low signal strength.
Significant correlations were obtained between perceived
speed, frustration, general experience, and signal strength.
A statistical analysis of variance showed that the average
perceived speed, frustration and general experience depend
on the available signal strength. Different solutions for
modeling the relation between the subjective QoE evaluation
and signal strength were discussed.
The proposed approach and software tool offer oppor-
tunities for future large-scale research; user-centric QoE
evaluation measures could be linked to a wider range of
technical QoE parameters (e.g., delay, throughput, etc.)
in a living lab environment in order to gain insight into
and model the relation between users’ subjective QoE
evaluations and technical parameters in different contexts.
Combining these objective and subjective indicators of
QoE thus offers important opportunities for complementing
data on the “What?” dimension of QoE in the context of
mobile and wireless network usage with knowledge of the
more subjective dimensions of QoE. Future research will
therefore focus on the evaluation of more user-, context-,
device-, and network-related QoE dimensions. Moreover, in
collaboration with social scientists, the tools for evaluating
the subjective QoE dimensions can be further optimized.
Acknowledgments
This work was supported by the IBBT-ROMAS (Research
on Mobile Applications & Services) and GR@SP projects,
cofunded by the IBBT (Interdisciplinary Institute for Broad-
band Technology), a research institute founded by the
Flemish Government in 2004, and the involved companies
and institutions. W. Joseph is a postdoctoral fellow of the
FWO-V (Research Foundation-Flanders).
References
[1] K. Kilkki, “Quality of experience in communications ecosys-
tem,” Journal of Universal Computer Science,vol.14,no.5,pp.
615–624, 2008.
[2] M. Siller and J. C. Woods, “QoS arbitration for improving
the QoE in multimedia transmission,” in Proceedings of the
International Conference on Visual Information Engineering,
pp. 238–241, 2003.
[3] D. Soldani, “Means and methods for collecting and analyzing
QoE measurements in wireless networks,” in Proceedings of the
International Symposium on a World of Wireless, Mobile and
Multimedia Networks, 2006.
[4] N. McNamara and J. Kirakowski, “Defining usability: quality
of use or quality of experience?” in Proceedings of the IEEE
Professional Communication Conference, pp. 200–204, 2005.
[5] Empirix, “Assuring QoE on Next Generation
Networks,” />download/
whitepaper
NGNT AssuringQoE.pdf.
[6] A. Watson and A. Sasse, “Measuring perceived quality of
speech and video in multimedia conferencing applications,”
in Proceedings of the 6th ACM International Conference on
Multimedia, pp. 55–60, 1998.
[7] K. De Moor and L. De Marez, “The challenge of user- and
QoE-centric research and product development in today’s
ICT-environment,” in Innovating for and by Users,J.Pierson,
E.Mante-Meijer,E.Loos,etal.,Eds.,pp.77–90,Office for Offi-
cial Publications of the European Communities, Luxembourg,
UK, 2008.
[8] A. Perkis, S. Munkeby, and O. I. Hillestad, “A model for
measuring quality of experience,” in Proceedings of the 7th
12 EURASIP Journal on Wireless Communications and Networking
Nordic Signal Processing Symposium (NORSIG ’06), pp. 189–
201, 2006.
[9] P. Casas, P. Belzarena, and S. Vaton, “End-2-end evaluation
of ip multimedia services, a user perceived quality of service
approach,” in Proceedings of the 18th ITC Specialist Seminar on
Quality of Exp erience, pp. 13–23, 2008.
[10] M. Andrews, J. Cao, and J. McGowan, “Measuring human
satisfaction in data networks,” in Proceedings of the 25th IEEE
International Conference on Computer Communications, 2006.
[11] T. D. De Koning, P. Velthoven, H. Knoche, et al., “Of MOS
and men: bridging the gap between objective and subjective
quality measurements in Mobile TV,” in Multimedia on Mobile
Devices, Proceedings of the SPIE, p. 65070P, 2007.
[12] A. E. Mahdi, “Voice quality measurement in modern telecom-
munication networks,” in Proceedings of the 6th EURASIP
Conference Focused on Speech and Image Processing, Multime-
dia Communications and Services, Systems, Signals and Image
Processing, pp. 25–32, 2007.
[13] F. Perreira and I. Burnett, “Universal multimedia experiences
for tomorrow,” IEEE Signal Processing Magazine,vol.20,no.2,
pp. 63–73, 2003.
[14] A. E. Mahdi and D. Picovici, “Advances in voice quality
measurement in modern telecommunications,” Digital Signal
Processing, vol. 19, no. 1, pp. 79–103, 2009.
[15] ITU-T, “P.862 perceptual evaluation of speech quality (PESQ),
an objective method for end-to-end speech quality assessment
of narrow-band telephone networks and speech codecs,”
.
[16] ITU-T, “J.247 objective perceptual multimedia video qual-
ity measurement in the presence of a full reference,”
/>[17] A. Rossholm and B. L
¨
ovstr
¨
om, “A new low complex reference
free video quality predictor,” in Proceedings of the 10th IEEE
Workshop on Multimedia Signal Processing, pp. 769–772, 2008.
[18] L. Li-Yuan, Z. Wen-An, and S. Jun-De, “The research of quality
of experience evaluation method in pervasive computing envi-
ronment,” in Proceedings of the 1st International Symposium on
Pervasive Computing and Applications, pp. 178–182, 2006.
[19] M. Ponce de Leon, M. Eriksson, S. Balasubramaniam,
et al., “Creating a distributed mobile networking testbed
environment—through the Living Labs approach,” in Proceed-
ings of the 2nd International IEEE/Create-Net Conference on
Testbeds and Research Infrastructures for the Development of
Networks and Communities, 2006.
[20] S. Consolvo, B. Harrison, I. Smith, et al., “Conducting in situ
evaluations for and with ubiquitous technologies,” Interna-
tional Journal of Human-Computer Interaction, vol. 22, no. 1-2,
pp. 103–118, 2007.
[21] T. Deryckere, W. Joseph, L. Martens, et al., “A software tool
to relate technical performance to user experience in a mobile
context,” in Proceedings of the 3rd IEEE Workshop on Advanced
EXPerimental Activities on WIRELESS Networks and Systems
(EXPONWIRELESS ’08) in Conjunction with WOMWOM,pp.
1–6, 2008.
[22]K.DeMoor,L.DeMarez,T.Deryckere,etal.,“Bridging
troubled water: quality of experience in a mobile media
context,” in Proceedings of the TERENA Networking Conference,
2008.
[23]K.Rogers,K.Conelly,L.Tedesco,etal.,“Whyit’sworth
the hassle: the value of in-situ studiees when designing
ubicomp,” in Proceedings of the 9th International Conference
on Ubiquitous Computing (UbiComp ’07),LectureNotesin
Computer Science, pp. 336–353, Springer, Innsbruck, Austria,
September 2007.
[24] O. Bradeanu, D. Munteanu, I. Rincu, et al., “Mobile multime-
dia end-user quality of experience modeling,” in Proceedings
of the International Conference on Digital Telecommunications,
2006.
[25] J. De Bruyne, W. Joseph, L. Verloock, et al., “Evaluation of link
performance of an indoor 802.11g network,” in Proceedings
of the 5th IEEE Consumer Communications and Networking
Conference, pp. 425–429, 2008.
[26] OpenNetCF, February 2008, />[27] V. Roto, Web browsing on mobile phones—character istics of
user experience, doctoral dissertation, Helsinki University of
Technology, 2006.
[28] M. H. Kutner, C. J. Nachtsheim, J. Neter, et al., Applied Linear
Statistical Models, McGraw-Hill, New York, NY, USA, 5th
edition, 2005.
[29] T. Hoßfeld, D. Hock, P. Tran-Gia, et al., “Testing the IQX
hypothesis for exponential interdependency between QoS and
QoE of voice codecs iLBC and G.711,” in Proceedings of the
18th ITC Specialist Seminar on Qualit y of Experience, pp. 105–
114, 2008.
[30] ITU-T, “G.1030: estimating end-to-end performance in IP
networks for data applications,” />itu-t/aap/sg12aap/history/g1030/g1030.html.
[31] L. Breiman, R. A. Friedman, R. A. Olshen, et al., Classification
and Regression Trees, Wadsworth, Pacific Grove, Calif, USA,
1984.