Báo cáo hóa học: " Research Article Automatic Detection and Recognition of Tonal Bird Sounds in Noisy Environments" pot
Bạn đang xem bản rút gọn của tài liệu. Xem và tải ngay bản đầy đủ của tài liệu tại đây (1.28 MB, 10 trang )
Hindawi Publishing Corporation
EURASIP Journal on Advances in Signal Processing
Volume 2011, Article ID 982936, 10 pages
doi:10.1155/2011/982936
Research Article
Automatic Detection and Recognition of Tonal Bird S ounds in
Noisy Environments
Peter Jan
ˇ
covi
ˇ
c (EURASIP Member) and M
¨
unevver K
¨
ok
¨
uer
School of Electronic, Electrical & Computer Engineering, University of Birmingham, Birmingham, B15 2TT, UK
Correspondence should be addressed to Peter Jan
ˇ
covi
ˇ
c,
Received 13 September 2010; Revised 24 December 2010; Accepted 7 February 2011
Academic Editor: Tan Lee
Copyright © 2011 P. Jan
ˇ
covi
ˇ
c and M. K
¨
ok
¨
uer. This is an open access article dist ributed under the Creative Commons Attribution
License, which permits unrestricted use, distribution, and reproduction in any medium, provided the original work is properly
cited.
This paper presents a study of automatic detection and recognition of tonal bird sounds in noisy environments. The detection
of spectro-temporal regions containing bird tonal vocalisations is based on exploiting the spectral shape to identify sinusoidal
components in the shor t-time spectrum. The detection method provides tonal-based feature representation that is employed for
automatic bird recognition. The recognition system uses Gaussian mixture models to model 165 different bird syllables, produced
by 95 bird species. Standard models, as well as models compensating for the effect of the noise, are employed. Experiments are
performed on bird sound recordings corrupted by White noise and real-world environmental noise. The proposed detection
method shows high detection accuracy of bird tonal components. The employed tonal-based features show significant recognition
accuracy improvements over the Mel-frequency cepstral coefficients, in both standard and noise-compensated models, and strong
robustness to mismatch between the training and testing conditions.
1. Introduction
Identification of birds, the study of their behavior, and
the way of their communication is important for a better
understanding of the environment we are living in and in
the context of environmental protection. Bird species iden-
tification currently relies crucially on expert ornithologists
who identify birds by sight and, more often, by their songs
and calls. In recent years, there has been an increased interest
in automatic recognition of bird species using the acoustic
signal.
Bird vocalisation is usually considered to be composed of
calls and songs, which consist of a single syllable or a series of
syllables. Sounds produced by birds may be of a various char-
acter. Some birds produce sounds of a noisy broadband char-
acter, but most produce a tonal sound, which may consist of
a pure tone frequency, several harmonics of the fundamental
frequency, or several non-harmonically related frequencies
[1]. The bird sounds are often modulated in both frequency
and amplitude. Field recordings of bird vocalisations in their
natural habitat are usually contaminated by various noise
backgrounds or vocalisations of other birds or animals.
Automatic recognition of bird species based on their
sounds is a pattern recognition problem, and as such, it
consists of a feature extraction stage that aims to extract
relevant features from the signal and a modelling stage that
aims to model the distribution of the features in space.
Early attempts at automatic bird recognition were based on
template matching of signal sp ectrograms using dynamic
time warping (DTW), for example, see [2]. The study
in [2] was performed on two birds and involved manual
segmentation of the templates of representative syllables. The
authors in [3] compared the use of DTW and hidden Markov
models (HMMs) on recognition of bird song elements
from continuous recordings of two bird species. Artificial
neural networks (NNs) have also been applied to the
recognition of bird sounds; for example, see [4–6]. The back-
propagation neural network was used in [4], a combined
time delay NNs with an autoregressive version of the back-
propagation in [5], and a recurrent neural fuzzy network
in [6]. Recently, Gaussian mixture models (GMMs) have
also been used for recognition of bird sounds; for example,
see [7, 8]. These studies also compared the recognition
performance obtained by employing the GMMs and HMMs
2 EURASIP Journal on Advances in Signal Processing
and reported only small differences in performance. The use
of support vector machines was presented in [9] and neural
network classifiers employing wavelets in [10], however,
neither works presented any comparison to GMMs or
HMMs.
Various feature representations of bird sounds for auto-
matic bird recognition have been explored. Many of the
studies were inspired by feature representations used in
the automatic speech recognition field. Filter-bank energies
were used in [3], linear prediction cepstral coefficients in
[4, 5], and Mel-frequency cepstral coefficients (MFCC) in
[3, 7–9, 11]. Features relating to a dominant energy region
in the spectrum were used in [12]. The authors in [8]
compared three different representations: MFCC features,
features based on sinusoidal modelling presented in [13]
which estimates sinusoidal components present in the signal,
and a set of low-level descriptive features. They reported that
MFCC features obtained the best performance. In [9], the
combination of MFCC features with a set of low-level signal
parameters was shown to slightly improve the recognition
performance.
The above-mentioned bird recognition studies per-
formed the recognition using a relatively small number of
bird species (between two to sixteen), and nearly all studies
were performed on clean data. In [14], it was mentioned
that part of the data, which was also used in [8, 9], was
obtained from field recordings containing some background
noise. However, there was no formal evaluation of the noise
level and dealing with the background noise was not the
concern of their work. The aim of our study in this paper
is to investigate automatic detection and recognition of
bird sounds in noisy environments. We focus on tonal bird
sounds as many of the bird sounds are of a tonal character.
The detection of spectro-temporal regions of tonal bird
sounds is performed by a method exploiting the spectral
shape to identify sinusoidal components in the short-time
spectrum. We have introduced this method earlier for
voicing charac ter estimation of speech signals [15]and
employed it for automatic speech and speaker recognition
[16, 17] and speech alignment [18]. Here, we will explore
the employment of this method for bird acoustic signals.
The experimental evaluations are performed on bird data
from [19], which is corrupted by White noise and real-world
waterfall noise [20 ] at various signal-to-noise ratios (SNRs).
The proposed detection method when used at a frame-level
shows that over 95% of the bird signal frames can be detected
as tonal while keeping the false detection on White noise
at only 1%. Motivated by the detect ion method, we then
study the feature representation for automatic recognition
of bird syllables in noisy conditions. The recognition task
consists of 165 different bird syllables produced by 95 bird
species. The modelling of the bird sounds is performed
by employing Gaussian mixture models. The performance
achieved by using the tonal-based feature representation
obtained by the proposed detection method is compared
with MFCC features. The experimental evaluations are
performed using a standard model that is trained on clean
data and also using a model that compensates for the
effect of the noise. The multi-condition training approach
is used for the latter. Experimental results show that both
the MFCC features and the tonal-based features can obtain
a very high recognition performance in clean conditions.
In noisy conditions, the tonal-based features achieve a
significantly better performance than the MFCC features in
both the standard model and the noise-compensated model.
Moreover, the tonal-based features show strong robustness
to a mismatch between the training and testing conditions,
while the per formance of the MFCC features deteriorates
significantly even at high SNRs.
The rest of this paper is organised as follows: Section 2
presents the proposed method for the detect ion of tonal
spectro-temporal regions and its evaluation at a fr ame
and spectral-level; Section 3 presents the employment of
the tonal-based features for bird recognition employing
the Gaussian mixture modelling with experimental evalua-
tions on standard and noise-compensated models; Section 4
presents the discussion and conclusions.
2. Detection of Bird Sounds in Noise
This section presents a method for the detection of tonal
regions of bird sounds at the spectral-level and frame-
level. The method is based on the detection of sinu-
soidal components in the spectrum based on the spec tral
shape.
2.1. Princ iple. As a result of short-time processing, the
short-time Fourier spec trum of a sinusoidal signal is the
Fourier transform of the frame-window function. Thus, the
detection of bird spectra l components of a tonal character
can be performed based on comparing the short-time
magnitude spectrum of the signal to the spectrum of the
frame-window function [15].
2.2. Method Description. The steps of the method used for
the detection of the bird tonal components in the spectrum
areasfollows.
(1) Short-Time Magnitude Spectrum Calculation. Aframe
of a time-domain signal is multiplied by a frame-window
function. The Hamming window was employed as a window
function due to its good tradeoff between the main-lobe
width and side-lobe magnitudes. It was experimentally
demonstrated in [15] that the Hamming window provided
better detection performance than the rectangular and
Blackman-Harris windows (as examples of a narrower and
wider main-lobe width, resp.) on simulated sinusoidal sig-
nals. In order to obtain a smoother short-time spectrum, the
windowed signal frame was appended with zeros, resulting
in a signal frame of twice as long as the original signal frame,
and the FFT was then applied to provide the short-time
magnitude spectrum.
(2) Sine-Distance Calculation. For a frequency point k of
the short-time magnitude spectrum, a distance, referred to
as sine-distance and denoted by sd(k), between the signal
EURASIP Journal on Advances in Signal Processing 3
spectrum around the point and magnitude spectrum of the
frame-window function is computed as
sd
(
k
)
=
⎡
⎣
1
2M +1
M
m=−M
|
S
(
k + m
)
|
|S
(
k
)
|
−
|
W
(
m
)
|
|W
(
0
)
|
2
⎤
⎦
1/2
,
(1)
where M determines the number of points of the spectrum
at each side around the point k to be compared, and this
was set to 3. In (1), the magnitude spectrum of the signal,
S(k), and frame window, W(k), are normalised as to have
the value equal to 1 when m
= 0. This ensures that the
magnitude difference is eliminated and only the shape is
being compared. The value of the sine-distance in (1)will
be low, ideally equal to zero, when the frequency point
k corresponds to a sinusoidal component in the signal;
otherwise, it will be high. The sine-distance sd(k)canbe
calculated for each frequency point in the spect rum or for
spectral peaks only. In the latter case, the peaks can be
identified by detecting changes of the slope of S(k)from
positive to negative.
(3) Postprocessing of the Sine-Distances. The sine-distance
obtained from (1) may accidentally be of a low value for
a non-tonal region or vice versa. This can be improved
by filtering the obtained sine-distances. We employed a 2D
median filter of size 15
× 3, where the first and second
dimension sizes correspond to the number of frames and
spectral points, respectively.
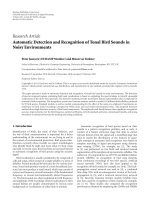
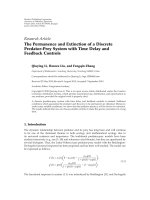
An example of a waveform and spectrogram of a clean
tonal bird sound and corrupted by White noise at the global
SNR of
−10 dB and the corresponding sine-distance values
are depicted in Figure 1. The frame length and frame shift
used here were 64 and 32 samples, respectively. We can see
from the spectrogram that the singing frequency of the bird
often changed quickly. For instance, in the first segment
(within the first 100 ms), the frequency changed from
8950 Hz to 5850 Hz during approximately 20 ms. Despite
these fast frequency variations, the sine-distance shows good
detection, that is, low values well tracking the bird singing
frequency. For the noise-corrupted bird sound, we can see
that while the signal is strongly corrupted by noise, the sine-
distance values show a clear detection of the correct bird
tonal regions.
2.3. Experimental Evaluation of Tonal Bird Detection
2.3.1. Database Descript ion. The experimental evaluations
presented throughout this paper were performed using
bird data from commercially available bird recordings in
[19], which contains the songs and calls of birds living in
eastern and central North America on three CDs. The entire
collection of bird recordings from the third CD was used.
It contains recordings of 99 different types of birds with
various character of sounds, ranging from tonal sounds that
contain a single frequency, several harmonics, or several non-
harmonically related frequencies to some non-tonal sounds
and from relatively stationary to highly transient. The signals
are recorded at a 44100 Hz sampling frequency with 16
bits for each sample. The noisy bird data was created by
artificially adding noise to the original data at global SNRs
of 10 dB, 0 dB and
−10 dB, respectively. As noise source,
White noise is used in the experimental evaluations in this
section.
2.3.2. Experimental Results. First, we present experimental
evaluations of the detection of tonal bird signal frames in
clean and noisy conditions. To account for the fact that bird
sounds may consist of a single frequency component, a signal
frame is considered as tonal if at least one spectral point
was detected as tonal. Since the bird database contains bird
sounds of various character, and there is no label information
indicating which part of the signal is of a tonal character,
we adopted the following evaluation methodology. The ideal
detector would be expected to detect all the tonal frames
in the bird data and at the same time not to detect any
frames on White noise as this noise does not contain any
pure tonal components. Thus, the evaluation of the detection
performance is presented in terms of the percentage of
frames detected as tonal on bird data (clean and noisy) versus
the percentage of frames detected as tonal on White noise and
the latter is referred to as false-acceptance error. Since birds
often vary the singing frequency over a short time period, it
is important to assess the effect of the frame length on the
detection performance. A shorter length of the frame may
provide less variations of the signal within the frame, how-
ever, it also reduces the frequency resolution of the spectrum.
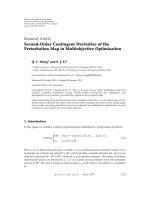
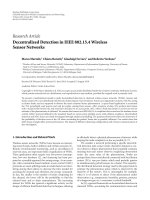
The experimental results of the detection on clean and
noisy data at various global SNRs when using various frame
lengths are presented in Figure 2. Note that the individual
results presented in the figures correspond to a specific value
of the tonal-threshold used, and as the value of the tonal-
threshold increases, the false-acceptance increases.
Let us first analyse the results on clean data. We can see
that at a given false-acceptance error, the frame length of
32 samples provides the highest percentage of bird frames
detected as tonal on the clean data. For instance, at a 2%
false-acceptance error around 96% of all the signal frames are
detected as tonal when the frame length is 32 samples, while
the detection drops to around 92% and 73% for the frame
length of 64 samples and 128 samples, respectively. The high
percentage of frames detected as tonal (especially when using
a short frame length, such as 32 samples) might seem slightly
surprising, since the database contains sounds of a variety
of birds (it was not specifically designed to contain tonal
bird sounds only). This is contributed to by the fact that the
use of such short frame length provides so coarse frequency
resolution that even a non-tonal but frequency-localised
signal would appear as tonal in the spectrum and thus
would b e detected. H owever , a coarse f requency resolution
causes that a wider frequency region of noise can negatively
affects the detection in noisy data. Let us now examine the
performance on noisy data. We can see that the frame length
of 128 samples provides the lowest detection performance
in all noisy conditions. Comparing the results for the frame
length of 32 and 64 samples as the SNR decreases, we can see
that the frame length of 32 samples provides better detection
4 EURASIP Journal on Advances in Signal Processing
Sample index
Amplitude
0 0.5 1 1.5 2 2.5 3
×10
4
−0.1
−0.08
−0.06
−0.04
−0.02
0
0.02
0.04
0.06
0.08
0.1
Sample index
Amplitude
0 0.5 1 1.5 2 2.5 3
×10
4
−0.2
−0.15
−0.1
−0.05
0
0.05
0.1
0.15
0.2
(a)
Time (ms)
Frequency (Hz)
100 200 300 400 500 600 700
3445
6890
10336
13781
17226
20672
−60
−50
−40
−30
−20
−10
0
Time (ms)
Frequency (Hz)
100 200 300 400 500 600 700
3445
6890
10336
13781
17226
20672
−60
−50
−40
−30
−20
−10
0
(b)
Time (ms)
Frequency (Hz)
100 200 300 400 500 600 700
3445
6890
10336
13781
17226
20672
0.15
0.2
0.25
0.3
0.35
0.4
0.45
0.5
Time (ms)
Frequency (Hz)
100
200 300 400 500 600
700
3445
6890
10336
13781
17226
20672
0.1
0.15
0.2
0.25
0.3
0.35
0.4
0.45
0.5
(c)
Figure 1: Waveform (a), spectrogram (b), and the corresponding sine-distance values (c) of a tonal bird song which is clean (left) and
corrupted by White noise at the global SNR of
−10 dB (right).
performance at higher SNRs, while the frame length of 64
samples obtains better performance at lower SNRs. Since
our main interest is the detection and recognition in noisy
conditions and since the 32 samples frame length provides
a very coarse frequency resolution, the frame length of 64
samples is used for the remaining experiments presented in
this paper.
Let us now discuss the choice of tonal-threshold. The
results presented in Figure 2 show that by increasing the
value of the tonal-threshold, the amount of detected bird
signal frames increases, but so does the false-acceptance
error exponentially. For instance, in the case of global SNR
of
−10 dB, the increase of the bird signal frames detection
from 36.5% to 54.7%, which is around 1.5 times, would
EURASIP Journal on Advances in Signal Processing 5
1
23
51020
30
50
65
70
75
80
85
90
95
100
False acceptance (%)
Bird frames detected as tonal (%)
Clean
(a)
1 2 3 5 10 20
30
50
55
60
65
70
75
80
85
90
95
100
False acceptance (%)
Bird frames detected as tonal (%)
Global SNR = 10 dB
(b)
1
2
35 10 20
30
50
45
50
55
60
65
70
75
80
85
90
False acceptance (%)
Bird frames detected as tonal (%)
Global SNR = 0dB
Frame length of 32 samples
Frame length of 64 samples
Frame length of 128 samples
(c)
1
2
35 10
20
30
50
False acceptance (%)
20
30
40
50
60
70
80
Birdframesdetectedastonal(%)
Global SNR =−10 dB
Frame length of 32 samples
Frame length of 64 samples
Frame length of 128 samples
(d)
Figure 2: Percentage of frames detected as tonal on bird data (y-axis) versus on White noise (x-axis; referred to as false-acceptance). Bird
data: clean (a) and corrupted by White noise at various global SNRs (b)–(d). Frame length [samples]: 32 (circle dashed line), 64 (square full
line), and 128 (triangle dash-dotted line).
cause the false-acceptance error to increase 13 times from
1.4% to 18.2%. Including large amount of falsely detected
frames in recognition may have a more negative effect on
the recognition performance than the reduced number of
bird frames detected as tonal. We decided to choose a tonal-
threshold which would result in a small false-acceptance
error. Thus, the tonal-threshold was set to 0.24, giving a 1.4%
frame false-acceptance error.
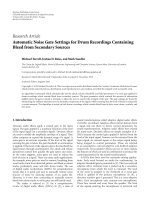
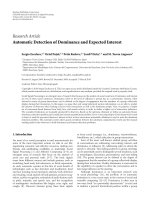
Next, we will analyse the detection performance in terms
of how many bird species are detected as having tonal singing
in the database. This is performed for the frame length set to
64 samples and the tonal-threshold set to 0.24, which gave
1.4% false-acceptance error at the frame-level. The results
presented in Figure 3 depict the number of birds (y-axis)
having the given percentage of detected bird signal frames
as tonal (x-axis). The results show that 96 out of 99 birds
had over 73% of the signal frames detected as tonal and no
bird had less than 45% of the frames detected as tonal. This
demonstrates that the proposed detection method may be
applicable for detection of a large number of bird species.
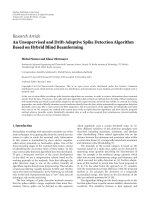
Finally, we performed an evaluation of the detection
of bird tonal regions at the spectral-level as a function
of the local SNR. The local SNR for a given frequency
point was calculated as the ratio of the energy of the clean
signal and energy of the noise, each energy obtained as the
average over energies at three frequency points around the
6 EURASIP Journal on Advances in Signal Processing
40 50 60 70 80 90 100
0
5
10
15
20
25
30
35
Bird frames detected as tonal (%)
Number of birds
Figure 3: Histogram of the number of birds having the given
percentage of bird signal frames detected as tonal on clean data.
−10
−5
0 5 10 15 20 25 30
0
10
20
30
40
50
60
70
80
90
100
Local SNR (dB)
False rejection (%)
Figure 4: False-rejection error r ate of bird tonal spectral points
detection in White noise conditions as a function of the local SNR
when the false-acceptance error was kept at 0.046%.
considered frequency point. The signal frames detected as
tonal on clean bird data were collected across all the noisy
bird data corrupted at various global SNRs and used for
this e valuation. The tonal-threshold was set to 0.24, which
resulted in 0.046% false-acceptance er ror at the spectral-
level, that is, the percentage of spectral points which were
not detected as tonal on clean data but were detected as tonal
on noisy data. The experimental results in terms of the false-
rejection error as a function of the local SNR are depicted
in Figure 4. The false-rejection error refers to the percentage
of spectral points which were detected as tonal on clean bird
data but not detected on the noisy bird data at a given local
SNR. We can see that even at the local SNR of 0 dB, which
corresponds to the energy of the signal and noise being equal,
the false rejection is around 72%, that is, approximately 28%
of the bird tonal spectral points are still correctly detected.
3. Automatic Bird Recognition
This section presents our research on the employment of the
spectral-level detection information provided by the method
described in Section 2 for the recognition of bird syllables
in noisy environments. The recognition system consists
of two main parts: feature representation and modelling
of the features. The following subsections describe first
the probabilistic modelling of bird features and then the
bird signal feature representations we employed. These are
followed by experimental evaluations.
3.1. Probabilistic Modelling. The bird recognition system we
employed is based on modelling the distribution of acoustic
feature vectors for each bird syllable using the Gaussian
mixture model (GMM). We employed GMMs as they were
shown to achieve the best bird recognition performance in
recent study in [8].
An L-component GMM λ is a linear combination of L
Gaussian probability density functions a nd has the form
p
y | λ
=
L
l=1
w
l
b
l
y
,
(2)
where y denotes the feature vector, w
l
is the weig ht and b
l
(y)
is the density of the lth mixture component. The mixture
weights satisfy the constraint
L
l
=1
w
l
= 1. Each b
l
(y)isa
multivariate Gaussian densit y of the form
b
l
y
=
1
(
2π
)
D/2
|Σ
l
|
1/2
exp
−
1
2
x − μ
l
Σ
−1
l
x − μ
l
,
(3)
with the mean vector μ
l
and covariance matrix Σ
l
. Gaussian
densities with diagonal covariance matrix were used in this
paper. Each bird syllable s is represented by a GMM denoted
by λ
s
which consists of the mixture weights and the mean
vectors and covariance matrices of the Gaussian mixture
components, that is, λ
s
={w
l
, μ
l
, Σ
l
}
L
l
=1
.
In recognition, we are given a sequence of feature vectors
Y
={y
1
, , y
T
},whereT is the number of frames. The
objective of the recognition is to find the bird model λ
s
which
gives the maximum a-posteriori probability for the given
observation sequence Y, that is,
s
∗
= arg max
s
P
(
λ
s
| Y
)
∝ arg max
s
P
(
λ
s
)
p
(
Y
| λ
s
)
,
(4)
where s
∗
denotes the index of the bird syllable model achiev-
ing the maximum a-posteriori probability and P(λ
s
) is the
a-priori probability of the bird syllable s, which we consider
here to be equal for all bird syllables. Assuming independence
between the observations and using the logarithm, the bird
syllable recognition can then be written as
s
∗
= arg max
s
T
t=1
log p
y
t
| λ
s
,
(5)
where the p(y
t
| λ
s
) is calculated using (2)and(3).
EURASIP Journal on Advances in Signal Processing 7
3.2. Feature Representation. The purpose of feature repre-
sentation is to convert the signal into a sequence of feature
vectors Y that represent the information of interest in the
signal. Our aim is to investigate an employment of tonal-
based features which are obtained using the spectral-level
detection method presented in Section 2. Since the previous
research in automatic bird recognition has shown that
the Mel-frequency cepstral coefficients (MFCC), which are
currently the most widely used features for speech/speaker
recognition, achieved the best performance for bird recog-
nition, for example, [8], we used the MFCC features for
comparison. The following subsections describe both types
of feature representations. Both feature representations were
obtained by dividing the signal into frames of 64 samples,
with an overlap of 32 samples between frames a nd Hamming
window was applied to each frame.
3.2.1. Mel-Frequency Cepstral Coefficients. The MFCC fea-
tures were obtained as follows. The short-time magnitude
spectrum, obtained by applying the FFT on each windowed
signal frame, was passed to Mel-spaced filter-bank analysis.
The obtained logarithm filter-bank energies were trans-
formed using the discrete cosine transform, and the lower
coefficients formed the static MFCC feature vector. In order
to include dynamic spectral information, the first-order delta
features, calculated as in [21] using two frames before and
after the current frame, were added to the static MFCC
feature vector.
In order to find the best parameter setup for the MFCC
features, we performed experiments on clean data with the
number of filter-bank (FB) channels set to a value from 10 to
50 and for each case the number of the cepstral coefficients
set to 8, 12, and 20. Little differences in recognition accuracy
were observed—the MFCC features used in all of the
following experiments were obtained using 30 FB channels
and taking the first 20 cepstral coefficients. The addition of
the delta features resulted in 40 dimensional MFCC feature
vector for each signal frame.
3.2.2. Tonal-Based Features. The tonal-based features were
obtained based on the tonal spectral detection method
presented in Section 2. The static tonal-based feature vector
for a given frame comprised of the frequency value and the
logarithm of the magnitude value of the most prominent
tonal component detected over the entire frequency range,
that is, in a case a bird sound consisted of several frequency
components (e.g., harmonics), only the information about
the largest magnitude frequency component was used. The
delta features capturing the dynamic information, calculated
as mentioned in the previous section, were added to the static
features, resulting in a 4 dimensional tonal-based feature
vector (as opposed to the 40 dimensional in the case of
MFCC).
3.3. Experimental Evaluation of Bird Syllable Recognition
3.3.1. Data Desc ription and Experimental Se tup. The
database used for experiments was described earlier in
Section 2.3.1. The entire data, containing songs and calls
of 99 birds, were manually split into individual syllable
groups, each group consisting of a set of syl lables with a
similar spectral content, giving 281 different bird syllable
groups. The data of each bird syllable was split (as detailed
below) into a separate training set and testing set, which
were then used for estimating the parameters of the GMMs
and the experimental evaluations, respectively. Experiments
were performed by employing both the standard models
and noise-compensated models. The standard models were
trained using the clean training data. The noise-compensated
models were obtained by using multi-condition training
approach, that is, the models were trained using a set of noisy
training data. T he training and testing data were obtained
as follows. For each bird syllable, the detection of bird tonal
frames was performed as described in Section 2 on clean
data, and two thirds of the detected frames were allocated
as the clean training data set. For each noisy conditions, the
noisy training data set then consisted of the signal frames
detected as tonal on the noise-corrupted versions of the
training data. The clean and noisy testing sets consisted
then of all the detected signal frames which did not belong
to the training data. Note that the testing data included
also the signal frames which were detected as tonal due to
false-acceptance. In order to have a reasonable amount of the
training data to train the models, only those bird syllables
which had at least 250 frames detected as tonal on clean
and noisy training data sets were used for the recognition
experiments—this resulted in 165 out of 281 different bird
syllables w hich were used for recognition experiments in this
section. The experiments were performed with noisy bird
data created by adding noise to the original data at global
SNRs from
−10 dB to 10 dB, in 5 dB steps, respectively. In
addition to using White noise, we also used a real-world
Waterfall noise recorded in a forest environment with a
waterfall [20].
3.3.2. Experimental Results on the Standard Models. First,
the evaluation of the proposed tonal-based features against
the MFCC features was performed using standard models
trained on clean data.
Recognition results obtained by the standard models
using the MFCC and tonal-based features in clean conditions
as a function of varying the number of mixture components
in the model are presented in Table 1. It can be seen that
using 16 and 32 mixture components provides the best
performance for both types of features.
Next, experimental results obtained by the standard
models using 32 mixture components for White and Water-
fall noisy data are presented in Table 2.Itcanbeseen
that the MFCC features provide extremely low recognition
performance even in mild noisy conditions at the SNR of
10 dB. The failure of the MFCC features is due to capturing
information from the entire spectrum, which may be largely
dominated by noise since the bird sounds are often localised
only in nar row frequency regions. On the other hand, the
tonal-based features still provide very good performance
even in strong noisy conditions at the SNR of
−10 dB.
8 EURASIP Journal on Advances in Signal Processing
Table 1: Bird syllable recognition accuracy on clean data obtained by the standard model having various number of mixture components
and employing the MFCC and tonal-based features.
Features Number of mixture components
2 4 8 16 32 64 128
MFCC 93.9 96.9 98.7 99.3 99.3 97.5 94.5
Tonal 60.6 75.1 88.4 95.7 95.7 92.1 87.8
Table 2: Bird syllable recognition accuracy on noisy data obtained by the standard model employing the MFCC and tonal-based features.
Features Noisy conditions at a given SNR [dB]
White noise Waterfall noise
−10 −50 510 −10 −50 510
MFCC 0.6 0.6 1.2 3.0 9.7 0.6 0.6 1.2 2.4 9.0
Tonal 50.3 61.8 72.7 83.6 86.0 56.9 67.2 78.1 83.6 87.8
3.3.3. Exper imental Results on the Noise-Compensated Models.
In this section, we present the experimental results obtained
by using noise-compensated models. These models were
obtained by using the multi-condition training approach,
which is often used in automatic speech recognition, for
example, [16, 22].
First, results are presented for multi-condition models
which were trained using the training data corrupted (at
various SNR levels) by the same noise as used during the
testing. This corresponds to real-world situations when the
noise characteristics could be known a-priori or accurately
estimated, for instance, when the noise is stationary as in
the presence of a waterfall in the environment. Experimental
evaluations showed in all cases that using 64 mixture compo-
nents provided better p erformance than using 32 mixtures
(used in the standard model). This reflects the increased
variety of the training data. The obtained recognition results
are presented in Table 3. It can be seen that the performance
obtained by both the MFCC and tonal-based features
when using the noise-compensated models is improved
significantly in comparison to the results obtained by the
standard model as in Table 2 . Using the noise-compensated
models, the tonal-based features provide significantly better
performance than the MFCC features in most of the noisy
conditions.
In a typical real-world scenario, environmental condi-
tions vary, and it may not be possible to estimate noise
characteristics reliably. In order to reflect this, we performed
experiments where the training is based on an available noise,
such as White noise, but the recognition is performed on
a type of noise that w as not seen during the training stage
(in our case Waterfall noise). The results are presented in
Figure 5. It can be seen that the recognition performance
when using the MFCC features drops significantly in com-
parison to the previous case of matched training and testing
noise conditions. As such, the MFCC features are not robust
to the mismatch between training and testing noisy condi-
tions. The proposed tonal-based features obtained recogni-
tion accuracy that is very close to the accuracy obtained when
using the matched training and testing noisy conditions.
4. Discussion and Conclusions
Since bird sounds are often concentrated in a narrow
frequency area, and in real-world conditions, there are
often several birds singing simultaneously, the decomposi-
tion of the entire acoustic scene into individual sinusoidal
components and their recombination at the classification
stage seems a natural approach to take for detection and
recognition of tonal bird sounds. In this paper, we presented
a study of the detection and recognition of tonal bird sounds
in noisy environments which follows this line of thought. We
introduced a method for the detection of spectro-temporal
regions of tonal birds sounds and then employed this for bird
sound representation in a bird syllable recognition system.
Experimental evaluations were performed on bird data from
[19], which were corrupted by White noise and real-world
Waterfall noise at various signal-to-noise ratios (SNRs).
The method we employed for bird sound detection
exploits the principle of detecting sinusoidal components
in the short-time spec trum based on spectral shape. It was
shown that very short frame lengths, specifically 32 samples
and 64 samples which correspond to 0.725 ms and 1.45 ms,
respectively, provided the best detection performance. This
reflects the presence of fast frequency variations in bird
sounds. The use of such short frame lengths is in contrast to
previous works on automatic bird recognition, which often
used the frame length from 5.8 to 11.6 ms, for example,
[6, 8]. The use of such longer frame lengths would provide
better frequency resolution, but, due to the fast frequency
variations in bird sounds, it would also lead to some
smearing in the spectrum. This has not been a problem
for previous studies since they were not concerned with the
detection of sinusoidal components, but only with a frame-
level feature extraction.
The proposed detection method, when used at the frame-
level, showed that over 95% of the clean bird signal frames
in the bird database we used can be detected as tonal
with false-acceptance of only 1%. As such, this method
can be used to provide an accurate automatic segmentation
of a recorded signal into individual syllables. In previous
EURASIP Journal on Advances in Signal Processing 9
Table 3: Bird syllable recognition accuracy on noisy data obtained by the multi-condition model employing the MFCC and tonal-based
features.
Features Noisy conditions at a given SNR [dB]
White noise Waterfall noise
−10 −50 510 −10 −50 510
MFCC 54.5 75.7 86.6 92.7 95.1 50.3 79.3 84.8 93.9 97.5
Tonal 70.9 84.2 91.5 92.7 95.7 69.7 85.4 94.5 96.3 95.1
−10 −5
0510
0
10
20
30
40
50
60
70
80
90
100
SNR (dB)
Recognition accuracy (%)
MFCC (train-test mismatch)
MFCC (train-test match)
(a)
−10 −5
05
10
0
10
20
30
40
50
60
70
80
90
100
SNR (dB)
Recognition accuracy (%)
Tonal (train-test mismatch)
Tonal (train-test match)
(b)
Figure 5: Bird syllable recognition accuracy on data corrupted
by Waterfall noise obtained by the multi-condition model trained
on Waterfall noise (train-test match) and White noise (train-test
mismatch) and employing the MFCC (a) and the tonal-based (b)
features.
studies, for example, [8, 9], the syllable segmentation was
performed based on a threshold defined by an estimate of
the background noise energy level. This may be difficult to
estimate accurately in non-stationary noisy environments
with sudden noise and vary ing levels of noise.
The choice of the detection threshold, termed as tonal-
threshold, determines the tradeoff between the correct detec-
tion rate and false-acceptance error rate. We set the tonal-
threshold so as to achieve a very low false-acceptance error,
since falsely detected regions may be seriously detrimental
to the recognition accuracy. It was demonstrated that the
proposed method provides very high accuracy in detecting
the bird tonal spectral components in noisy environments.
For instance, at 10 dB local SNR, the correct detection of bird
tonal spectral components was around 83% while the false-
acceptance was kept at only 0.046%.
In the second part of the paper, we explored the repre-
sentation of bird signals formed based on the output of the
proposed tonal detection method. Specifically, the frequency
and amplitude of the detected sinusoidal components were
used, and these were referred to as tonal-based features.
The work in [8] employed similar features, however, they
were obtained based on the sinusoidal modelling algorithm
presented in [13] and actually corresponded to the highest
peak in the spectrum. The authors reported that the recog-
nition performance obtained by these features was inferior
to the conventional MFCC features. Moreover, the use of the
highest peak in the spectrum would not be robust to noise,
since a peak corresponding to any strong noise present in
adifferent frequency region would be found instead of the
peak corresponding to bird sound. The tonal-based features
we employed in the study here showed very high recognition
performance even in very strong noisy conditions. It was
also shown that the performance c an be further improved
by using models trained on noise-corrupted training data,
since such models can accommodate the effect of noise. The
use of the same noise conditions for training the models, and
testing is generally impossible in real-world scenario. When
there was a mismatch between the training and testing noisy
conditions, the currently most widely used MFCC features
achieved very low recognition accuracy, while the proposed
tonal-based features showed nearly the same performance as
in the case of matched training-testing conditions.
In real-world scenario, there are usually several birds
singing simultaneously. The proposed detection method can
be directly employed for this scenario, since it provides the
information on individual detected sinusoidal components
for each signal frame. The recognition of birds singing
10 EURASIP Journal on Advances in Signal Processing
simultaneously could then be performed by employing a
multiple-hypothesis recognition approach. This is part of
our future research work.
Acknowledgment
This work was partly supported by UK EPSRC Grant EP/
F036132/1.
References
[1] N. H. Fletcher, “A class of chaotic bird calls?” Journal of the
Acoustical Society of America, vol. 108, no. 2, pp. 821–826,
2000.
[2] S. E. Anderson, A. S. Dave, and D. Margoliash, “Template-
based automatic recognition of birdsong syllables from
continuous recordings,” Journal of the Acoustical Society of
America, vol. 100, pp. 1209–1219, 1996.
[3] J. A. Kogan and D. Margoliash, “Automated recognition of bird
song elements from continuous recordings using dynamic
time warping and hidden Markov models: a comparative
study,” JournaloftheAcousticalSocietyofAmerica, vol. 103,
no. 4, pp. 2185–2196, 1998.
[4] A. L. Mcllraith and H. C. Card, “Birdsong recognition using
backpropagation and multivariate statistics,” IEEE Transac-
tions on Signal Processing, vol. 45, no. 11, pp. 2740–2748, 1997.
[5] S. A. Selouani, M. Kardouchi, E. Hervet, and D. Roy, “Auto-
matic birdsong recognition based on autoregressive time-
delay neural networks,” in Proceedings of the Congress on Com-
putational Intelligence Methods and Applications (ICSC ’05),
pp. 1–6, Istanbul, Turkey, December 2005.
[6] C. F. Juang and T. M. Chen, “Birdsong recognition using pre-
diction-based recurrent neural fuzzy networks,” Neurocom-
puting, vol. 71, no. 1-3, pp. 121–130, 2007.
[7] C. Kwan, K. C. Ho, G. Mei et al., “An automated acoustic
system to monitor and classify birds,” EURASIP Journal on
Applied Signal Processing, vol. 2006, Article ID 96706, 19 pages,
2006.
[8] P. Somervuo, A. H
¨
arm
¨
a, and S. Fagerlund, “Parametric repre-
sentations of bird sounds for automatic species recognition,”
IEEE Transactions on Audio, Speech and Language Processing,
vol. 14, no. 6, pp. 2252–2263, 2006.
[9] S. Fagerlund, “Bird species recognition using support vector
machines,” EURASIP Journal on Advances in Signal Processing,
vol. 2007, Article ID 38637, 8 pages, 2007.
[10] A. Selin, J. Turunen, and J. T. Tanttu, “Wavelets in recognition
of bird sounds,” EURASIP Journal on Advances in Signal
Processing, vol. 2007, Article ID 51806, 9 pages, 2007.
[11] C. Lee, Y. Lee, and R. Huang, “Automatic recognition of
bird songs using cepstral coefficients,” Journal of Informa-
tion Technology and Applications, vol. 1, no. 1, pp. 17–23,
2006.
[12] A. Franzen and I. Y. H. Gu, “Classification of bird species by
using key song searching: a comparative study,” in Proceedings
of the IEEE International Conference on Systems, Man and
Cybernetics, vol. 1, pp. 880–887, October 2003.
[13] E. Bryan George and M. J. T. Smith, “Speech analysis/synthesis
and modification using an analysis-by-synthesis/overlap-add
sinusoidal model,” IEEE Transactions on Speech and Audio
Processing, vol. 5, no. 5, pp. 389–406, 1997.
[14] A. Harma, “Automatic recognition of bird species based
on sinusoidal modeling of syllables,” in Proceedings of the
IEEE International Conference on Acoustics, Speech, and Signal
Processing, pp. 545–548, Hong-Kong, China, 2003.
[15] P. Jan
ˇ
covi
ˇ
c and M. K
¨
ok
¨
uer, “Estimation of voicing-character
of speech spectra based on spectral shape,” IEEE Signal
Processing Letters, vol. 14, no. 1, pp. 66–69, 2007.
[16] P. Jan
ˇ
covi
ˇ
c and M. K
¨
ok
¨
uer, “Incorporating the voicing
information into HMM-based automatic speech recognition
in noisy environments,” Speech Communication, vol. 51, no. 5,
pp. 438–451, 2009.
[17] P. Jan
ˇ
covi
ˇ
c and M. K
¨
ok
¨
uer, “Employment of spectral voicing
information for speech and speaker recognition in noisy con-
ditions,” in Speech Recognition (Technologies and Applications),
chapter 3, pp. 45–60, InTech, 2008.
[18] P. Jan
ˇ
covi
ˇ
c and M. K
¨
ok
¨
uer, “Improving automatic phoneme
alignment under noisy conditions by incorporating spectral
voicing information,” Electronics Le t ters, vol. 45, no. 14, pp.
761–762, 2009.
[19] L. Elliott, Stokes Field Guide to Bird Songs: Eastern Region,
2009.
[20] “Waterfall noise,” downloaded from esound
.org, a copy also available at />jancovic/research/Data.htm.
[21] S.Young,D.Kershaw,J.Odell,D.Ollason,V.Valtchev,andP.
Woodland, The HTK Book. V2.2, 1999.
[22] H. Hirsch and D. Pearce, “The AURORA experimental frame-
work for the performance evaluations of speech recognition
systems under noisy conditions,” in Proceedings of the Interna-
tional Symposium on Computer Architecture and International
Tutorial and Research Workshop (ISCA ITRW ASR ’00),pp.
181–188, Challenges for the New Millenium, Paris, France,
September 2000.