báo cáo hóa học:" Research Article FDM Analysis for Blood Flow through Stenosed Tapered Arteries" pdf
Bạn đang xem bản rút gọn của tài liệu. Xem và tải ngay bản đầy đủ của tài liệu tại đây (953.45 KB, 16 trang )
Hindawi Publishing Corporation
Boundary Value Problems
Volume 2010, Article ID 917067, 16 pages
doi:10.1155/2010/917067
Research Article
FDM Analysis for Blood Flow through
Stenosed Tapered Arteries
D. S. Sankar, Joan Goh, and Ahmad Izani Mohamed Ismail
School of Mathematical Sciences, Science University of Malaysia, 11800 Penang, Malaysia
Correspondence should be addressed to D. S. Sankar, sankar
Received 23 October 2009; Accepted 8 March 2010
Academic Editor: Salim Messaoudi
Copyright q 2010 D. S. Sankar et al. This is an open access article distributed under the Creative
Commons Attribution License, which permits unrestricted use, distribution, and reproduction in
any medium, provided the original work is properly cited.
A computational model is developed to analyze the unsteady flow of blood through stenosed
tapered narrow arteries, treating blood as a two-fluid model with the suspension of all the
erythrocytes in the core region as Herschel-Bulkley fluid and the plasma in the peripheral layer
as Newtonian fluid. The finite difference method is employed to solve the resulting system of
nonlinear partial differential equations. The effects of stenosis height, peripheral layer thickness,
yield stress, viscosity ratio, angleof tapering and power law index on the velocity,wall shear stress,
flow rate and the longitudinal impedance are analyzed. It is found that the velocity and flow
rate increase with the increase of the peripheral layer thickness and decrease with the increase
of the angle of tapering and depth of the stenosis. It is observed that the flow rate decreases
nonlinearly with the increase of the viscosity ratio and yield stress. The estimates of the increase
in the longitudinal impedance to flow are considerably lower for the two-fluid Herschel-Bulkley
model compared with those of the single-fluid Herschel-Bulkley model. Hence, it is concluded that
the presence of the peripheral layer helps in the functioning of the diseased arterial system.
1. Introduction
With the advent of the discovery that the cardiovascular disease arteriosclerosis/stenosis
affects the flow of blood in the arteries and leads to serious circulatory disorders, this area of
biomechanics has been receiving the attention of researchers during the recent decades 1.
Stenosis is the abnormal and unnatural growth on the arterial wall thickness that develops at
various arterial locations of the cardiovascular system under diseased condition 2. Stenoses
developed in the arteries pertaining to brain can cause cerebral strokes and the one developed
in the coronary arteries can cause myocardial infarction which leads to heart failure 3.Ithas
been reported that the fluid dynamical properties of blood flow through nonuniform cross-
section of the arteries play a major role in the fundamental understanding and treatment of
many cardiovascular diseases 4.
2 Boundary Value Problems
It has been pointed out that the blood vessels bifurcate at frequent intervals, and
although the individual segments of arteries may be treated as uniform between bifurcations,
the diameter of the artery decreases quite fast at each bifurcation 5. Hence, the analysis of
blood flow through tapered tubes is very important in understanding the behavior of the
blood flow as the taper of the tube is an important factor in the pressure development 6–8.
How and Black 9 pointed out that the study of blood flow in tapered arteries is also very
useful in the design of prosthetic blood vessels as the use of grafts of tapered lumen has the
surgical advantage: the blood vessels being wider upstream. The important hydrodynamical
factor for tapered tube geometry is the pressure loss which leads to diminished blood flow
through the grafts 10. Hence, the mathematical modeling of blood flow through stenosed
tapered arteries is very important.
Several researchers have studied the blood flow characteristics due to the presence of
a stenosis in the tapered arteries 11–15. Blood behaves like a Newtonian fluid when it flows
through larger arteries at high shear rates, whereas it behaves like a non-Newtonian fluid
when it flows through narrow arteries at low shear rates 16, 17. Since the blood flow through
narrow arteries is highly pulsatile, many attempts have been made to study the pulsatile flow
of blood, treating it as a non-Newtonian fluid 1, 4, 18, 19. Chakravarty et al. 11 and Misra
and Pandey 20 have mentioned that, for blood flowing through narrow blood vessels, there
is a core region of suspension of all of the erythrocytes which is treated as a non-Newtonian
fluid and there is a peripheral layer of plasma which may be represented by Newtonian fluid.
Experimental results of Bugliarello and Sivella 21 and Cokelet 22 showed that the velocity
profiles in narrow tubes confirm the impossibility of representing the velocity distribution by
a single-phase fluid model which ignores the presence of the peripheral layer that plays a
crucial role in determining the flow patterns of the system. Thus, for a realistic description
of blood flow, perhaps, it is more appropriate to treat blood as a two-fluid model with the
suspension of all of the erythrocytes in the core region as a non-Newtonian fluid and the
plasma in the peripheral layer as a Newtonian fluid.
Several researchers have analyzed the two-fluid models for blood flow through
stenosed arteries 17, 20, 23. Chakravarty et al. 11 studied the unsteady flow of blood
through stenosed tapered arteries, treating blood as a two-fluid model with the suspension
of all of the erythrocytes as Casson fluid and the plasma in the peripheral layer as Newtonian
fluid. In this paper, we study the pulsatile flow of blood through stenosed tapered arteries
using finite-difference method, treating blood as a two-fluid model with the suspension of
all the erythrocytes as Herschel-Bulkley H-B
fluid and the plasma in the peripheral layer as
Newtonian fluid.
Chaturani and Ponnalagar Samy 16 and Sankar and Hemalatha 24 have mentioned
that, for tube diameter 0.095 mm, blood behaves like H-B fluid rather than power law and
Bingham fluids. Iida 25 says, “The velocity profile in the arterioles having diameter less
than 0.1 mm are generally explained fairly by the Casson and H-B fluid models. However,
the velocity profile in the arterioles whose diameters less than 0.065 mm does not conform
to the Casson fluid model, but, can still be explained by the H-B model.” Furthermore, the
H-B fluid model can be reduced to the Newtonian fluid model, power-law fluid model, and
Bingham fluid model for appropriate values of the power-law index n and yield index
τ
y
. Since the H-B fluid model’s constitutive equation has one more parameter than the
Casson fluid model, one can get more detailed information about the flow characteristics
by using the H-B fluid model. Moreover, the H-B fluid model can also be used to study
the blood flow through larger arteries, since the Newtonian fluid model can be obtained as
a particular case of this model. Hence, it is appropriate to represent the fluid in the core
Boundary Value Problems 3
r
dl
0
τ
m
φ
z
p
m
δ
m
R
1
z Rz
Peripheral region
Plug flow
Core region
R
p
z
L
0
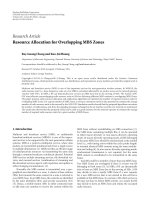
Figure 1: Geometry of the tapered stenosed arterial segment with peripheral layer.
region of the two-fluid model by the H-B fluid model rather than the Casson fluid model.
Thus, in this paper, we study a two-fluid model for blood flow through narrow tapered
arteries with mild stenosis at low shear rates, treating the fluid in the core region as H-B fluid
and the plasma in the peripheral region as Newtonian fluid. The layout of the paper is as
follows.
Section 2 formulates the problem mathematically and then simplifies the governing
nonlinear partial differential equations using coordinate transformation. The finite-difference
method is employed to solve the resulting nonlinear system of partial differential equations
with the appropriate boundary conditions in Section 3. The finite-difference schemes for the
flow velocity, flow rate, wall shear stress, and longitudinal impedance are also obtained in
Section 3.Theeffects of the angle of tapering, pulsatility, stenosis, peripheral layer thickness,
power-law index, viscosity ratio, and yield stress on the above flow quantities are analyzed
through appropriate graphs in Section 4. The estimates of the increase in the longitudinal
impedance for the two-fluid H-B model and single-fluid H-B model are calculated for
different values of the angle of tapering and stenosis height. Some important results are
summarized in the concluding section.
2. Mathematical Formulation
Consider an axially symmetric, laminar, pulsatile, and fully developed flow of blood in the
axial direction
z through a circular tapered artery with an axisymmetric mild stenosis. The
artery is assumed to be too long so that the entrance and end effects can be neglected in the
arterial segment under study. The wall of the artery is assumed to be rigid and the flowing
blood is treated as a two-fluid model with the suspension of all of the erythrocytes in the
core region represented by Herschel-Bulkley H-B fluid and the plasma in the peripheral
layer considered as a Newtonian fluid. Cylindrical polar coordinate system r, θ, z has been
used to analyze the problem, where r and z are taken along the radial and axial directions,
respectively, and θ is the azimuthal angle. The geometry of the tapered arterial segment with
4 Boundary Value Problems
mild stenosis as shown in Figure 1 is mathematically defined by
R, R
1
,R
p
z
⎧
⎪
⎪
⎪
⎪
⎪
⎪
⎪
⎪
⎨
⎪
⎪
⎪
⎪
⎪
⎪
⎪
⎪
⎩
mz a
1,α,β
−
τ
m
,δ
m
,p
m
sec φ
l
2
0
/4
−
τ
m
,δ
m
,p
m
sin
2
φ
l
0
z − d
−
z − d
2
, if d ≤ z ≤ d l
0
,
mz a
1,α,β
, in the nonstenotic region,
2.1
where Rz, R
1
z, R
p
z denote the radius of the tapered stenosed arterial segment in the
peripheral region, core region, and plug-flow region, respectively, a is the constant radius of
the normal artery, φ is the angle of tapering and m tanφ is the slope of the tapered artery,
α is the ratio of the radius of the core region to the radius of the peripheral region and β is the
ratio of the radius of the plug-flow region to the radius of the peripheral region, d denotes
the starting point of the stenosis, l
0
is the length of the stenosis, τ
m
, δ
m
, p
m
are the maximum
depths of the stenosis in the peripheral region, core region, and plug flow, respectively, where
δ
m
ατ
m
and p
m
βτ
m
,andL is the length of the arterial segment and is assumed to be
finite. It can be shown that the radial velocity is negligibly small and can be neglected for a
low Reynolds number flow. The governing equations of motion in the plug-flow region, core
region, and peripheral layer are
∂w
p
∂r
0, if τ ≤ τ
y
, 0 ≤ r ≤ R
p
z
,
∂w
H
∂t
−
1
ρ
H
∂p
∂z
−
1
rρ
H
∂
∂r
r
τ
y
−μ
H
∂w
H
∂r
1/n
, if τ ≥ τ
y
,R
p
z
≤ r ≤ R
1
z
,
∂w
N
∂t
−
1
ρ
N
∂p
∂z
−
1
rρ
N
∂
∂r
r
−μ
N
∂w
N
∂r
, if R
1
z
≤ r ≤ R
z
,
2.2
where w
p
and w
H
are the velocities of the H-B fluid in the plug-flow region and in the core
region, respectively, and w
N
is the velocity of the Newtonian fluid in the peripheral layer
region, ρ
H
and ρ
N
are the densities of the H-B fluid in the core region and Newtonian fluid in
the peripheral layer region, respectively, τ
y
is the yield stress of the H-B fluid, and μ
H
and μ
N
are the viscosities of the H-B fluid in the core region and Newtonian fluid in the peripheral
layer region, respectively. Here, ∂p/∂z is the pressure gradient which is due to the pumping
action of the heart, and for pulsatile flow it is taken as
−
∂p
∂z
A
0
A
1
cos ωt, 2.3
Boundary Value Problems 5
where A
0
and A
1
are the amplitude of the constant pressure gradient and pulsatile pressure
gradient and ω 2πf
p
, f
p
is the pulse rate. The appropriate boundary and initial conditions
are
w
H
w
N
at r R
1
, 2.4
τ
H
τ
N
at r R
1
, 2.5
w
N
0atr R, 2.6
w
H
w
N
0att 0. 2.7
Applying the radial coordinate transformation x r/R into 2.2, one can get
∂w
p
∂x
0if0≤ x ≤ β, 2.8
∂w
H
∂t
−
1
ρ
H
∂p
∂z
−
μ
H
1/n
ρ
H
xR
11/n
τ
y
R
μ
H
1/n
−
∂w
H
∂x
1/n
−
x
n
−
∂w
H
∂x
1−n/n
∂
2
w
H
∂x
2
if β ≤ x ≤ α,
2.9
∂w
N
∂t
−
1
ρ
N
∂p
∂z
μ
N
ρ
N
R
2
∂
2
w
N
∂x
2
1
x
∂w
N
∂x
if α ≤ x ≤ 1. 2.10
Under the coordinate transformation, the boundary conditions 2.4–2.6 become
w
H
w
N
at x α,
τ
H
τ
N
at x α,
w
N
0atx 1,
2.11
and the initial condition 2.7 becomes
w
H
w
N
0att 0. 2.12
3. Finite-Difference Method of Solution
Although many computational methods are available to solve the system of nonlinear partial
differential equations 2.8–2.10,finite-difference method is more easy and efficient for
solving this system of nonlinear partial differential equations. Central difference formula is
6 Boundary Value Problems
applied to the spatial derivatives and forward-difference formula is used to express the time
derivatives and these are given below as follows.
∂w
m
∂x
w
m
k
i,j1
−
w
m
k
i,j−1
2Δx
w
m−fx
k
i,j
,
∂
2
w
m
∂x
2
w
m
k
i,j1
− 2
w
m
k
i,j
w
m
k
i,j−1
Δx
2
w
m−sx
k
i,j
,
∂w
m
∂t
w
m
k1
i,j
−
w
m
k
i,j
Δt
,
3.1
where m H if β<x<αand m N if α<x<1, w
m
x, z, t is discretized into w
m
x
j
,z
i
,t
k
and is denoted as w
m
k
i,j
; we define that x
j
βj −1Δx for j 1, 2, ,N
C
,N
C
1 such that
x
N
C
1
α and x
j
α j − N
C
1Δx for j N
C
1,N
C
2, ,N 1 such that x
N1
1,
z
i
is defined as z
i
i − 1Δz for i 1, 2, ,M 1, and t
k
k − 1Δt, k 1, 2, ; Δx is the
increment in the radial direction, Δz is the increment in the axial direction and Δt is the small
increment in the time. Using the finite-difference formulas 3.1 in 2.9 and 2.10, one can
obtain the following respective finite-difference formulas for the velocity
w
H
k1
i,j
w
H
k
i,j
Δt
×
−
1
ρ
H
∂p
∂z
k
i
−
n
√
μ
H
ρ
H
x
j
R
i
11/n
×
τ
y
n
R
i
μ
H
−
w
H−fx
k
i,j
1/n
−
x
j
n
−
w
H−fx
k
i,j
1−n/n
w
H−sx
k
i,j
if β ≤ x ≤ α,
3.2
w
N
k1
i,j
w
N
k
i,j
Δt
−
1
ρ
N
∂p
∂z
k
i
μ
N
ρ
N
R
i
2
w
N−sx
k
i,j
1
x
j
w
N−fx
k
i,j
if α ≤ x ≤ 1.
3.3
The plug-flow velocity w
p
can be obtained by substituting x β in 3.2. The boundary
conditions 2.11 and 2.12 become
w
H
k
i,N
C
1
w
N
k
i,N
C
1
,
w
H
k
i,N
C
w
H
k
i,N
C
1
−
R
i
Δx
μ
H
τ
H
μ
N
R
i
Δx
w
N
k
i,N
C
2
−
w
N
k
i,N
C
1
n
,
w
N
k
i,N1
0,
w
H
1
i,j
0
w
N
1
i,j
.
3.4
Boundary Value Problems 7
The finite-difference formulas for the flow rate Q, the longitudinal impedance λ,andthewall
shear stress τ are obtained below as follows.
Q
k
i
2π
R
i
2
β
2
w
p
α
β
x
j
w
H
k
i,j
dx
j
1
α
x
j
w
N
k
i,j
dx
j
,
λ
k
i
L
∂p/∂z
k
i
Q
k
i
,
τ
k
i
τ
y
μ
H
R
i
Δx
w
H
k
i,N
C
−
w
H
k
i,N
C
1
1/n
μ
N
R
i
Δx
w
N
k
i,N
−
w
N
k
i,N1
.
3.5
The dimensionless flow rate Q
∗
, the longitudinal impedance λ
∗
, and the wall shear stress τ
∗
are given by the following relations:
Q
∗k
i
Q
k
i
Q
n
k
i
,λ
∗k
i
λ
k
i
λ
n
k
i
,τ
∗k
i
τ
k
i
τ
n
k
i
, 3.6
where Q
n
, λ
n
,andτ
n
are the flow rate, longitudinal impedance, and wall shear stress,
respectively, in the single-fluid normal artery.
4. Numerical Simulations of Results
The objective of the present mathematical model is to understand and bring out the effects of
the pulsatility, non-Newtonian nature, peripheral layer thickness, and stenosis height as well
as angle of tapering on the velocity, flow rate, wall shear stress, and longitudinal impedance
in a blood flow through a stenosed tapered artery when the flowing blood is modeled as a
two-fluid model with the suspension of all of the erythrocytes in the core region as the H-B
fluid and the plasma in the peripheral layer as the Newtonian fluid. It is generally observed
that the typical value of the power-law index n for blood flow models is taken as 0.95 26.
Since the value of yield stress is 0.04 dyne/cm
2
for blood at a haematocrit of 40 27, 28,the
non-Newtonian effects are more pronounced as the yield stress value increases, in particular,
when it flows through narrow blood vessels. In diseased state, the value of yield stress is quite
high almost five times16. In this study, we have used the range 0 to 0.2 for the yield stress
τ
y
. For the numerical simulation of the results and validation of our results with the existing
results, we have used the following parameter values which are used by Chakravarty et al.
11:
a 1.52mm, d 7.5mm, l
0
15 mm, L 30mm, τ
m
0.2a, δ
m
ατ
m
, p
m
βτ
m
, α
0.925, 0.95, 0.985, β 0.025, f
p
1.2 Hz, μ
H
0.035P, A
0
100 kg m
−2
s
−2
, A
1
0.2A
0
, ρ
H
1.125 × 10
3
kg m
−3
, ρ
N
1.025 ×10
3
kg m
−3
, Δx 0.0125, and Δz 0.1.
4.1. Velocity Distribution
The velocity profiles are of particular interest, since they provide a detailed description of
the flow field. The velocity distribution of different fluid models with α 0.95, μ
H
0.035,
8 Boundary Value Problems
−1
−0.5
0
0.5
1
Radial distance, x
0 5 10 15 20
Velocity, v mm/s
Two-flu id
H-B model
Single-fluid
H-B model
Two-flu id
power-law model
Single-fluid
power-law model
Two-flu id
Bingham fluid model
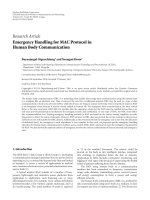
Figure 2: Velocity distribution at the middle of the stenosis at t 0.5 for different fluid models with α
0.95, φ 0.1
◦
, τ
m
0.1a, μ
H
0.035, and μ
N
0.3μ
H
.
−1
−0.5
0
0.5
1
Radial distance, x
0 5 10 15 20 25
Velocity, v mm/s
t 0.2
t 0.4
t 0.6
t 0.8
t 1
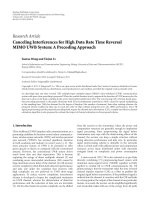
Figure 3: Velocity distribution at the middle of the stenosis for two fluid H-B models at different instants
of time with α 0.95, φ 0.1
◦
, τ
m
0.1a, μ
H
0.035, and μ
N
0.3μ
H
.
φ 0.1
◦
, τ
m
0.1a,andμ
N
0.3μ
H
is shown in Figure 2. One can notice a normal parabolic
velocity profile for the two-fluid and single-fluid power-law models and a flattened parabolic
velocity profile for a short radial distance around the axis of the tube for the two-fluid H-B
and single-fluid H-B models, since H-B fluid model is a fluid model with yield stress. It is
observed that the velocity of the two-fluid power-law model is higher than that of the single-
fluid power-law model and it is also higher than those of the two-fluid and single-fluid H-B
models and two-fluid Bingham model. The velocity distribution of the two-fluid H-B model
at different instants in a time cycle with α 0.95, φ 0.1
◦
, τ
m
0.1a, μ
H
0.035, and μ
N
0.3μ
H
is depicted in Figure 3. It is found that the velocity increases with the increase of the
time in a time cycle.
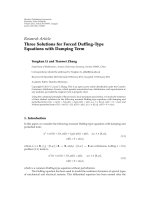
Figure 4 sketches the variation of velocity with axial distance for different values of the
interface position α, angle of tapering φ, and stenosis height τ
m
/a with t 0.5,τ
y
0.1,μ
H
0.035, and μ
N
0.3μ
H
. It is observed that the velocity decreases slowly in the axial direction
from z 0toz 7.5 and then it decreases rapidly nonlinearly from z 7.5 to z 15 and
it increases symmetrically from z 15 to z 22.5 and then it decreases slowly from z 22.5
to z 30. It is found that the velocity decreases continuously and significantly in the axial
direction with the increase of the angle of taper when all of the other parameters are held
constant. The velocity decreases sharply with the increase of the depth of the stenosis height
from z 7.5 to z 15 and then it increases sharply with the decrease of the depth of the
Boundary Value Problems 9
0
0.5
1
1.5
2
2.5
3
Velocity, v mm/s
0 5 10 15 20 25 30
Axial distance, z mm
α 0.925,φ 0.5
◦
,τ
m
/a 0.1
α 0.95,φ 0.1
◦
,τ
m
/a 0.15
α 0.95,φ 0.1
◦
,τ
m
/a 0.1
α 0.925,φ 0.1
◦
,τ
m
/a 0.1
Figure 4: Velocity distribution in the axial direction for different values of φ, τ
m
/a,andα with t 0.5, τ
y
0.1, μ
H
0.035, and μ
N
0.3μ
H
.
30
40
50
60
70
80
90
Flow rate, Q mm
3
/s
0 5 10 15 20 25 30
Axial distance, z mm
α 0.95,φ 0.1
◦
α 0.925,φ 0.1
◦
α 0.95,φ 0
◦
Figure 5: Variation of the rate of flow with axial distance for different values of α and φ with t 0.5, τ
m
0.1a, τ
y
0.1, μ
H
0.035, and μ
N
0.3μ
H
.
stenosis height from z 15 to z 22.5. It is found that the velocity reaches minimum at the
middle of the stenosis at the throat of the stenosis. One can note that, when the thickness of
the peripheral layer increases and the other parameters are kept as invariables, the velocity of
the blood flow increases marginally. Figures 2, 3,and4 show the effects of various parameters
on velocity for the two-fluid flow of blood through stenosed tapered artery.
4.2. Flow Rate
The variation of the flow rate with axial distance for different values of the interface position
α and angle of tapering φ at t 0.5 with τ
m
0.1a, μ
H
0.035, μ
N
0.3μ
H
,andτ
y
0.1
is shown in Figure 5. It is seen that the flow rate decreases slowly from z 0toz 7.5 and
then it decreases very sharply nonlinearly from z 7.5 to z 15. Subsequently, it increases
symmetrically from z 15 to z 22.5 and then it decreases slowly from z 22.5 to z 30.
The flow rate is minimum at the throat of the stenosis as expected. It is found that, for a given
set of values of the angle of tapering, the flow rate increases slightly with the increase of the
peripheral layer thickness. The flow rate decreases significantly with the increase of the angle
of taper while the peripheral layer thickness is held constant.
10 Boundary Value Problems
0
10
20
30
40
50
60
70
80
Flow rate, Q mm
3
/s
00.20.40.60.811.21.4
Time, t s
Two-flu id
H-B model
Single-fluid
H-B model
Two-flu id
power-law model
Single-fluid
Newtonian model
Figure 6: Variation of flow rate with time at the middle of the stenosis for different fluid models with α
0.95, φ 0.1
◦
, τ
m
0.1a, μ
H
0.035, and μ
N
0.3μ
H
.
0
0.1
0.2
0.3
0.4
0.5
0.6
0.7
0.8
0.9
1
Flow rate, Q
∗
00.05 0.10.15 0.2
Stenosis height, τ
m
/a
μ 0.3,τ
y
0.05
μ 0.5,τ
y
0.05
μ 0.3,τ
y
0.1
Figure 7: Variation of flow rate with the stenosis height for different values of μ and τ
y
at t 0.5 with z
15, τ
y
0.1, and τ
m
0.1a.
Figure 6 exhibits the variation of the flow rate in a time cycle at the center of the
stenosis when α 0.95, φ 0.1
◦
, τ
m
0.1a, μ
H
0.035, and μ
N
0.3μ
H
. This figure shows
the pulsatile nature of the blood flow. It is observed that the flow rate increases as time t
in seconds increases from 0 to 0.2 and then it decreases as t increases from 0.2 to 0.5. It
then increases again as t increases from 0.5 to 0.9 and then it decreases as t increases further
from 0.9 to 1.4. It is found that the flow rate for the single-fluid Newtonian model is slightly
higher than that of the two-fluid power-law model and the flow rate of the two-fluid H-B
model is slightly lower than that of the two-fluid power-law model. It is noticed that the
flow rate of the two-fluid H-B model is significantly higher than that of the single-fluid H-B
model.
The variation of the flow rate with stenosis height at t 0.5 with τ
m
0.1a, μ
H
0.035,
and μ
N
0.3μ
H
is shown in Figure 7. It is seen that the flow rate decreases gradually with the
increase of the stenosis height. One can notice that the flow rate decreases very slightly with
the increase of either the viscosity ratio or the yield stress when all of the other parameters
were kept constant. Figures 5, 6,and7 illustrate the effects of various parameters on the flow
rate of the two-fluid flow of blood through stenosed tapered arteries.
Boundary Value Problems 11
0
0.02
0.04
0.06
0.08
0.1
0.12
Wall shear stress, t N/m
2
00.20.40.60.811.21.4
Time, t s
Two-flu id
H-B model
Single-fluid
H-B model
Two-flu id
power-law model
Figure 8: Variation of the wall shear stress with time at the middle of the stenosis for different fluid models
with α 0.95, φ 0.1
◦
, τ
m
0.1a, μ
H
0.035, μ
N
0.3μ
H
,andτ
y
0.1.
4.3. Wall Shear Stress
Figure 8 shows the variation of the wall shear stress with time at the middle of the stenosis for
different fluid models with α 0.95, φ 0.1
◦
, τ
m
0.1a, μ
H
0.035, and μ
N
0.3μ
H
and τ
y
0.1. It is found that the wall shear stress increases rapidly as time t increases from 0 to 0.2 and
then it decreases as t increases from 0.2 to 0.5. It then increases again as time t increases from
0.5 to 0.9 and then it decreases as t increases further from 0.9 to 1.3 and then it increases when
time t increases from 1.3 to 1.4. It can be seen that wall shear stress of the two-fluid power-law
model is marginally lower than that of the two-fluid H-B model and the wall shear stress of
the two-fluid model is significantly lower than that of the single-fluid H-B model.
4.4. Longitudinal Impedance
The variation of the longitudinal impedance to the blood flow in the axial direction at t
0.5 with α 0.95, φ 0.1
◦
, τ
m
0.1a, μ
H
0.035, μ
N
0.3μ
H
,andτ
y
0.1
◦
is shown in
Figure 9. It is seen that the longitudinal impedance to the flow increases very slowly in the
tapered non-stenotic region from z 0toz 7.5 and then it increases rapidly nonlinearly
in the tapered stenosed region from z 7.5 to z 15 where the depth of the stenosis
increases. Subsequently, it decreases sharply in the tapered stenosed region from z 15 to z
22.5 where the depth of the stenosis decreases and then it increases slowly in the tapered
nonstenotic region from z 22.5 to z 30. The longitudinal impedance is maximum at the
throat of the stenosis i.e., at z 15. It is found that the longitudinal impedance increases
slightly with the increase of the viscosity ratio while all of the other parameters were held
constant. One can observe that the longitudinal impedance increases significantly when the
stenosis height increases or the angle of tapering increases. Figure 9 shows the effects of
stenosis height, angle of tapering, and viscosity ratio on the longitudinal impedance to flow
for the two-fluid flow of blood through stenosed tapered artery.
The variation of longitudinal impedance to flow in a time cycle for different fluid
models with α 0.95, φ 0.1
◦
, τ
m
0.1a, μ
H
0.035, μ
N
0.3μ
H
,andτ
y
0.1 is sketched in
Figure 10. It is clear that the longitudinal impedance increases rapidly nonlinearly as time
t in seconds increases from 0 to 0.2 and then it decreases as time t increases further from
0.2 to 0.4. It then oscillates slightly as time t increases further from 0.4 to 1.4. It is noticed that
the longitudinal impedance of the two-fluid H-B model is significantly lower than that of
12 Boundary Value Problems
2E 07
3E 07
4E 07
5E 07
6E 07
7E 07
8E 07
9E 07
Longitudinal impedance,
λ N-s/m
2
0 5 10 15 20 25 30
Axial distance, z mm
φ 0.1
◦
φ 0.5
◦
τ
m
/a 0.1
τ
m
/a 0.05
μ
N
/μ
H
0.3
μ
N
/μ
H
1
Figure 9: Variation of the longitudinal impedance to flow with axial distance at t 0.5 with α 0.95, τ
y
0.1, and μ
H
0.035.
0E 00
1E 07
2E 07
3E 07
4E 07
5E 07
6E 07
7E 07
8E 07
9E 07
1E 08
Longitudinal impedance,
λ N-s/m
2
00.20.40.60.811.21.4
Time, t s
Two-flu id
H-B model
Single-fluid
H-B model
Two-flu id
power-law model
Single-fluid
Newtonian model
Single-fluid
power-law model
Figure 10: Variation of the longitudinal impedance to flow with time at the middle of the stenosis for
different fluid models with α 0.95, φ 0.1
◦
, τ
m
0.1a, μ
H
0.035, μ
N
0.3μ
H
,andτ
y
0.1.
the single-fluid H-B model. It is also observed that the longitudinal impedance is lowest for
the single-fluid Newtonian fluid and the impedance of the two-fluid power model is slightly
higher than that of the single-fluid Newtonian model and slightly lower than that of the two-
fluid H-B model.
Figure 11 depicts the variation of the longitudinal impedance to the blood flow with
the critical height of the stenosis for different fluid models with t 0.5, α 0.95, μ
H
0.035,
μ
N
0.3μ
H
,andτ
y
0.1. It is clear that the longitudinal impedance to flow increases slowly
for the single-fluid Newtonian model and it increases gradually for the two-fluid power-law
model and two-fluid H-B model when the stenosis height increases. It is found that, for the
single-fluid H-B model, the impedance to the flow increases linearly when the stenosis height
increases from 0 to 0.1 and it increases nonlinearly when the stenosis height increases further
from 0.1 to 0.2. It is of interest to note that the plot of the single-fluid Newtonian model is in
good agreement with that in Figure 6 of Srivastava and Saxena 17.
Boundary Value Problems 13
0
0.5
1
1.5
2
2.5
3
3.5
4
4.5
Longitudinal impedance, λ
∗
00.05 0.10.15 0.2
Stenosis height, τ
m
/a
Two-flu id
H-B model
Single-fluid
H-B model
Two-flu id
power-law model
Single-fluid
Newtonian model
Figure 11: Variation of longitudinal impedance to flow with the critical height of the stenosis at z 15 and
t 0.5 with α 0.95, μ
H
0.035, and μ
N
0.3μ
H
.
Table 1: Percentage of increase in longitudinal impedance due to the presence of stenosis for two-fluid H-B
model and single-fluid H-B model with α 0.95, φ 0.0
◦
, τ
y
0.1, μ
H
0.035, and μ
N
0.3μ
H
.
Stenosis height τ
m
/a Two-fluid H-B model Single-fluid H-B model
0.025 9.52 10.16
0.05 19.65 21.71
0.075 30.75 34.87
0.10 44.35 49.93
0.125 60.47 67.23
0.15 76.86 87.18
4.5. Quantification of Longitudinal Impedance
The percentage of increase in the longitudinal impedance to flow due to the presence of the
stenosis and/or taper in the artery is an important measure which plays a significant role in
hemodynamics 27. The percentage of increase in the longitudinal impedance is defined as
the percentage of the ratio between the longitudinal impedance of a particular fluid in the
stenosed and/or tapered artery for a given set of values of the parameters to the longitudinal
impedance of the same fluid in the unstenosed and/or nontapered artery for the same set
of values of the parameters. The estimates of the percentage of increase in longitudinal
impedance due to the presence of the stenosis alone for the two-fluid H-B model and single-
fluid H-B model with φ 0.0
◦
, α 0.95, μ
H
0.035, μ
N
0.3μ
H
,andτ
y
0.1 are computed
in Table 1. One may observe that the percentage of increase in longitudinal impedance to
the flow for the two-fluid H-B model is significantly lower than that of the single-fluid H-B
model. Table 2 presents the estimates of the percentage of increase in longitudinal impedance
to the blood flow due to the presence of only the taper in the artery with τ
m
/a 0.0, α 0.95,
μ
H
0.035, and μ
N
0.3μ
H
. It is noted that the estimates of the percentage of the increase
in longitudinal impedance for the two-fluid H-B model are considerably lower than those
of the single-fluid H-B model. The estimates of the increase in the longitudinal impedance
to the flow due to the presence of both the tapering and stenosis in the artery for two-fluid
H-B model and single-fluid H-B model are computed in Table 3. One can easily note that the
estimates of the increase in the longitudinal impedance to flow are significantly lower for the
14 Boundary Value Problems
Table 2 : Percentage of increase in longitudinal impedance due to the tapering of the artery for two-fluid
H-B model and single-fluid H-B model with α 0.95, μ
H
0.035, τ
m
/a 0.0, μ
N
0.3μ
H
,andτ
y
0.1.
Angle of tapering φ Two-fluid H-B model Single-fluid H-B model
0.1 6.05 6.86
0.2 11.44 14.35
0.3 18.15 22.54
0.4 26.76 31.49
0.5 35.41 41.32
Table 3: Percentage of increase in longitudinal impedance due to the effect of both the angle of tapering
and stenosis height for the two-fluid H-B model and single-fluid H-B model with α 0.95, μ
H
0.035, μ
N
0.3μ
H
,andτ
y
0.1.
Stenosis height τ
m
/a,
Two-fluid H-B model Single-fluid H-B model
Angle of tapering φ
0.05, 0.1 27.45 30.73
0.05, 0.2 35.76 40.93
0.1, 0.1 53.25 61.95
0.1, 0.2 67.23 76.04
two-fluid H-B model than those of the single-fluid H-B model. It is important to mention that
there is a substantial difference between the estimates of the increase in the impedance of the
two-fluid and single-fluid H-B models and, thus, one can expect a marked increase in the
velocity and flow rate of the two-fluid H-B model compared to these flow quantities in the
case of single-fluid H-B model.
5. Conclusion
The present study analyzed the two-fluid Herschel-Bulkley fluid model for blood flow
through stenosed arteries and brings out many important fluid mechanical phenomena due
to the presence of the peripheral layer. The results indicate that the velocity and flow rate
increase with the increase of the peripheral layer thickness and decrease with the increase of
the angle of tapering and depth of the stenosis. It is also noted that the flow rate decreases
nonlinearly with the increase of the viscosity ratio and yield stress. It is found that the
longitudinal impedance to flow increases with the increase of the stenosis height, angle of
tapering, and viscosity ratio. It is further noticed that the velocity and flow rate are higher for
the two-fluid H-B model compared to those of the single-fluid H-B model, whereas the wall
shear stress and longitudinal impedance to flow are considerably lower for the two-fluid H-B
model compared to those of the single-fluid H-B model. It is of importance to mention that
the estimates of the increase in the longitudinal impedance to flow are considerably lower for
the two-fluid H-B model compared with those of the single-fluid H-B model. Thus, the results
demonstrate that the present model is capable of predicting the hemodynamic features most
interesting to physiologists and, thus, it is concluded that the presence of the peripheral layer
helps in the functioning of the diseased arterial system.
Boundary Value Problems 15
Acknowledgment
The present work is financially supported by the Research University Grant of Universiti
Sains Malaysia, Malaysia Grant Ref. no. 1001/PMATHS/816088.
References
1 A. Sarkar and G. Jayaraman, “Correction to flow rate-pressure drop relation in coronary angioplasty:
steady streaming effect,” Journal of Biomechanics, vol. 31, no. 9, pp. 781–791, 1998.
2 S. U. Siddiqui, N. K. Verma, S. Mishra, and R. S. Gupta, “Mathematical modelling of pulsatile flow
of Casson’s fluid in arterial stenosis,” Applied Mathematics and Computation, vol. 210, no. 1, pp. 1–10,
2009.
3 I. Marshall, S. Zhao, P. Papathanasopoulou, P. Hoskins, and X. Y. Xu, “MRI and CFD studies of
pulsatile flow in healthy and stenosed carotid bifurcation models,” Journal of Biomechanics, vol. 37,
no. 5, pp. 679–687, 2004.
4 C. Tu and M. Deville, “Pulsatile flow of non-Newtonian fluids through arterial stenoses,” Journal of
Biomechanics, vol. 29, no. 7, pp. 899–908, 1996.
5 A. P. Dwivedi, T. S. Pal, and L. Rakesh, “Micropolar fluid model for blood flow through small tapered
tube,” Indian Journal of Technology, vol. 20, no. 8, pp. 295–299, 1982.
6 E. W. Merrill, A. M. Benis, E. R. Gilliland, T. K. Sherwood, and E. W. Salzman, “Pressure-flow relations
of human blood in hollow fibers at low flow rates,” Journal of Applied Physiology, vol. 20, no. 5, pp. 954–
967, 1965.
7 S. Oka and T. Murata, “Theory of the steady slow motion of non-Newtonian fluids through a tapered
tube,” Japanese Journal of Applied Physics, vol. 8, pp. 5–8, 1969.
8 S. Oka, “Pressure development in a non-Newtonian flow through a tapered tube,” Biorheology, vol.
10, no. 2, pp. 207–212, 1973.
9 T. V. How and R. A. Black, “Pressure losses in non-Newtonian flow through rigid wall tapered tubes,”
Biorheology, vol. 24, no. 3, pp. 337–351, 1987.
10 W. P. Walawender Jr., C. Tien, and L. C. Cerny, “Experimental studies on the blood flow through
tapered tubes,” International Journal of Engineering Science, vol. 10, no. 12, pp. 1123–1135, 1972.
11 S. Chakravarty, S. Sarifuddin, and P. K. Mandal, “Unsteady flow of a two-layer blood stream past a
tapered flexible artery under stenotic conditions,” Computational Methods in Applied Mathematics, vol.
4, no. 4, pp. 391–409, 2004.
12 J J. Chiu, D. L. Wang, S. Chien, R. Skalak, and S. Usami, “Effects of disturbed flow on endothelial
cells,” Journal of Biomechanical Engineering, vol. 120, no. 1, pp. 2–8, 1998.
13 P. K. Mandal, “An unsteady analysis of non-Newtonian blood flow through tapered arteries with a
stenosis,” International Journal of Non-Linear Mechanics, vol. 40, no. 1, pp. 151–164, 2005.
14
Kh. S. Mekheimer and M. A. E. Kot, “The micropolar fluid model for blood flow through a tapered
artery with a stenosis,” Acta Mechanica Sinica, vol. 24, no. 6, pp. 637–644, 2008.
15 S. Chakravarty and P. K. Mandal, “Two-dimensional blood flow through tapered arteries under
stenotic conditions,” International Journal of Non-Linear Mechanics, vol. 35, no. 5, pp. 779–793, 2000.
16 P. Chaturani and V. R. Ponnalagar Samy, “A study of non-Newtonian aspects of blood flow through
stenosed arteries and its applications in arterial diseases,” Biorheology, vol. 22, no. 6, pp. 521–531, 1985.
17 V. P. Srivastava and M. Saxena, “Two-layered model of casson fluid flow through stenotic blood
vessels: applications to the cardiovascular system,” Journal of Biomechanics, vol. 27, no. 7, pp. 921–928,
1994.
18 P. Chaturani and R. P. Samy, “Pulsatile flow of Casson’s fluid through stenosed arteries with
applications to blood flow,” Biorheology, vol. 23, no. 5, pp. 499–511, 1986.
19 Md. A. Ikbal, S. Chakravarty, K. K. L. Wong, J. Mazumdar, and P. K. Mandal, “Unsteady response of
non-Newtonian blood flow through a stenosed artery in magnetic field,” Journal of Computational and
Applied Mathematics, vol. 230, no. 1, pp. 243–259, 2009.
20 J. C. Misra and S. K. Pandey, “Peristaltic transport of blood in small vessels: study of a mathematical
model,” Computers & Mathematics with Applications, vol. 43, no. 8-9, pp. 1183–1193, 2002.
21 G. Bugliarello and J. Sevilla, “Velocity distribution and other characteristics of steady and pulsatile
blood flow in fine glass tubes,” Biorheology, vol. 7, no. 2, pp. 85–107, 1970.
16 Boundary Value Problems
22 G. R. Cokelet, “The rheology of human blood,” in Biomechanics, Y. C. Fung, Ed., pp. 63–103, Prentice-
Hall, Englewood Cliffs, NJ, USA, 1972.
23 D. S. Sankar, “A two-fluid model for pulsatile flow in catheterized blood vessels,” International Journal
of Non-Linear Mechanics, vol. 44, no. 4, pp. 337–351, 2009.
24 D. S. Sankar and K. Hemalatha, “Non-linear mathematical models for blood flow through tapered
tubes,” Applied Mathematics and Computation, vol. 188, no. 1, pp. 567–582, 2007.
25 N. Iida, “Influence of plasma layer on steady blood flow in microvessels,” Japanese Journal of Applied
Physics, vol. 17, pp. 203–214, 1978.
26 D. S. Sankar and U. Lee, “Two-phase non-linear model for the flow through stenosed blood vessels,”
Journal of Mechanical Science and Technology, vol. 21, no. 4, pp. 678–689, 2007.
27 E. W. Errill, “Rheology of blood,” Physiological Reviews, vol. 49, no. 4, pp. 863–888, 1969.
28 D. S. Sankar and A. I. Md. Ismail, “Two-fluid mathematical models for blood flow in stenosed arteries:
a comparative study,” Boundary Value Problems, vol. 2009, Article ID 568657, 15 pages, 2009.