composite 2012 Part 7 pptx
Bạn đang xem bản rút gọn của tài liệu. Xem và tải ngay bản đầy đủ của tài liệu tại đây (1 MB, 20 trang )
Simple Optical Methods for Measuring Optical Nonlinearities
and Rotational Viscosity in Nematic Liquid Crystals
113
(2b)
where
is the incident beam intensity, I
0
is the on-axis
intensity at focus,
is the nonlinear absorbance of the medium,
is the effective length of the sample, and L is the sample thickness.
By combining Eq.(2a) and Eq.(2b) we obtain the complex electric field at the exit surface of
the sample:
(3)
According to the aberration-free approximation of a Gaussian beam, which requires the
Gaussian beam profile be approximated as being parabolic, by expanding the exponential in
the intensity and retaining only the quadratic term, the nonlinear phase shift, Eq. (2b) can be
approximated as:
(4)
where
. It is noted that Eq.(4) is always valid
whether
or not. By substituting Eq.(4) into Eq.(3) and employing the complex beam
parameter formulation (Kwak et al., 1999) we have finally obtain the closed aperture Z-scan
transmittance of the far-field at the aperture plane, including both of the effects of nonlinear
absorption and nonlinear refraction as follows:
(5)
where is the on-axis nonlinear phase at focus and is
the ratio of the imaginary part to the real part of the complex nonlinearity and is inversely
proportional to the figure of merit (FOM), defined as
(Lenz et al., 2000). The
nonlinear absorptive and refractive contributions to the closed aperture Z-scan
transmittance are coupled in terms of
η
or FOM. When the aperture is removed, however,
the Z-scan is irrelevant to beam distortion caused by nonlinear refraction and is only a
function of the nonlinear absorption, as mentioned above. Hence, the nonlinear absorption
coefficient can readily be determined from the open aperture Z-scan transmittance. By
spatially integrating Eq.(2a) at z over all
without having to include the free
space propagation process, we have the CW open aperture Z-scan transmittance as:
(6)
New Developments in Liquid Crystals
114
where
. Once the nonlinear absorption coefficient is
unambiguously extracted from an open aperture Z-scan, one can use the closed aperture Z-
scan transmittance to determine the remaining unknown coefficient
from Eq.(5).
2.2 Knife-edge X-scan theory for nonlinear absorption
In this section, we propose an alternative optical method for determining the nonlinear
absorption coefficient, so-called knife-edge X-scan method. The knife-edge scanning
technique is a simple single beam method for measuring a laser beam profile such as the
beam radius and the radius of curvature of the wave front (Suzaki & Tachibana, 1975). Due
to its high accuracy, simple apparatus and easy to data analysis, the knife-edge scanning
method has been widely used. As the knife-edge along the x-axis moves across the beam
propagation direction, the beam power at the far-field gradually decreases and eventually
goes to zero. For a Gaussian beam distribution, the (measured) beam power is given by
integrating the Gaussian function from negative infinity to present knife-edge position and
becomes the error function.
Figure 1 represents schematic diagram for the knife-edge X-scan method proposed in this
work to determine the nonlinear absorption coefficient.
Fig. 1. Experimental setup for knife-edge X-scan technique for measuring nonlinear
absorption.
The knife edge is positioned in front of a nonlinear optical medium placed at the focus (i.e.,
z=0) and is transversely scanned to the beam propagation axis from negative infinity to
present knife-edge position. In case of two photon absorption process, the variation of beam
power for a fundamental Gaussian laser beam passing through the medium can be written
as
(7)
where is the output beam intensity at the exit surface of the sample and is given by
Eq.(2a). For a small nonlinear absorbance (i.e., which is valid for our moderate
experimental conditions, substituting Eq. (2a) into Eq.(7) with binomial expansion for
and integrating yields the transmitted power for knife-edge X-scan as
Simple Optical Methods for Measuring Optical Nonlinearities
and Rotational Viscosity in Nematic Liquid Crystals
115
(8)
where
is the on-axis power at focus,
and erf(•) is the error function. As is evident from Eq.(8), the first term (i.e., m=0 ) is exactly
equivalent to the formula for conventional knife-edge scanning without nonlinear sample.
The derivative of the transmitted power with respect to x’ corresponds to a variation of
incident Gaussian beam power (i.e., nonlinear Gaussian beam profile) caused by nonlinear
absorption and is given by
(9)
Figure 2 represents theoretical curves for normalized transmitted power and its derivative
relative to knife-edge position x’ for various nonlinear absorbance q
0
=–0.5 and +0.5. Note
that the first term (i.e., m=0) in Eq.(9) reveals one dimensional Gaussian beam power
without nonlinear material (i.e., q
0
=0) for knife-edge X-scan. For negative nonlinear
absorption (i.e., q
0
<0 or amplification), the beam radius or full width at half maximum
(FWHM) decreases when compared with q
0
=0, while for positive nonlinear absorption (i.e.,
q
0
>0 or real absorption), the beam radius is much broaden than that of q
0
=0.
Fig. 2. Theoretical curves for normalized transmitted power and its derivative relative to
knife-edge position x’ (nonlinear Gaussian beam profile) for various nonlinear absorbance.
2.3 Orientational nonlinear refraction kinetics in nematic liquid crystals for rotational
viscosity: Modified closed-aperture Z-scan
In this section, we will derive the kinetics of orientational refractive index change via
director axis torque of nematic liquid crystals (NLCs), which is caused by a Gaussian optical
field with/without an applied electric field. We also present a simple and accurate method
to measure the rotational viscosity, the response time and the orientational nonlinear
refraction in NLCs by modifying the closed Z-scan. Figure 3 shows the experimental setup.
The optical method proposed in this work has basically the same experimental geometry
used in closed aperture Z-scan. The sole distinction is that the NLC sample is placed at focus
New Developments in Liquid Crystals
116
(i.e., z=0) of an external lens and is fixed at that place during the experiments, unlike Z-scan
technique.
Fig. 3. Schematic diagram of the experimental setup for measuring rotational viscosity of
nematic liquid crystal. A rectangular electric field with a pulse duration time t
0
is applied to
the sample.
Before supplying an external electric field by a function generator, a focused optical beam is
continuously illuminated to the sample, producing the optical field-induced director axis
reorientation (Khoo, 1995), which gives rise to the orientational Kerr effect (OKE) and is
given by
, where n
2,OKE
is the nonlinear refractive
coefficient for OKE, I
0
is the on-axis intensity at focus and w
0
is the beam waist. The on-axis
optical intensity of the far-field beam at the aperture plane is measured as a function of time.
In this experimental situation, we adopt the closed aperture Z-scan formula, Eq.(5), just by
taking z=0, which is given by
(10)
Where . When a rectangular electric field
with a pulse duration time t
0
is applied to the sample, the field-induced director axis
reorientation will be transient from a non-equilibrium state to an equilibrium state of OKE.
In NLCs the field induced reorientation of the director axis is described by a torque balance
equation (Khoo, 1995). We define an angle θ(r,t) as a (small) variation of the director axis
orientation angle from stationary director axis angle induced by constant optical field, being
spatially and temporally varying. Using the small reorientation angle approximation (i.e.,
│θ│<< 1) with the one elastic constant K, the torque balance equation is given by (Khoo,
1995; Kim et al., 2004; Kim et al., 2008)
(11)
where γ
1
is the rotational viscosity coefficient,
is the magnitude of
the director axis torque, which is induced by the applied electric field and the optical
Simple Optical Methods for Measuring Optical Nonlinearities
and Rotational Viscosity in Nematic Liquid Crystals
117
electric field
, and
is a unit vector parallel to the reoriented director axis of NLCs,
where is the dielectric anisotropy. The and the total external electric field
are expressed as and . Then,
the director axis torque is approximated as
.
In order to avoid the complexity for solving the equation, we assume that the NLC sample is
placed at focus, so the Gaussian optical field can be considered as spatially uniform plane
wave. The applied electric field is also spatially uniform and the variation of reorientation
angle
is so small that being considered as negligibly small for the second-
order spatial derivatives, but temporally varying. Furthermore, when
, we take
the direction of is directed toward the direction of , whereas for the case of when
the direction of is directed away from the direction of . With this in
mind, Eq.(11) can then be simplified as
(12a)
(12b)
where
is a response time of NLCs, which is linearly
proportional to the rotational viscosity coefficient and is inversely proportional to the optical
beam intensity. Consider a rectangular electric pulse with a pulse width t
0
and an
amplitude of
is suddenly applied to the sample at time t=0 (i.e.,
otherwise while an optical field is
continuously illuminated the sample from
.
For the case of b>1 (i.e.,
), Eqs.(12) becomes
(13a)
(13b)
Eqs.(13) can be readily solved by using the boundary conditions of which
is continuous
at , and the solution is given by
(14a)
(14b)
Similary, for the case of
, Eqs.(12) becomes
New Developments in Liquid Crystals
118
(15a)
(15b)
The solution to Eqs.(15) is given by
(16a)
(16b)
Since the orientational refractive index is proportional to
(Khoo, 1995), defining the
transient orientational nonlinear refractive index as
where is a
proportional constant, mainly depending on the dielectric anisotropy, then the total
orientational nonlinear refraction consists of the transient contribution,
owing to
the transient electric field and the stationary contribution,
due to the constant optical
field. Therefore, the total nonlinear phase shift , experienced by the optical
beam in travelling the NLC sample is given by , where
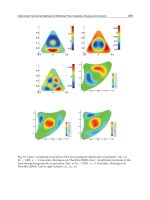
. Figure 4 represents the theoretical predictions of the transient
optical transmittance of Eq.(10) and the reorientation angle of the director axis of Eqs.(14) in
NLC sample. In this simulation, we use the following parameters:
, respectively.
Fig. 4. Theoretical curves of (a) normalized transmittance and (b) reorientation angle as a
function of time.
3. Experiments and discussions
3.1 Sample preparation of nematic liquid crystals cell
We fabricated porphyrin:Zn-doped nematic liquid crystal (NLC) cells filled by capillary
phenomenon between two transparent indium-tin-oxide coated glass substrates with 20 μm
Simple Optical Methods for Measuring Optical Nonlinearities
and Rotational Viscosity in Nematic Liquid Crystals
119
thick beads as a spacer. Two glass substrates were assembled by UV bond and then filled
inside of cells with porphyrin:Zn-doped nematic liquid crystal for various concentrations of
dye (0, 0.006, 0.13, 0.50wt%) . The liquid crystal used was the eutectic liquid crystal mixture,
commercially known as E7 (Merck Ltd.), which has a positive dielectric anisotropy Δε=13.8,
the elastic constants
at room temperature and
wavelength λ=589nm. Zn-doped porphyrin dye [5, 10, 15, 20-tetraphenylporphyrinatozinc
(ZnTPP)] was supplied by Busan National University. We made no surface treatments to
NLC sample, so the director axis orientations are random before they are subject to any
optical field or applied electric field.
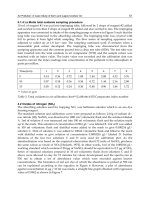
Fig. 5. Transmission spectra for various dye concentrations of porphyrin:Zn in nematic E7
liquid crystal.
The transmission spectrum for pure E7 NLC cell reveals nearly transparent of about 90 % in
visible wavelength range, as shown in Fig. 5. As increasing the concentrations of dye the
transmisstion spectrum is gradually decreased. It is also shown from Fig. 5 that Zn-doped
porphyrin dye is photosensitive to blue-green wavelength region. The linear absorption
coefficients for various dye concentrations at wavelength 632.8nm were estimated by using the
Beer-Lambert law
, neglecting the Fresnel reflection at surfaces of the sample
as follows: , , , and
.
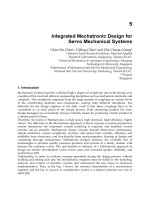
3.2 Determinations of nonlinear absorption coefficient by using knife-edge X-scan
and open-aperture Z-scan
In this section, we determine the nonlinear absorption coefficients for various dye
concentrations in NLC sample by means of knife-edge X-scan method and open-aperture Z-
scan method and compare the experimental results quantitatively. Figure 1 represents the
schematic diagram for the knife-edge X-scan method. The cw He-Ne laser of wavelength
λ=632.8nm is used for experiments and the laser beam power is 3mW. The focal length of
biconvex lens is 20cm. The whole transmitted power is measured by a photo detector during
the knife-edge scan. Before conducting the knife-edge X-scan experiment, we have to
determine the incident Gaussian laser beam profiles such as beam radius w(z), beam waist
w
0
and radius of curvature of the wave front R(z) at z. Figure 6(a) shows the typical
experimental results of normalized power for knife-edge scan against scan x’ distance at
New Developments in Liquid Crystals
120
several, which are well fitted with the theoretic formula as
. Figure 6(b) represents the beam radius
extracted from Fig.6(a) with theoretical curve, yielding the beam waist w
0
=4.90μm, the on-
axis intensity at focus I
0
= 8.0kW/cm
2
and the optical field E
optc.
=0.22V/μm.
Fig. 6. (a) The measured laser beam power for knife-edge scanning vs. scan distance x’, at
several fixed z positions and (b) the measured Gaussian beam radius w(z)with theoretical
curve.
To determine the nonlinear absorption coefficient of the sample we performed two kinds of
experiments; one is the knife-edge X-scan in which the sample is placed at rear face of the
knife-edge, as shown in Fig. 1, and the other is the conventional open-aperture Z-scan. Since
the closed-aperture Z-scan transmittance is entangled with the nonlinear refraction and the
nonlinear absorption, as described in Eq.(5), one should determine the nonlinear absorption
coefficient before finding the nonlinear refractive coefficient. Once the nonlinear absorption
coefficient
β
is extracted from the open aperture Z-scan or the knife-edge X-scan, one can
extracts the remaining unknown nonlinear refractive coefficient n
2
from the closed aperture
Z-scan transmittance. Figure 7 represents the typical experimental results of the knife-edge
X-scan and the open aperture Z-scan for various dye concentrations with the theoretical
predictions.
Table 1 compares the nonlinear absorption coefficient
β
for various dye concentrations,
determined by the knife-edge X-scan method with the open aperture Z-scan method.
Nonlinear absorption coefficients determined by two methods are in good agreement with
each other.
Table 1. Comparison of knife-edge X-scan with open aperture Z-scan for determined
nonlinear absorption coefficients for various dye concentrations of nematic liquid crystal.
-8 -4 0 4 8
-100
-50
0
50
100
beam radius (μm)
z (mm)
(b)
-150 -100 -50 0 50 100 150
0.0
0.2
0.4
0.6
0.8
1.0
normalized power
scan distance x' (mm)
z = 12 mm
z = 8 mm
z = 4 mm
z = 0 mm
(a)
Simple Optical Methods for Measuring Optical Nonlinearities
and Rotational Viscosity in Nematic Liquid Crystals
121
Fig. 7. (a) Knife-edge X-scan data and (b) open aperture Z-scan data for various dye
concentrations of nematic liquid crystal with theoretical curves.
New Developments in Liquid Crystals
122
3.3 Determinations of nonlinear refractive coefficient by using closed aperture Z-scan
Figure 8 depicts the typical closed aperture Z-scan data, revealing a self-defocusing nature.
The nonlinear refractive coefficients are determined from the best curve fitting using Eq.(5)
with the known nonlinear absorption coefficients obtained from preceding subsection.
Fig. 8. The closed-aperture Z-scan transmittance data for various dye concentrations of
nematic liquid crystal with theoretic curves of Eq.(5).
3.4 Determinations of rotational viscosity by modified closed-aperture Z-scan
Following the method described in subsection 2.3, we conducted the transient optical
transmittance experiments by applying the rectangular electric field with the pulse duration
time of
and the amplitude of . The NLC sample is placed at focus
(i.e., z=0) of an external lens and is fixed at that place during the experiments. The optical
field is at focus . Before applying the
rectangular pulse field, the focused optical beam which is continuously illuminated
produces a bias nonlinear refraction, which is called the optical-field induced orientational
Simple Optical Methods for Measuring Optical Nonlinearities
and Rotational Viscosity in Nematic Liquid Crystals
123
Fig. 9. The experimental data of normalized transient optical transmittance and normalized
reorientation angle against time for various dye concentrations with theoretical curves.
Kerr effect
. Figure 9 represents the transient optical transmittances
and the corresponding reorientation angles for various dye concentrations after the electric
field is switched off. It should be noted that the steady state value of the reorientation angles
do not go to zero, strongly implying the existence of the bias OKE caused by constant optical
field, as theoretically predicted.
Table 2 compares the rotational viscosity coefficient and nonlinear refractive index
coefficient for various dye concentrations, determined by the transient optical transmittance
(or modified Z-scan) method with the closed aperture Z-scan method. Nonlinear refractive
index coefficient, which is determined by two methods are in good agreement with each
other. It reveals that the physical mechanism of the Kerr effect in NLC is caused by the
optical field-induced director axis reorientation. It is also noted that the measured value of
the rotational viscosity coefficient of 0.23Pa⋅s for pure E7 is almost the same value of
0.224Pa⋅s at 25°C by means of transient current method (Chen & Lee, 2007).
New Developments in Liquid Crystals
124
Table 2. Rotational viscosity coefficient and nonlinear refractive coefficient for various dye
concentrations.
4. Conclusion
In this chapter, we propose simple and accurate optical methods to determine the nonlinear
refraction, the nonlinear absorption and the rotational viscosity coefficient in dye-doped
nematic liquid crystals, and also develop the corresponding theories. The versatile optical
methods presented are as follows: (i) closed aperture Z-scan for measuring both the sign and
the magnitude of the optical nonlinear refraction, taking into accounting two photon
absorption, (ii) open aperture Z-scan and knife-edge X-scan for measuring the nonlinear
absorption coefficient unambiguously, and (iii) modified closed aperture Z-scan (or
transient optical transmittance) method by applying a rectangular electric field to measure
the orientational Kerr effect (OKE) and the rotational viscosity coefficient. The measured
values of optical nonlinearities and the rotational viscosity by an optical method are cross-
checked by another method, showing excellent agreement with each other.
5. References
Chen, H. Y.; Lee, W. & Clark N. A. (2007). Faster electro-optical response characteristics of a
carbon-nanotube-nematic suspension. Appl. Phys. Lett., Vol 90, Issue 3, 033510,
ISSN: 0003-6951
deSouza, P. C.; Nader, G.; Catunda, T.; Muramatsu, M. & Horowicz, R. J. (1999). Application
of the Z-scan technique to a saturable photorefractive medium with the overlapped
ground and excited state absorption. Opt. Comm., Vol. 177, Issue 1-6, 417-423, ISSN:
0030-4018
Durand, G.; Leger, L.; Rondelez, F. & Veyssie, M. (Orsay Liquid Crystal Group) (1995).
Quasielastic Rayleigh scattering in nematic liquid crystals. Phys. Rev. Lett., Vol. 22,
Issue 25, 1361-1363, ISSN: 0031-9007
Gomes, A. S. L.; Demenicis, L.; Petrov, D. V.; de Araujo, C. B.; de Melo, C. P. & Souto-Maior,
R. (1996). Time-resolved picosecond optical nonlinearity and all-optical Kerr gate in
poly (3-hexadecylthiophene). Appl. Phys. Lett., Vol. 69, Issue 15, 2166-2168, ISSN :
0003-6951
Imai, M.; Naito, H.; Okuda, M. & Sugimura, A. (1995). Determination of rotational viscosity
and pretilt angle in nematic liquid crystals from transient current: influence of ionic
conduction. Mol. Cryst. Liq. Cryst., Vol. 259, 37-46, ISSN: 1542-1406
Simple Optical Methods for Measuring Optical Nonlinearities
and Rotational Viscosity in Nematic Liquid Crystals
125
Khoo, I. C. (1995). Liquid crystals: Physical properties and nonlinear optical phenomena. 121-150,
John Wiley & Sons, Inc., ISBN: 0-471-30362-3, New York
Kneppe, H.; Schneider, F. & Sharma, N. K. (1982). Rotational viscosity of nematic liquid
crystals. J. Chem. Phys. Vol. 77, Issue 6, 3203-3208, ISSN: 0021-9606 1
Kim, E. J.; Yang, H. R.; Lee, S. J.; Kim, G. Y. & Kwak, C. H. (2008). Orientational
photorefractive holograms in porphyrin:Zn-doped nematic liquid crystals. Opt.
Express, Vol. 16, Issue 22, 17329-17341, ISSN: 1094-4087
Kim, K. H.; Kim, E. J.; Lee, S. J.; Lee, J. H.; Kim, J. E. & Kwak, C. H. (2004). Effects of applied
field on orientational photorefraction in porphyrin:Zn-doped nematic liquid
crystals. Appl. Phys. Lett., Vol. 85, Issue 3, 366-368, ISSN: 0003-6951
Kwak, C. H.; Lee, Y. L. & Kim, S. G. (1999). Analysis of asymmetric Z-scan measurement for
large optical nonlinearities in an amorphous As
2S3 thin film. J. Opt. Soc. Am. B, Vol.
16, Issue 4, 600-604, ISSN: 0740-3224
Leenhouts, F. (1985). Determination of the rotational viscosity from the director pattern
relaxation in twisted nematic cells. J. Appl. Phys., Vol. 58, Issue 6, 2180-2183, ISSN:
0021-8979
Lenz, G.; Zimmermann, J.; Katsufuji, T.; Lines, M. E.; Hwang, H. Y.; Spalter, S.; Slusher,
R. E.; Cheong, S. W.; Sangher, J. S. & Aggarwal, I. D. (2000). Large Kerr effect in
bulk Se-based chalcogenide glasses. Opt. Lett., Vol. 25, Issue 4, 254-256, ISSN: 0146-
9592
Lefkiry, M.; Phu, X. N. and Rivoire, G. (1998). Existence of a bistable polarization state in a
Kerr medium in the presence of two-photon absorption. Quantum Semiclass. Opt.,
Vol. 10, No. 1, 283-292 ISSN: 1464-4266
Liao, H. B.; Xiao, R. F.; Wang, H.; Wong, K. S. & Wong, G. K. L. (1998). Large third-order
optical nonlinearity in Au:TiO
2 composite films measured on a femtosecond time
scale. Appl. Phys. Lett., Vol. 72, Issue 15, 1817-1819, ISSN: 0003-6951
Martinoty, P. & Candau, S. (1971). Determination of viscosity coefficents of a nematic liqid
crystal using a shear waves relectance technique. Mol. Cryst. Liq. Cryst., Vol. 14 243-
271, ISSN: 1542-1406
Martins, A. F.; Esnault, P. & Volino, F. (1986). Measurement of the viscoelastic coefficients of
main-chain nematic polymers by an NMR technique. Phys. Rev. Lett., Vol. 57, Issue
14, 1745-1748, ISSN: 0031-9007
Prost, J. & Gasparoux, H. (1971). Determination of twist viscosity coefficient in the nematic
mesophases Phys. Lett. A, Vol. 36, Issue 3, 245-256, ISSN: 0375-9601
Sheik-Bahae, M.; Said, A. A.; Wei, T. H.; Hagan, D. J. & Stryland, E. V. (1990). Sensitive
measurement of optical nonlinearities using a single beam. IEEE J. Quantum
Electron., Vol. 26, Issue 4, 760-769, ISSN: 0018-9197
Suzaki, Y. & Tachibana, A. (1975). Measurement of the μm sized radius of Gaussian laser
beam using the scanning knife-edge. Appl. Opt., Vol. 14, Issue 12, 2809-2810, ISSN:
0003-6935
Watanabe, Y.; Ohnishi, M. & Tsuchiya, T. (1995). Measurement of nonlinear absorption and
refraction in titanium dioxide single crystal by using a phase distortion method.
Appl. Phys. Lett., Vol 66, Issue 25, 3431-3432, ISSN: 0003-6951
New Developments in Liquid Crystals
126
Yavrian, A.; Galstyan, T. V. & Pich´e, M. (1999). Single-mirror interferometer for nonlinear
optical characterization. IEEE J. Quantum Electron., Vol. 35, 1430-1433, ISSN: 0018-
9197
7
A Polarizer-free Liquid Crystal Display
using Dye-doped Liquid Crystal Gels
Yi-Hsin Lin, Jhih-Ming Yang, Hung-Chun Lin, and Jing-Nuo Wu
Department of Photonics, National Chiao Tung University
Taiwan, R. O. C.
1. Introduction
Liquid crystal (LC) based photonic devices are important in light modulated applications
including amplitude modulation and phase modulation. [Yang et al. (2006)] The anisotropic
properties of LC result in employing two polarizers in most of LC devices. The optical
efficiency (~3%) and the viewing angle are limited. Therefore, it is highly desirable to
develop polarizer-free LC devices. [Yang et al. (2006); Lin et al. (2008)] In polarizer-free
liquid crystal displays (LCDs), two types are demonstrated. One is polarizer-free Guest-
Host LCD which obtains dark state by doping small amount of dichroic dye molecules into
LC host. [White et al. (1974); Cole et al. (1977); Bahadur (1992); Wu et al. (2001); Yang (2008)]
However, the contrast ratio and reflectance are low due to the dichroic ratio (~10:1) of dyes.
The other is scattering-absorption type, which combines light scattering and absorption. The
second type is to mimic the display shown in white paper. In a printed paper, the printed
areas turn out dark because the ink absorbs light and light is scattered by the fibers in the
white paper. In order to obtain scattering effect, the polymer and liquid crystal complex
system is used, including polymer dispersed liquid crystals (PDLCs), polymer networks
liquid crystals or liquid crystal gels. [Drzaic (1995)] The scattering mainly results from the
mismatch of refractive indices of polymer networks and liquid crystal molecules. To further
increase light absorption, dye molecules are doped into the polymer and liquid crystal
complex system, for example, dye-doped PDLCs[Drzaic (1995); Lin et al. (2004)], and dye-
doped LC gels. [Lin et al. (2005); Lin et al. (2006); Lin et al. (2008); Lin et al. (2009)] Contrast
ratio (CR) of dye-doped PDLC is still not good enough because the dye solubility with
polymer matrix, the order parameter of dye and dichroic ratio (typically ~10:1) of dye.
[Drzaic (1995); Lin et al. (2004)] In 2005, we have developed a polarizer-free LCD using a
dye-doped dualfrequency liquid crystal (DFLC) gel on the ITO-only glass substrates [Lin et
al. (2005); Lin et al. (2006)]. Although its contrast ratio reaches ~150:1 and response time ~6
ms under frequency modulation and the laser-based measurement, the frequency driving
scheme, high driving voltage (~30 V
rms
) and unavoidable dielectric heating effect. [Wen et al.
(2005); Yin et al. (2006)] need to be overcome for TFT-LCDs and flexible displays
applications.
To avoid the dielectric heating effect of DFLC, negative LC within vertical alignment layer is
a good alternative and it is suitable for making a transflective LCD [Lin et al. (2006)]. The
Open Access Database www.intechweb.org
Source: New Developments in Liquid Crystals, Book edited by: Georgiy V. Tkachenko,
ISBN 978-953-307-015-5, pp. 234, November 2009, I-Tech, Vienna, Austria
New Developments in Liquid Crystals
128
gel-like feature of materials, vertically aligned polymer network and low temperature
processes drives us to realize a trim-able and bendable polarizer-free flexible display in
reflective mode. In 2008, we demonstrated a polarizer-free flexible electro-optical switch
using dye-doped LC gels which is polarizer-free, fast response, high contrast. [Lin et al.
(2008)] Many parameters affect the phase separation process [Yang et al. (2006); Ren et al.
(2008)]and then have influence on the electro-optical properties of dye-doped LC gels, such
as curing temperature effect. The normally white gels exhibit ~55% reflectance, ~450:1
contrast ratio, ~6.4 ms response time, and ~30 V
rms
at f=1 kHz driving voltage at curing
temperature 10 ºC. A single pixel flexible reflective display using such dye-doped LC gels
are also demonstrated under bending and trimming. To further realize a display with multi-
pixels, the substrate is patterned by pixilated indium-tin-oxide (ITO) in general. However,
the involved fabrication and driving are complicated. It also causes problems especially in
the fabrication process of flexible displays, such as chemical stability of plastic substrates,
failure of ITO under tension and so on. [Crawford (2005)] In order to achieve a simple and
easy process for flexible displays, we developed a multiple-step switch using distinct dye-
doped LC gels without patterning ITO layers in 2009. [Lin et al. (2009)] Moreover, the switch
should provide extra information states besides voltage-on and voltage-off states for the
applications of the decorative displays within a simple driving and manufacturing process.
The distinct dye-doped LC gels can display information by the spatial distribution of
polymer network density without patterned ITO layers. The different regions of polymer
network densities have different threshold voltages, but the similar bright and dark states.
The distinct dye-doped LC gel is transparent (or in bright state) at 0 V
rms
and opaque (or in
dark state) at 30 V
rms
. At 9 V
rms
, it shows the colored pattern (or information) because of
distinct polymer networks. The response time is ~10 ms and contrast ratio is ~200:1. We can
also extend the concept for a polarizer-free four step switch. The potential applications are
for decorative displays, electrically tunable diaphragm, and electrically tunable low pass or
high pass filter.
In this book chapter, we introduce a polarizer-free LCD using dye-doped LC gels whose the
physical mechanism is mainly the combination of both light scattering and absorption. In
the beginning, we introduce the structure and mechanism of our dye-doped liquid crystal
gels. Second, the experimental setups, results (morphologies, electro-optical properties,
response time) and mathematical model are also discussed. Third, the performance of such a
polarizer-free liquid crystal display is shown. Finally, we will introduce multiple step
switches using distinct dye-doped LC gels for the application of decorative displays. The
potential applications are flexible displays, electrically tunable light shutters, and decorative
displays.
2. Polarizer-free dye-doped liquid crystal gels
2.1 Structures and operating principles
The structure and operation principles of the dye-doped LC gel are schematically depicted
in Fig. 1. At V=0, the cell does not scatter light and the absorption is rather weak due to the
vertically aligned polymer networks, liquid crystal directors and dye molecules. Therefore,
the display has the highest reflectance. When the applied voltage (V
1
) is larger than the
threshold voltage (V
th
), the LC directors with a negative dielectric anisotropy are tilted away
from the electric field and LC molecules bring dye molecules to rotate with them, as shown
in Fig. 1. The cell is then switched into a multi-domain structure. As a result, both of
A Polarizer-free Liquid Crystal Display using Dye-doped Liquid Crystal Gels
129
scattering and absorption increase. Then the reflectance decreases. In addition, all the LC
directors and dye molecules have the same tilt angle but random orientations. Therefore, the
reflectance is polarization-independent. When we further increase the voltage (V
2
>>V
th
), the
LC directors and dye molecules are aligned along x-y plane randomly, as Fig. 1 depicts. The
scattering and absorption are maximal. Besides, all the polarizations of incident light
experience the same averaged scattering and absorption. As a result, the dye-doped LC gel
appears black and is still polarization independent. The appearance of color is mainly
because of the light absorption of dye. The scattering and reflection assist the multiple
absorption due to the elongate the paths of light propagation.
Fig. 1. Schematic operating principle of dye-doped liquid crystal display at V=0, V
1
>V
th
, and
V
2
>> V
th
. The alignment layer has no rubbing treatment.
2.2 Fabrications
The dye-doped LC gel we employed is a mixture of negative nematic liquid crystal ZLI-4788
(Merck, n
e
= 1.6567, Δn=0.1647 at λ=589 nm; Δε= -5.7 at f= 1 kHz) and a diacrylate monomer
(bisphenol-A-dimethacrylate) with a dichroic dye S428 (Mitsui, Japan) at 90:5:5 wt% ratios.
The structure of the diacrylate monomer is shown as follows:
The dye-doped LC mixture was then injected into an empty cell consisting of two glass
substrates whose inner surfaces were coated with a thin conductive layer, indium-tin-oxide
(ITO) and polyimide (PI) layer without rubbing treatment. The PI layer provides vertical
alignment for the LC directors. The cell gap was 5 μm. The filled cell was irradiated by a UV
New Developments in Liquid Crystals
130
light (λ~365 nm, I~3 mW/cm
2
). The cell was cured at a fixed temperature for 1.5 hr. Such a
fixed temperature is called curing temperature. After photo-polymerization, the formed
chainlike polymer networks are along the z direction because the LC directors are aligned
perpendicular to the glass substrates during the UV curing process, as shown in Fig. 1.
2.3 Morphologies
Fig. 2 show the morphologies observing under an optical microscope with a single polarizer
only. The top region of the two regions in Fig. 2 is the patterned ITO area. The bright region
represents the state of V=0. The dark area represents the ITO electrodes applied 30 V
rms
at
f=1 kHz. At the voltage-off state, the cell shows good bright state because of the vertically
aligned polymer networks, LC and dye molecules. At 30 V
rms
, it shows the fine domain
textures of the polymer networks, and red color because of dye molecules, as shown in Fig.
2. Our LC cell shows good dark and bright states although the dark state up to now is
redish, not truly black.
Fig. 2. The microscopic images of dye-doped LC gels at 0 V
rms
and 30 V
rms
.
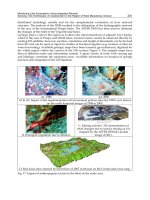
The photographs of Scanning Electron Microscopy (SEM) are shown in Fig. 3 (a)-(h). Fig. 3
(a), (c), (e) and (g) are the top views of the cells at different curing temperatures (T). Fig. 3
(b), (d), (f), and (h) are the side views of the cells at different curing temperatures. In Fig. 3
(b), (d), (f), and (h), the polymer networks are perpendicular to the glass substrates. The
polymer networks of dye-doped LC gels consist of chain-linked polymer grains. The
averaged sizes of polymer grains measured from Fig. 3 (a), (c), (e) and (g) are around 68 nm
at T=10ºC, 94nm at T=20ºC, 125nm at T=30ºC, 132nm at T=40ºC. The averaged domain sizes
of polymer networks measured from Fig. 3 (b), (d), (f), and (h) are around 3.25 μm at
T=10ºC, 4.62 μm at T=20ºC, 4.78 μm at T=30ºC, 6.12 μm at T=40ºC. Both of the domain sizes
and the size of polymer grains increase with curing temperatures. The scattering is mainly
because of the domain sizes of polymer networks because the domain sizes of polymer
networks are near wavelength of incident light while the sizes of polymer grains are smaller
than the wavelength.
2.4 Electro-optical properties
We adopt the typical reflectance measurement to measure the electro-optical properties of
dye-doped LC gels. Because the guest-host system we employed appears dark red rather
than black, we used an unpolarized green He-Ne laser (λ=543.5 nm, Melles Griot, Model 05-
LGR-173) instead of a white light source for characterizing the device performances. A
dielectric mirror was placed behind the cell so that the laser beam passed through the cell
twice. A large area photodiode detector (New Focus, Model 2031) was placed at ~25 cm (the
A Polarizer-free Liquid Crystal Display using Dye-doped Liquid Crystal Gels
131
Fig. 3. SEM photographs of dye-doped LC gels at curing temperatures 10ºC (a, b), 20ºC (c,
d), 30ºC (e, f), and 40ºC (g, h). The LC and dye were extracted. (a), (c), (e) and (g) are the top
views of the cells. (b), (d), (f), and (h) are the side views of the cells. The white-indicated bars
in (a), (c), (e) and (g) are 100 nm.
New Developments in Liquid Crystals
132
normal distance for viewing a mobile display) behind the sample which corresponds to ~2º
collection angle. A computer controlled LabVIEW data acquisition system was used for
driving the sample and recording the light reflectance. In order to prove our dye-doped LC
gel is polarization independent, we placed a polarizer between the laser and the LC cell. The
reflectance as a function of an angle of the polarizer at different applied voltages is shown in
Fig. 4. The variation of reflectance is less than 5% when we rotated the polarizer. It indicates
the dye-doped LC gels are indeed polarization independent at all applied voltages. The
reflectance at 0 V
rms
is around 50%.
Fig. 4. Reflectance as a function of angle of the polarizer at different applied voltages. The
curing temperature was 20 ºC.
2.4.1 Curing temperature effect
After we removed the polarizer, the incident light then was unpolarized green laser beam.
Fig. 5 (a) is the measured voltage-dependant reflectance of the dye-doped LC gels at various
curing temperatures. The reflectance was normalized to that of a pure LC cell with the same
cell gap. The reflectance decreases gradually with the applied voltage V>V
th
due to the
increases of the scattering and the absorption. As curing temperature decreases, the
increases (~40% to ~55%) of maximum reflectance at V=0 and that is because of the better
vertical alignment of LC directors, dye molecules and polymer networks at a low curing
temperature. The contrast ratio (CR) is defined as a reflectance ratio of 0 V
rms
to 30 V
rms
. The
CRs are ~450: 1 at 10 ºC, ~250: 1 at 20 ºC, ~200: 1 at 30 ºC, and ~300: 1 at 40 ºC. The contrast
ratio decreases as T< 30ºC and then increases as T>30ºC. That is because the increase of a
curing temperature results in larger polydomains; therefore, the CR and threshold voltage
decrease. Moreover, the decay time increases, as shown in Fig. 5(b). When the temperature
is higher than 30ºC, we found the cell has dynamic scattering, a fluctuation of liquid crystal
directors in polymer domains, to help rebooting the contrast ratio in spite of the larger
domain size. To lower the driving voltage, a high birefringence and high absolute value of
dielectric anisotropy (Δε) of a negative LC and slightly lower polymer concentration could
be considered.
Response time is also an important parameter for Guest-Host LCDs. The response time of
the dye-doped LC gels was measured using 30 V
rms
squared pulses with time duration
500ms at f=1 kHz. The curing temperature-dependent rise times and decay times are shown
in Fig. 5(b). The rise times are about 0.4 ms and the decay time decreases with decreasing
curing temperatures. A typical response time of a guest-host display is around 50 ms. The
response time of our dye-doped LC gel (~6.4ms) is faster because polymer network helps
LC directors to relax back. The rise time is ~0.4 ms and decay time is ~6 ms at 10 ºC.