New Developments in Biomedical Engineering 2011 Part 12 pptx
Bạn đang xem bản rút gọn của tài liệu. Xem và tải ngay bản đầy đủ của tài liệu tại đây (7.3 MB, 40 trang )
NewDevelopmentsinBiomedicalEngineering432
second-order-gradiometer pickup,
2
B
z
/z
2
, with a baseline of 70 mm. The flux transformer
was assumed to be electronically balanced to C
B
= 10
-3
(Vázquez-Flores, 2007).
Fig. 5. The prevalence of principal classes of fetal presentation along gestation, as observed
in 2,276 subjects by Scheer and Nubar (1976).
Another significant factor affecting fMCG waveform morphology and the SNR is fetal
presentation. Fetal presentations are categorized into three principal classes: cephalic,
breech, and transverse. Scheer and Nubar (1976) made an exhaustive study of 2,276
pregnant women in which they classified their respective babies into one of the principal
presentations. The observed prevalence of fetal presentations in the longitudinal study is
summarized in Fig. 5. There is limited published information about the SNR variation and
changes in fMCG waveform morphology for various fetal presentations (Horigome et al.
2006). Although the incidence of cephalic presentation increases with increasing gestational
age, the non-cephalic presentation is a common occurrence in early pregnancy when the
fetus is highly mobile within a relatively large volume of amniotic fluid. Figure 6 illustrates
rather large changes occurring in magnetic field distribution (B
z
component) above a gravid
abdomen (GA = 40 weeks) calculated for cephalic presentation and various axial rotations of
fetal body
Gestational Age [weeks]
20 25 30 35 40
Percent of patients [%]
0
20
40
60
80
100
Cephalic
Breech
Other
n = 2,276
Fig. 6. Magnetic field (normal component) distribution above a gravid abdomen (GA=40
weeks) for a cephalic presentation for various fetal body rotations. Biomagnetic modeling
data show that up to 30% signal amplitude variation is possible due to fetal body rotation
(Vázquez-Flores, 2007).
4. Biomagnetic Signal Processing and QRS Detection
The beat-to-beat changes in fetal heart rate may be masked by incorrect signal processing
and QRS detection procedures. Although a wide diversity of QRS detection schemes for
electrocardiographic signals have been developed (Köhler et al., 2002; Friesen et al., 1990),
automatic QRS techniques specific to fetal magnetocardiograhic signals are rare. A modified
Pan-Tompkins QRS detection algorithm has been successfully implemented for automatic
QRS detection in normal pregnancies of gestational ages 26—35 weeks (Brazdeikis et al.,
2004). The general Pan-Tompkins QRS detection scheme (Pan & Tompkins, 1985) consists of
a band-pass filtering stage, a derivative, squaring and windowing stage, and peak detection
and classification stage that matches results from the two previous stages, as illustrated in
Fig. 7. Quantitative analysis of fMCG showed excellent QRS detection performance with
signal pre-processing and parameter tuning.
BiomagneticMeasurementsforAssessmentofFetalNeuromaturationandWell-Being 433
second-order-gradiometer pickup,
2
B
z
/z
2
, with a baseline of 70 mm. The flux transformer
was assumed to be electronically balanced to C
B
= 10
-3
(Vázquez-Flores, 2007).
Fig. 5. The prevalence of principal classes of fetal presentation along gestation, as observed
in 2,276 subjects by Scheer and Nubar (1976).
Another significant factor affecting fMCG waveform morphology and the SNR is fetal
presentation. Fetal presentations are categorized into three principal classes: cephalic,
breech, and transverse. Scheer and Nubar (1976) made an exhaustive study of 2,276
pregnant women in which they classified their respective babies into one of the principal
presentations. The observed prevalence of fetal presentations in the longitudinal study is
summarized in Fig. 5. There is limited published information about the SNR variation and
changes in fMCG waveform morphology for various fetal presentations (Horigome et al.
2006). Although the incidence of cephalic presentation increases with increasing gestational
age, the non-cephalic presentation is a common occurrence in early pregnancy when the
fetus is highly mobile within a relatively large volume of amniotic fluid. Figure 6 illustrates
rather large changes occurring in magnetic field distribution (B
z
component) above a gravid
abdomen (GA = 40 weeks) calculated for cephalic presentation and various axial rotations of
fetal body
Gestational Age [weeks]
20 25 30 35 40
Percent of patients [%]
0
20
40
60
80
100
Cephalic
Breech
Other
n = 2,276
Fig. 6. Magnetic field (normal component) distribution above a gravid abdomen (GA=40
weeks) for a cephalic presentation for various fetal body rotations. Biomagnetic modeling
data show that up to 30% signal amplitude variation is possible due to fetal body rotation
(Vázquez-Flores, 2007).
4. Biomagnetic Signal Processing and QRS Detection
The beat-to-beat changes in fetal heart rate may be masked by incorrect signal processing
and QRS detection procedures. Although a wide diversity of QRS detection schemes for
electrocardiographic signals have been developed (Köhler et al., 2002; Friesen et al., 1990),
automatic QRS techniques specific to fetal magnetocardiograhic signals are rare. A modified
Pan-Tompkins QRS detection algorithm has been successfully implemented for automatic
QRS detection in normal pregnancies of gestational ages 26—35 weeks (Brazdeikis et al.,
2004). The general Pan-Tompkins QRS detection scheme (Pan & Tompkins, 1985) consists of
a band-pass filtering stage, a derivative, squaring and windowing stage, and peak detection
and classification stage that matches results from the two previous stages, as illustrated in
Fig. 7. Quantitative analysis of fMCG showed excellent QRS detection performance with
signal pre-processing and parameter tuning.
NewDevelopmentsinBiomedicalEngineering434
Fig. 7. The general Pan-Tompkins QRS detection scheme adapted for fetal
magnetocardiographic signals (Brazdeikis et al., 2004).
When recording fMCG with a second-order gradiometer, the interference from the maternal
heart is almost completely absent due to strong spatial high-pass filtering effect. Any
remaining maternal MCG signals can be reliably removed by following the cross-correlation
procedure illustrated in Fig. 8. In the first step, a classical Pan-Tompkins algorithm was used
to extract the maternal RR time series using a reference ECG signal. In the second step, QRS
complexes were selectively averaged using a template based on the extracted RR time series.
In the final step, the averaged QRS complex was subtracted from the original biomagnetic
signal at each location of the maternal QRS, thereby effectively suppressing maternal MCG.
5. Application of Fetal Magnetocardiography in a Clinical Study
The application presented in this section utilized clinical data that were collected during two
studies of heart rate variability (HRV) at the Texas Medical Center. HRV provides a measure
of autonomic nervous system balance, making it possible to gauge maturation of the
autonomic nervous system.
In the first study, SQUID technology was used to record magnetocardiograms of fetuses
who were 26—35 weeks gestational age. While fMCG recordings are typically done in
magnetically shielded environments, the data collected in this study provided evidence that
it was possible to obtain fMCG signal in various unshielded hospital settings (Padhye et al.,
2004; Verklan et al., 2006; Padhye et al., 2006; Brazdeikis et al., 2007; Padhye et al., 2008). The
fMCG signal had sufficiently high signal-to-noise ratio to permit the automated detection of
QRS complexes in the fetal magnetocardiograms.
Fig. 8. The Pan-Tompkins QRS detection scheme adapted for removing any interfering
maternal signals from fetal magnetocardiograms.
In the second study, electrocardiograms were recorded from prematurely born neonates of
24 to 36 weeks PMA in a neonatal intensive care unit (NICU). The first few minutes of
baseline measurements were obtained while the infants were either asleep or lying quietly.
The neonates were followed longitudinally and spectral powers of HRV in two frequency
bands during the baseline observations were observed to increase as infants matured
(Khattak et al., 2007). The increase in HRV is a reflection of the maturing autonomic nervous
system. HRV is studied in high and low frequency bands in order to separate the effects of
parasympathetic and sympathetic branches of the autonomic nervous system. The question
of interest was to compare differences in characteristics of HRV between the fetuses and
neonates at closely matched PMA.
HRV was explored in two spectral bands for both fetuses and neonates and modeled
statistically to account for the growth of HRV with advancing PMA. Complexity of HRV
was studied with multiscale entropy (Costa et al., 2002), which is a measure of irregularity
of the fetal and neonatal RR-series. Multiscale entropy is the sample entropy (Richman &
Moorman, 2000) at different timescales of the RR-series, with each scale representing a
coarse-graining of the series by that factor. The sample entropy is an inverse logarithmic
measure of the likelihood that pairs of observations that match would continue to match at
the next observation. Lowered levels of multiscale entropy have been found to be an
indicator of fetal distress (Hanqing et al., 2006; Ferrario et al., 2006). Van Leeuwen et al.
(1999) reported a closely related quantity, approximate entropy, in fetuses ranging from 16
to 40 weeks and found an increasing trend with age of the fetus. In adult HRV, multiscale
entropy has been used successfully to distinguish between beat-to-beat series of normal
hearts and those with congestive heart failure and atrial fibrillation (Costa et al., 2002).
BiomagneticMeasurementsforAssessmentofFetalNeuromaturationandWell-Being 435
Fig. 7. The general Pan-Tompkins QRS detection scheme adapted for fetal
magnetocardiographic signals (Brazdeikis et al., 2004).
When recording fMCG with a second-order gradiometer, the interference from the maternal
heart is almost completely absent due to strong spatial high-pass filtering effect. Any
remaining maternal MCG signals can be reliably removed by following the cross-correlation
procedure illustrated in Fig. 8. In the first step, a classical Pan-Tompkins algorithm was used
to extract the maternal RR time series using a reference ECG signal. In the second step, QRS
complexes were selectively averaged using a template based on the extracted RR time series.
In the final step, the averaged QRS complex was subtracted from the original biomagnetic
signal at each location of the maternal QRS, thereby effectively suppressing maternal MCG.
5. Application of Fetal Magnetocardiography in a Clinical Study
The application presented in this section utilized clinical data that were collected during two
studies of heart rate variability (HRV) at the Texas Medical Center. HRV provides a measure
of autonomic nervous system balance, making it possible to gauge maturation of the
autonomic nervous system.
In the first study, SQUID technology was used to record magnetocardiograms of fetuses
who were 26—35 weeks gestational age. While fMCG recordings are typically done in
magnetically shielded environments, the data collected in this study provided evidence that
it was possible to obtain fMCG signal in various unshielded hospital settings (Padhye et al.,
2004; Verklan et al., 2006; Padhye et al., 2006; Brazdeikis et al., 2007; Padhye et al., 2008). The
fMCG signal had sufficiently high signal-to-noise ratio to permit the automated detection of
QRS complexes in the fetal magnetocardiograms.
Fig. 8. The Pan-Tompkins QRS detection scheme adapted for removing any interfering
maternal signals from fetal magnetocardiograms.
In the second study, electrocardiograms were recorded from prematurely born neonates of
24 to 36 weeks PMA in a neonatal intensive care unit (NICU). The first few minutes of
baseline measurements were obtained while the infants were either asleep or lying quietly.
The neonates were followed longitudinally and spectral powers of HRV in two frequency
bands during the baseline observations were observed to increase as infants matured
(Khattak et al., 2007). The increase in HRV is a reflection of the maturing autonomic nervous
system. HRV is studied in high and low frequency bands in order to separate the effects of
parasympathetic and sympathetic branches of the autonomic nervous system. The question
of interest was to compare differences in characteristics of HRV between the fetuses and
neonates at closely matched PMA.
HRV was explored in two spectral bands for both fetuses and neonates and modeled
statistically to account for the growth of HRV with advancing PMA. Complexity of HRV
was studied with multiscale entropy (Costa et al., 2002), which is a measure of irregularity
of the fetal and neonatal RR-series. Multiscale entropy is the sample entropy (Richman &
Moorman, 2000) at different timescales of the RR-series, with each scale representing a
coarse-graining of the series by that factor. The sample entropy is an inverse logarithmic
measure of the likelihood that pairs of observations that match would continue to match at
the next observation. Lowered levels of multiscale entropy have been found to be an
indicator of fetal distress (Hanqing et al., 2006; Ferrario et al., 2006). Van Leeuwen et al.
(1999) reported a closely related quantity, approximate entropy, in fetuses ranging from 16
to 40 weeks and found an increasing trend with age of the fetus. In adult HRV, multiscale
entropy has been used successfully to distinguish between beat-to-beat series of normal
hearts and those with congestive heart failure and atrial fibrillation (Costa et al., 2002).
NewDevelopmentsinBiomedicalEngineering436
Fractal properties of the RR-series include self-similarity, a property by virtue of which the
series appears similar when viewed on different timescales. Self-similarity was quantified
for fetal and neonatal RR-series by means of detrended fluctuation analysis (Peng et al.,
1994; Goldberger et al., 2000). The presence of log-linear scaling of fluctuations with box
sizes provided evidence of self-similar behavior. Two scaling regions were generally present
among the fetuses as well as neonates. The scaling in the region with smallest box sizes is
closely related to the asymptotic spectral exponent.
5.1 Data Collection
Fetal magnetocardiograms were collected at the MSI Center at the Memorial Hermann
Hospital in the Texas Medical Center. Seventeen fMCG recordings were obtained from six
fetuses with PMA ≥ 26 weeks. Two fetuses were studied on more than one occasion and the
rest were one-time observations. All but one of the recordings were in pairs of consecutive
data collection sessions in magnetically shielded and unshielded environments.
As discussed in Section 3, the magnetic signals are largely unaffected by tissue density or
conductance variation but fall rapidly with the distance away from the source. This property
was used advantageously to filter out interferences arising from the maternal heart, muscle
noise, and distant environmental noise sources. A 9-channel SQUID biomagnetometer was
employed with second-order gradiometer pick-up coils (see Section 2) that effectively
suppressed noise from distant sources while enabling the detection of signals from near
sources that generally have stronger gradients at the location of the detector (Brazdeikis et
al., 2003). After careful placement of the sensor array over the gravid abdomen it was
possible to record fetal magnetocardiograms at several spatial locations largely unaffected
by the maternal signal.
Neonatal electrocardiograms were obtained at Children’s Memorial Hermann Hospital
NICU during the course of a prospective cohort study following 35 very low birth weight
(<1500 grams) infants over several weeks after admission to the NICU. The neonates ranged
from 23 to 38 weeks GA with an entry criterion that required GA at birth <30 weeks. A
subset was selected of 33 recordings from 13 infants that were relatively healthy and did not
require mechanical ventilation. The subset included in the analysis ranged from 24 to 36
weeks GA. Electrocardiograms were recorded from study infants while they were resting
for approximately 10 minutes before a blood draw procedure. At the outset, infants were
relaxed, eyes were generally closed, and movements were limited to startles and jaw jerks.
The Institutional Review Board approved all studies.
5.2 Measures of HRV
The fMCG signal was digitized at 1 kHz in each of 9 SQUID channels and signal from the
best channel was selected for further analysis. High-frequency noise, baseline drifts,
artifacts, and occasionally maternal-MCG were removed using standard techniques of
biomagnetic signal processing (see Section 4). The neonatal electrocardiograph signal was
similarly digitized at 1 kHz. The RR-series for HRV analysis was obtained from either type
of signal after implementing a QRS detector using a modified Pan-Tompkins algorithm that
was outlined in Section 4.
The RR-series for each neonatal data set spanned 1000 beats that were part of the baseline
recordings, while the full lengths of the fetal RR-series (average of 690 beats per series) were
utilized. Far outliers were removed using interquartile range boxes with asymmetric
tolerance factors of 3 and 6 on the lower and upper side, respectively, to accommodate
strong, natural variability. On average, 0.27% of data points were deemed far outliers in any
data set, while most sets were not affected by far outliers at all.
Since heartbeats are not equispaced in time, the Lomb periodogram (Lomb, 1976) was
computed after removing slow trends with a cubic polynomial filter. The Lomb algorithm
has some advantages in accuracy of computing the power spectrum for non-uniformly
spaced data points over using the fast Fourier transform on an interpolated uniform grid
(Laguna & Moody, 1998; Chang et al., 2001). Spectra were computed on all available
segments of RR-series with 192 beats in each segment and skipping forward by 96 beats.
Segments had to satisfy a stationarity test that was implemented with the Kolmogorov-
Smirnov test of differences between distributions on sub-segments (Shiavi, 1999). For
inclusion, a segment also had to satisfy the condition that the average Nyquist frequency
exceed 1.0 Hz, which was the upper limit of our high-frequency band. The band powers
were averaged across all segments that passed the criteria. The resulting power spectrum
was integrated in the low-frequency (LF) band from 0.05 to 0.25 Hz and in the high-
frequency (HF) band from 0.25 to 1.00 Hz, and band powers were expressed in decibel units
with respect to a reference level of 0.02 ms
2
.
PMA (weeks)
HF power (dB)
24 26 28 30 32 34 36
15 25 35
N
N
N
N
N
N
N
N
N
N
N
N
N
N
N
N
N
N
N
N
N
N
N
N
N
N
N
N
N
N
N
N
N
F
F
F
F
F
F
F
F
F
F
F
F
F
F
F
F
F
PMA (weeks)
LF power (dB)
24 26 28 30 32 34 36
15 25 35 45
N
N
N
N
N
N
N
N
N
N
N
N
N
N
N
N
N
N
N
N
N
N
N
N
N
N
N
N
N
N
N
N
N
F
F
F
F
F
F
F
F
F
F
F
F
F
F
F
F
F
Fig. 9. Top panel depicts growth of HF power with post-menstrual age, differentiated
between fetal and neonatal groups. Bottom panel depicts growth of LF power with post-
menstrual age. Blue triangles represent fetal observations and red circles are neonatal
observations. The lines are model predictions; in the top panel the upper and lower lines are
for fetuses and neonates, respectively.
BiomagneticMeasurementsforAssessmentofFetalNeuromaturationandWell-Being 437
Fractal properties of the RR-series include self-similarity, a property by virtue of which the
series appears similar when viewed on different timescales. Self-similarity was quantified
for fetal and neonatal RR-series by means of detrended fluctuation analysis (Peng et al.,
1994; Goldberger et al., 2000). The presence of log-linear scaling of fluctuations with box
sizes provided evidence of self-similar behavior. Two scaling regions were generally present
among the fetuses as well as neonates. The scaling in the region with smallest box sizes is
closely related to the asymptotic spectral exponent.
5.1 Data Collection
Fetal magnetocardiograms were collected at the MSI Center at the Memorial Hermann
Hospital in the Texas Medical Center. Seventeen fMCG recordings were obtained from six
fetuses with PMA ≥ 26 weeks. Two fetuses were studied on more than one occasion and the
rest were one-time observations. All but one of the recordings were in pairs of consecutive
data collection sessions in magnetically shielded and unshielded environments.
As discussed in Section 3, the magnetic signals are largely unaffected by tissue density or
conductance variation but fall rapidly with the distance away from the source. This property
was used advantageously to filter out interferences arising from the maternal heart, muscle
noise, and distant environmental noise sources. A 9-channel SQUID biomagnetometer was
employed with second-order gradiometer pick-up coils (see Section 2) that effectively
suppressed noise from distant sources while enabling the detection of signals from near
sources that generally have stronger gradients at the location of the detector (Brazdeikis et
al., 2003). After careful placement of the sensor array over the gravid abdomen it was
possible to record fetal magnetocardiograms at several spatial locations largely unaffected
by the maternal signal.
Neonatal electrocardiograms were obtained at Children’s Memorial Hermann Hospital
NICU during the course of a prospective cohort study following 35 very low birth weight
(<1500 grams) infants over several weeks after admission to the NICU. The neonates ranged
from 23 to 38 weeks GA with an entry criterion that required GA at birth <30 weeks. A
subset was selected of 33 recordings from 13 infants that were relatively healthy and did not
require mechanical ventilation. The subset included in the analysis ranged from 24 to 36
weeks GA. Electrocardiograms were recorded from study infants while they were resting
for approximately 10 minutes before a blood draw procedure. At the outset, infants were
relaxed, eyes were generally closed, and movements were limited to startles and jaw jerks.
The Institutional Review Board approved all studies.
5.2 Measures of HRV
The fMCG signal was digitized at 1 kHz in each of 9 SQUID channels and signal from the
best channel was selected for further analysis. High-frequency noise, baseline drifts,
artifacts, and occasionally maternal-MCG were removed using standard techniques of
biomagnetic signal processing (see Section 4). The neonatal electrocardiograph signal was
similarly digitized at 1 kHz. The RR-series for HRV analysis was obtained from either type
of signal after implementing a QRS detector using a modified Pan-Tompkins algorithm that
was outlined in Section 4.
The RR-series for each neonatal data set spanned 1000 beats that were part of the baseline
recordings, while the full lengths of the fetal RR-series (average of 690 beats per series) were
utilized. Far outliers were removed using interquartile range boxes with asymmetric
tolerance factors of 3 and 6 on the lower and upper side, respectively, to accommodate
strong, natural variability. On average, 0.27% of data points were deemed far outliers in any
data set, while most sets were not affected by far outliers at all.
Since heartbeats are not equispaced in time, the Lomb periodogram (Lomb, 1976) was
computed after removing slow trends with a cubic polynomial filter. The Lomb algorithm
has some advantages in accuracy of computing the power spectrum for non-uniformly
spaced data points over using the fast Fourier transform on an interpolated uniform grid
(Laguna & Moody, 1998; Chang et al., 2001). Spectra were computed on all available
segments of RR-series with 192 beats in each segment and skipping forward by 96 beats.
Segments had to satisfy a stationarity test that was implemented with the Kolmogorov-
Smirnov test of differences between distributions on sub-segments (Shiavi, 1999). For
inclusion, a segment also had to satisfy the condition that the average Nyquist frequency
exceed 1.0 Hz, which was the upper limit of our high-frequency band. The band powers
were averaged across all segments that passed the criteria. The resulting power spectrum
was integrated in the low-frequency (LF) band from 0.05 to 0.25 Hz and in the high-
frequency (HF) band from 0.25 to 1.00 Hz, and band powers were expressed in decibel units
with respect to a reference level of 0.02 ms
2
.
PMA (weeks)
HF power (dB)
24 26 28 30 32 34 36
15 25 35
N
N
N
N
N
N
N
N
N
N
N
N
N
N
N
N
N
N
N
N
N
N
N
N
N
N
N
N
N
N
N
N
N
F
F
F
F
F
F
F
F
F
F
F
F
F
F
F
F
F
PMA (weeks)
LF power (dB)
24 26 28 30 32 34 36
15 25 35 45
N
N
N
N
N
N
N
N
N
N
N
N
N
N
N
N
N
N
N
N
N
N
N
N
N
N
N
N
N
N
N
N
N
F
F
F
F
F
F
F
F
F
F
F
F
F
F
F
F
F
Fig. 9. Top panel depicts growth of HF power with post-menstrual age, differentiated
between fetal and neonatal groups. Bottom panel depicts growth of LF power with post-
menstrual age. Blue triangles represent fetal observations and red circles are neonatal
observations. The lines are model predictions; in the top panel the upper and lower lines are
for fetuses and neonates, respectively.
NewDevelopmentsinBiomedicalEngineering438
At any given scale, the sample entropy was computed for pair-wise matching with tolerance
set at 20% of the standard deviation (Richman & Moorman, 2000). The RR-series was
considered to be a point process for the computation of entropy. A self-similar series must
necessarily be nonstationary. In first-order detrended fluctuation analysis, the signal at any
time is transformed into a signal that has been integrated up to that time instant, ensuring
nonstationarity. Fluctuations around linear trends are then computed for varying box sizes.
If the resulting logarithm of fluctuations varies linearly with the logarithm of box size, there
is evidence of self-similarity. The self-similarity parameter α represents the slope of the
linear relationship. It is closely related to the asymptotic spectral exponent and to the Hurst
exponent. The slopes of log-linear scaling regions of fluctuations were estimated from
regression models. Continuously sliding windows were used in order to minimize
estimation error. Since it is important to have precision in the timescales or box sizes in the
computation of α, the RR-series was uniformly resampled on a grid with 400 ms spacing
between points. The grid spacing corresponds closely to the average RR interval for the
sample.
5.3 Results
Statistical models were constructed for HF and LF band powers to estimate age related
changes and differences between fetal and neonatal HRV with adjustment for age. Robust
regression technique was used in order to minimize impact of any large residuals on the
model parameters (Yohai et al., 1991). All statistical significances were tested at the 95%
confidence level. The HF power increased 0.75 ±0.29 dB per week in both groups, however
the level of HF power was 6.08 ±2.11 dB higher in the fetuses than in the neonates (Fig. 9).
The expected value of fetal HF power at 30 weeks PMA was 29.16 ±1.80 dB. The LF power
increased 1.40 ±0.27 dB per week in fetuses and neonates, but there was neither a significant
difference in the LF power levels nor in the rates of growth between the two groups. The
expected value of fetal as well as neonatal LF power at 30 weeks PMA was 29.62 ±0.87 dB.
The expectation value of the mean RR-interval at 30 weeks PMA was 406.7 ±8.6 ms for a
fetus and 13.0 ±3.3 ms lower for a neonate. The mean RR-interval increased by 9.2 ±3.0 ms
per week for the fetal group, whereas it declined slightly for the neonates over the age range
of the study. The mean heart rate is inversely related to the mean RR-interval.
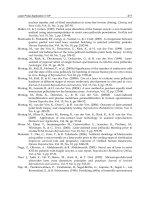
Estimates of multiscale entropy are progressively less reliable at higher scales. The
constraint of series length capped the highest scale at 7. Sample entropy was higher in the
fetuses at all scales, as shown in Fig. 10. Statistical models showed differences of 0.24—0.30,
with mean difference of 0.28. Age-dependent changes in the entropy were not detected at
any scale. There was no apparent effect of the magnetic environment, shielded or
unshielded, on the shape of the multiscale entropy curves, suggesting that fMCG recordings
obtained in unshielded settings are suitable for FHRV studies. The multiscale entropy of a
26 week old fetus showed high entropy at scale 1 and dropped thereafter. This is similar to
the relationship of entropy to scale in adults with atrial fibrillation (Costa et al., 2002). The
relationship of entropy to scale is reversed in the fetuses 30 weeks GA or older, and
resembles that of normal adults (Fig. 11).
1 2 3 4 5 6 7
Scale
0.0
0.5
1.0
1.5
Sample Entropy
Neonate
Fetus
Fig. 10. Average fetal and neonatal entropy vs. scale of RR-series.
Fluctuations scaled linearly with box size on a log-log plot in both fetuses and neonates,
indicating the presence of self-similar behavior of the RR-series (Fig. 12). There were
typically 2 regions of linear scaling, one at box sizes below 25 (corresponds to timescales
below 10 s) and a region with reduced slope of scaling at box sizes between 50 and 100
(corresponding to timescales between 20 and 40 s). This is in agreement with findings from
studies of other fractal properties of fetal HRV (Felgueiras et al., 1998; Kikuchi et al., 2005).
Spectral exponents were estimated from the scaling exponent at the fast timescales. The
spectral exponent β represents the asymptotic slope of the power spectrum (1/f
β
). The
exponent ranged between 1.3 and 2.6, with a tendency for neonates to exhibit a level that
was nearly constant in the age range of the study, while the younger fetuses had a tendency
toward lower spectral exponents. The middle 50% of all exponents were distributed in a
narrow band around 2.0, from 1.9 to 2.1.
5.4 Implications
Cardiovascular variance in the HF band is closely related to respiration largely due to the
shared control mechanism of the vagus nerve that is part of the parasympathetic nervous
system. The decreased level of HRV in neonates in the HF band suggests that the
sympathetic/parasympathetic balance of their autonomic nervous system is distinct from
that of fetuses at identical post-menstrual ages. It is hypothesized that the physiological
stresses of prematurity suppress the activity of the parasympathetic nervous system. Even
the healthy “feeder-grower” premature neonate is encumbered with independent
respiration and additional metabolic tasks that the fetus is not required to perform. It may
be that growth of many systems, including the nervous system, becomes secondary to
processes necessary for survival.
BiomagneticMeasurementsforAssessmentofFetalNeuromaturationandWell-Being 439
At any given scale, the sample entropy was computed for pair-wise matching with tolerance
set at 20% of the standard deviation (Richman & Moorman, 2000). The RR-series was
considered to be a point process for the computation of entropy. A self-similar series must
necessarily be nonstationary. In first-order detrended fluctuation analysis, the signal at any
time is transformed into a signal that has been integrated up to that time instant, ensuring
nonstationarity. Fluctuations around linear trends are then computed for varying box sizes.
If the resulting logarithm of fluctuations varies linearly with the logarithm of box size, there
is evidence of self-similarity. The self-similarity parameter α represents the slope of the
linear relationship. It is closely related to the asymptotic spectral exponent and to the Hurst
exponent. The slopes of log-linear scaling regions of fluctuations were estimated from
regression models. Continuously sliding windows were used in order to minimize
estimation error. Since it is important to have precision in the timescales or box sizes in the
computation of α, the RR-series was uniformly resampled on a grid with 400 ms spacing
between points. The grid spacing corresponds closely to the average RR interval for the
sample.
5.3 Results
Statistical models were constructed for HF and LF band powers to estimate age related
changes and differences between fetal and neonatal HRV with adjustment for age. Robust
regression technique was used in order to minimize impact of any large residuals on the
model parameters (Yohai et al., 1991). All statistical significances were tested at the 95%
confidence level. The HF power increased 0.75 ±0.29 dB per week in both groups, however
the level of HF power was 6.08 ±2.11 dB higher in the fetuses than in the neonates (Fig. 9).
The expected value of fetal HF power at 30 weeks PMA was 29.16 ±1.80 dB. The LF power
increased 1.40 ±0.27 dB per week in fetuses and neonates, but there was neither a significant
difference in the LF power levels nor in the rates of growth between the two groups. The
expected value of fetal as well as neonatal LF power at 30 weeks PMA was 29.62 ±0.87 dB.
The expectation value of the mean RR-interval at 30 weeks PMA was 406.7 ±8.6 ms for a
fetus and 13.0 ±3.3 ms lower for a neonate. The mean RR-interval increased by 9.2 ±3.0 ms
per week for the fetal group, whereas it declined slightly for the neonates over the age range
of the study. The mean heart rate is inversely related to the mean RR-interval.
Estimates of multiscale entropy are progressively less reliable at higher scales. The
constraint of series length capped the highest scale at 7. Sample entropy was higher in the
fetuses at all scales, as shown in Fig. 10. Statistical models showed differences of 0.24—0.30,
with mean difference of 0.28. Age-dependent changes in the entropy were not detected at
any scale. There was no apparent effect of the magnetic environment, shielded or
unshielded, on the shape of the multiscale entropy curves, suggesting that fMCG recordings
obtained in unshielded settings are suitable for FHRV studies. The multiscale entropy of a
26 week old fetus showed high entropy at scale 1 and dropped thereafter. This is similar to
the relationship of entropy to scale in adults with atrial fibrillation (Costa et al., 2002). The
relationship of entropy to scale is reversed in the fetuses 30 weeks GA or older, and
resembles that of normal adults (Fig. 11).
1 2 3 4 5 6 7
Scale
0.0
0.5
1.0
1.5
Sample Entropy
Neonate
Fetus
Fig. 10. Average fetal and neonatal entropy vs. scale of RR-series.
Fluctuations scaled linearly with box size on a log-log plot in both fetuses and neonates,
indicating the presence of self-similar behavior of the RR-series (Fig. 12). There were
typically 2 regions of linear scaling, one at box sizes below 25 (corresponds to timescales
below 10 s) and a region with reduced slope of scaling at box sizes between 50 and 100
(corresponding to timescales between 20 and 40 s). This is in agreement with findings from
studies of other fractal properties of fetal HRV (Felgueiras et al., 1998; Kikuchi et al., 2005).
Spectral exponents were estimated from the scaling exponent at the fast timescales. The
spectral exponent β represents the asymptotic slope of the power spectrum (1/f
β
). The
exponent ranged between 1.3 and 2.6, with a tendency for neonates to exhibit a level that
was nearly constant in the age range of the study, while the younger fetuses had a tendency
toward lower spectral exponents. The middle 50% of all exponents were distributed in a
narrow band around 2.0, from 1.9 to 2.1.
5.4 Implications
Cardiovascular variance in the HF band is closely related to respiration largely due to the
shared control mechanism of the vagus nerve that is part of the parasympathetic nervous
system. The decreased level of HRV in neonates in the HF band suggests that the
sympathetic/parasympathetic balance of their autonomic nervous system is distinct from
that of fetuses at identical post-menstrual ages. It is hypothesized that the physiological
stresses of prematurity suppress the activity of the parasympathetic nervous system. Even
the healthy “feeder-grower” premature neonate is encumbered with independent
respiration and additional metabolic tasks that the fetus is not required to perform. It may
be that growth of many systems, including the nervous system, becomes secondary to
processes necessary for survival.
NewDevelopmentsinBiomedicalEngineering440
1 2 3 4 5 6 7
Scale
0.0
0.5
1.0
1.5
2.0
Sample Entropy
32 week fetus
26 week fetus
Fig. 11. Multiscale entropy of the heart rate variability of a 26-week fetus and a 32-week
fetus show a reversal of relationship between entropy and scale.
The increasing trend of HRV in HF and LF bands in both fetuses and neonates reflects the
maturation of parasympathetic and sympathetic nervous systems. The absence of a
significant difference in the LF variance between neonates and fetuses suggests that the
sympathetic fight-or-flight response is equally well-developed in the two groups.
Entropy of fetal RR-series was higher than the entropy of neonatal RR-series at all scales,
which suggests that fetal HRV is more complex and non-repeating than its neonatal
counterpart of the same PMA. We investigated the possibility of systematic bias in
estimation of entropy due to greater length of the neonatal RR-series, and concluded that
stability of estimation was sufficient to discount this possibility. Given the paradigm in the
science of complex systems that higher levels of complexity are associated with healthier
physiological systems (Goldberger et al., 2002), this may be another indicator that fetal HRV
is in a more healthy state than HRV of the prematurely born neonate.
Two regions of scaling were present in the RR-series fluctuations, and there was no
discernible difference of scaling regions between fetuses and neonates. Spectral exponents
for neonates and fetuses were distributed around the value 2.0, which corresponds to the
spectral exponent of a normal diffusion process. This represents a lower level of complexity
compared to HRV in healthy adults that exhibits spectral exponents closer to 1 (Yamamoto
& Hughson, 1994). The observed tendencies were for the neonates to have a higher spectral
exponent that was steady, while the exponent increased in fetuses with advancing age.
However, robust statistical models could not establish the increasing trend in fetuses at the
95% confidence level. Age-related changes in the scaling exponent were not detected in a
larger study of fetal HRV (Lange et al., 2005) suggesting that relative constancy of the
spectral exponent may be a property that is shared by fetuses and prematurely born
neonates.
0.45 0.70 0.95 1.20 1.45 1.70 1.95 2.20
log(n)
-0.1
0.4
0.9
1.4
1.9
log(F(n))
Neonate
Fetus
Fig. 12. Fluctuations vs. box size on a log-log scale shows linear relationship below timescale
of 10 seconds. Curves represent averages over groups of neonates and fetuses.
The relationship of entropy to scale reversed in observations of fetuses at 26 weeks and 30
weeks gestational age, which may be indicative of a critical stage of maturation in the
autonomic nervous system that controls their heart rate variability. This pilot study is
limited by the sample size. More data is required, especially for fetuses younger than 30
weeks gestational age, before a more confident conclusion can be drawn. Spectral as well as
complexity measures were computed from recordings in the unshielded environment that
did not differ appreciably from corresponding measures computed from recordings in
magnetically shielded rooms.
6. Conclusion
Fetal magnetocardiography offers direct evaluation of the electrophysiological properties of
the fetal heart from an early stage of fetal development. It offers potentially more accurate
examination of beat-to-beat intervals than does fetal ultrasound or fetal ECG. At present its
wide clinical adoption is limited since it requires expensive magnetically shielded rooms.
Recent successes in recording fetal magnetocardiograms with relatively small systems
outside the shielded environment are a promising development. Application of the technical
and computational tools was illustrated in a clinical study that compared spectral and
complexity properties of heart rate variability in fetuses and age-matched, prematurely born
neonates. Future work in fetal magnetocardiography is likely to focus on development of
technology that is affordable for wide clinical deployment at the bedside and that is
supported by diagnostics of fetal neuromaturation and stress based on measures of heart
rate variability.
BiomagneticMeasurementsforAssessmentofFetalNeuromaturationandWell-Being 441
1 2 3 4 5 6 7
Scale
0.0
0.5
1.0
1.5
2.0
Sample Entropy
32 week fetus
26 week fetus
Fig. 11. Multiscale entropy of the heart rate variability of a 26-week fetus and a 32-week
fetus show a reversal of relationship between entropy and scale.
The increasing trend of HRV in HF and LF bands in both fetuses and neonates reflects the
maturation of parasympathetic and sympathetic nervous systems. The absence of a
significant difference in the LF variance between neonates and fetuses suggests that the
sympathetic fight-or-flight response is equally well-developed in the two groups.
Entropy of fetal RR-series was higher than the entropy of neonatal RR-series at all scales,
which suggests that fetal HRV is more complex and non-repeating than its neonatal
counterpart of the same PMA. We investigated the possibility of systematic bias in
estimation of entropy due to greater length of the neonatal RR-series, and concluded that
stability of estimation was sufficient to discount this possibility. Given the paradigm in the
science of complex systems that higher levels of complexity are associated with healthier
physiological systems (Goldberger et al., 2002), this may be another indicator that fetal HRV
is in a more healthy state than HRV of the prematurely born neonate.
Two regions of scaling were present in the RR-series fluctuations, and there was no
discernible difference of scaling regions between fetuses and neonates. Spectral exponents
for neonates and fetuses were distributed around the value 2.0, which corresponds to the
spectral exponent of a normal diffusion process. This represents a lower level of complexity
compared to HRV in healthy adults that exhibits spectral exponents closer to 1 (Yamamoto
& Hughson, 1994). The observed tendencies were for the neonates to have a higher spectral
exponent that was steady, while the exponent increased in fetuses with advancing age.
However, robust statistical models could not establish the increasing trend in fetuses at the
95% confidence level. Age-related changes in the scaling exponent were not detected in a
larger study of fetal HRV (Lange et al., 2005) suggesting that relative constancy of the
spectral exponent may be a property that is shared by fetuses and prematurely born
neonates.
0.45 0.70 0.95 1.20 1.45 1.70 1.95 2.20
log(n)
-0.1
0.4
0.9
1.4
1.9
log(F(n))
Neonate
Fetus
Fig. 12. Fluctuations vs. box size on a log-log scale shows linear relationship below timescale
of 10 seconds. Curves represent averages over groups of neonates and fetuses.
The relationship of entropy to scale reversed in observations of fetuses at 26 weeks and 30
weeks gestational age, which may be indicative of a critical stage of maturation in the
autonomic nervous system that controls their heart rate variability. This pilot study is
limited by the sample size. More data is required, especially for fetuses younger than 30
weeks gestational age, before a more confident conclusion can be drawn. Spectral as well as
complexity measures were computed from recordings in the unshielded environment that
did not differ appreciably from corresponding measures computed from recordings in
magnetically shielded rooms.
6. Conclusion
Fetal magnetocardiography offers direct evaluation of the electrophysiological properties of
the fetal heart from an early stage of fetal development. It offers potentially more accurate
examination of beat-to-beat intervals than does fetal ultrasound or fetal ECG. At present its
wide clinical adoption is limited since it requires expensive magnetically shielded rooms.
Recent successes in recording fetal magnetocardiograms with relatively small systems
outside the shielded environment are a promising development. Application of the technical
and computational tools was illustrated in a clinical study that compared spectral and
complexity properties of heart rate variability in fetuses and age-matched, prematurely born
neonates. Future work in fetal magnetocardiography is likely to focus on development of
technology that is affordable for wide clinical deployment at the bedside and that is
supported by diagnostics of fetal neuromaturation and stress based on measures of heart
rate variability.
NewDevelopmentsinBiomedicalEngineering442
7. References
Brazdeikis, A.; Xue, Y. Y. & Chu, C. W. (2003). Non-invasive assessment of the heart
function in unshielded clinical environment by SQUID gradiometry. IEEE Trans.
Appl. Supercond., 13, pp 385-388
Brazdeikis, A.; Guzeldere, A. K.; Padhye, N. S. & Verklan, M. T. (2004). Evaluation of the
performance of a QRS detector for extracting the heart interbeat RR time series
from fetal magnetocardiography recordings, Proc. 26th Ann. Intl. Conf. IEEE Eng. in
Med. and Biol. Soc., pp. 369–372, San Francisco, CA, USA
Brazdeikis, A.; Vázquez-Flores, G. J.; Tan, I. C.; Padhye, N. S. & Verklan, M. T. (2007).
Acquisition of fetal magnetocardiograms in an unshielded hospital setting. IEEE
Transactions on Applied Superconductivity, 17, 2, pp. 823-826
Brisinda, D.; Comani, S.; Meloni, A. M.; Alleva, G.; Mantini, D. & Fenici, R. (2005).
Multichannel mapping of fetal magnetocardiogram in an unshielded hospital
setting. Prenatal Diagnosis, 25, pp. 376-382
Chang, F. M.; Hsu, K. F.; Ko, H. C.; Yao, B. L.; Chang, C. H.; Yu, C. H.; Liang, R. I. & Chen,
H. Y. (1997). Fetal heart volume assessment by three-dimensional ultrasound.
Ultrasound. Obstet. Gynecol., 9, pp. 42-48
Chang, K. L.; Monahan, K. J.; Griffin, M. P.; Lake, D. & Moorman, J. R. (2001). Comparison
and clinical application of frequency domain methods in analysis of neonatal heart
rate time series. Ann. Biomed. Eng., 29, pp. 764-774
Comani, S.; Mantini, D.; Alleva, G.; Di Luzio, S. & Romani, G. L. (2004). Fetal
magnetocardiographic mapping using independent component analysis. Physiol.
Meas., 25, 6, pp. 1459–1472
Costa, M.; Goldberger, A. L. & Peng, C. K. (2002). Multiscale entropy analysis of complex
physiologic time series. Phys. Rev. Lett., 89, 068102
De Araujo, D. B.; Barros, A. K.; Estombelo-Montesco, C.; Zhao, H.; da Silva Filho, A. C.;
Baffa, O.; Wakai, R.; Ohnishi, N. (2005). Fetal source extraction from
magnetocardiographic recordings by dependent component analysis. Phys. Med.
Biol., 50, 19, pp. 4457-4464
Drung, D. & Mück, M. (2004). SQUID electronics, In: The SQUID Handbook, Clarke, J. &
Braginski, A. I. (Eds.), pp. 127-170, Wiley-VCH
Fagaly, R. L. (2006). Superconducting quantum interference device instruments and
applications. Rev. Sci. Instrum., 77, 101101-45
Felgueiras, C. S.; de Sa´ Marques, J. P.; Bernardes, J. & Gama, S. (1998). Classification of
foetal heart rate sequences based on fractal features. Med. Biol. Eng. Comput., 36, pp.
197–201
Ferrario, M.; Signorini, M. G.; Magenes, G. & Cerutti, S. (2006). Comparison of entropy-
based regularity estimators: Application to the fetal heart rate signal for the
identification of fetal distress. IEEE Transactions on Biomedical Engineering, 53, pp.
119-125
Friesen, G. M.; Jannett, T. C.; Jadallah, M. A.; Yates, S. L.; Quint, S. R. & Nagle, H. T. (1990).
A comparison of the noise sensitivity of nine QRS detection algorithms. IEEE Trans.
Biomed. Eng., 37, pp. 85–98
Goldberger, A. L.; Amaral, L. A. N.; Glass, L.; Hausdorff, J. M.; Ivanov, P. C.; Mark, R. G.;
Mietus, J. E.; Moody, G. B.; Peng, C. K. & Stanley, H. E. (2000). PhysioBank,
PhysioToolkit, and PhysioNet: Components of a new research resource for complex
physiologic signals. Circulation, 101, 23, pp. e215-e220 [Circulation Electronic Pages;
Goldberger, A. L.; Peng, C. K. & Lipsitz, L. A. (2002). What is physiologic complexity and
how does it change with aging and disease? Neurobiol. Aging, 23, pp. 23-26
Hanqing, C.; Lake, D. E.; Ferguson, J. E.; Chisholm, C. A.; Griffin, M. P. & Moorman, J. R.
(2006). Toward quantitative fetal heart rate monitoring. IEEE Transactions on
Biomedical Engineering, 53, pp. 111-118
Hild, K. E.; Alleva, G.; Nagarajan, S. & Comani, S. (2007a). Performance comparison of six
independent components analysis algorithms for fetal signal extraction from real
fMCG data. Phys. Med. Biol., 52, pp. 449-462
Hild, K. E.; Attias, H. T.; Comani, S. & Nagarajan, S. S. (2007b). Fetal cardiac signal
extraction from magnetocardiographic data using a probabilistic algorithm. Signal
Proc., 87, pp. 1993–2004
Horigome, H.; Ogata, K.; Kandori, A.; Miyashita, T.; Takahashi-Igari, M.; Chen, Y. J.;
Hamada, H. & Tsukada, K. (2006). Standardization of the PQRST waveform and
analysis of arrhythmias in the fetus using vector magnetocardiography. Pediatr.
Res., 59, pp. 121-125
Kandori, A.; Miyashita, T.; Tsukada, K.; Horigome, H.; Asaka, M.; Shigemitsu, S.; Takahashi,
M. I.; Terada, Y. & Mitsui, T. (1999a). Sensitivity of foetal magnetocardiograms
versus gestation week. Med. Biol. Eng. Comput., 37, pp. 545-548
Kandori, A.; Miyashita, T.; Tsukada, K.; Horigome, H.; Asaka, M.; Shigemitsu, S.; Takahashi,
M.; Terada, Y.; Mitsui, T. & Chiba, Y. (1999b). A vector fetal magnetocardiogram
system with high sensitivity. Rev. Sci. Instrum., 70, pp. 4702-4705
Khattak, A. Z.; Padhye, N. S.; Williams, A. L.; Lasky, R. E.; Moya, F. R. & Verklan, M. T.
(2007). Longitudinal assessment of heart rate variability in very low birth weight
infants during their NICU stay. Early Hum. Dev., 83, pp. 361-366
Kikuchi, A.; Unno, N.; Horikoshi, T.; Shimizu, T.; Kozuma, S. & Taketani, Y. (2005). Changes
in fractal features of fetal heart rate during pregnancy. Early Hum. Dev., 81, pp. 655-
661
Köhler, B U.; Hennig, C. & Orglmeister, R. (2002). The principles of software QRS detection.
IEEE Eng. Med. Biol. Mag., 21, pp. 42–57
Koch, R. H.; Rozen, J. R.; Sun, J. Z. & Gallagher, W. J. (1993). Three SQUID gradiometer.
Appl. Phys. Lett., 63, pp. 403–405
Laguna, P. & Moody, G. B. (1998). Power spectral density of unevenly sampled data by
least-square analysis: Performance and application to heart rate signals. IEEE Trans.
Biomed. Eng., 45, pp. 698-715
Lange, S.; Van Leeuwen, P.; Geue, D.; Cysarz, D. & Grönemeyer, D. (2005). Application of
DFA in fetal heart rate variability. Biomedizinsiche Technik, 50, suppl. 1, pp. 1481-
1482
Lomb, N. R. (1976). Least-squares frequency analysis of unequally spaced data. Astrophys.
and Space Sci., 39, pp. 447-462
Matlashov, A.; Zhuravlev, Y.; Lipovich, A.; Alexandrov, A.; Mazaev, E.; Slobodchikov, V. &
Washiewski, O. (1989). Electronic noise suppression in multi-channel
neuromagnetic system, In: Advances in Biomagnetism, Williamson, S. J.; Hoke, M.;
Stroink, G. & Kotani, M. (Eds.), pp. 7725–7728, Plenum Press, New York
BiomagneticMeasurementsforAssessmentofFetalNeuromaturationandWell-Being 443
7. References
Brazdeikis, A.; Xue, Y. Y. & Chu, C. W. (2003). Non-invasive assessment of the heart
function in unshielded clinical environment by SQUID gradiometry. IEEE Trans.
Appl. Supercond., 13, pp 385-388
Brazdeikis, A.; Guzeldere, A. K.; Padhye, N. S. & Verklan, M. T. (2004). Evaluation of the
performance of a QRS detector for extracting the heart interbeat RR time series
from fetal magnetocardiography recordings, Proc. 26th Ann. Intl. Conf. IEEE Eng. in
Med. and Biol. Soc., pp. 369–372, San Francisco, CA, USA
Brazdeikis, A.; Vázquez-Flores, G. J.; Tan, I. C.; Padhye, N. S. & Verklan, M. T. (2007).
Acquisition of fetal magnetocardiograms in an unshielded hospital setting. IEEE
Transactions on Applied Superconductivity, 17, 2, pp. 823-826
Brisinda, D.; Comani, S.; Meloni, A. M.; Alleva, G.; Mantini, D. & Fenici, R. (2005).
Multichannel mapping of fetal magnetocardiogram in an unshielded hospital
setting. Prenatal Diagnosis, 25, pp. 376-382
Chang, F. M.; Hsu, K. F.; Ko, H. C.; Yao, B. L.; Chang, C. H.; Yu, C. H.; Liang, R. I. & Chen,
H. Y. (1997). Fetal heart volume assessment by three-dimensional ultrasound.
Ultrasound. Obstet. Gynecol., 9, pp. 42-48
Chang, K. L.; Monahan, K. J.; Griffin, M. P.; Lake, D. & Moorman, J. R. (2001). Comparison
and clinical application of frequency domain methods in analysis of neonatal heart
rate time series. Ann. Biomed. Eng., 29, pp. 764-774
Comani, S.; Mantini, D.; Alleva, G.; Di Luzio, S. & Romani, G. L. (2004). Fetal
magnetocardiographic mapping using independent component analysis. Physiol.
Meas., 25, 6, pp. 1459–1472
Costa, M.; Goldberger, A. L. & Peng, C. K. (2002). Multiscale entropy analysis of complex
physiologic time series. Phys. Rev. Lett., 89, 068102
De Araujo, D. B.; Barros, A. K.; Estombelo-Montesco, C.; Zhao, H.; da Silva Filho, A. C.;
Baffa, O.; Wakai, R.; Ohnishi, N. (2005). Fetal source extraction from
magnetocardiographic recordings by dependent component analysis. Phys. Med.
Biol., 50, 19, pp. 4457-4464
Drung, D. & Mück, M. (2004). SQUID electronics, In: The SQUID Handbook, Clarke, J. &
Braginski, A. I. (Eds.), pp. 127-170, Wiley-VCH
Fagaly, R. L. (2006). Superconducting quantum interference device instruments and
applications. Rev. Sci. Instrum., 77, 101101-45
Felgueiras, C. S.; de Sa´ Marques, J. P.; Bernardes, J. & Gama, S. (1998). Classification of
foetal heart rate sequences based on fractal features. Med. Biol. Eng. Comput., 36, pp.
197–201
Ferrario, M.; Signorini, M. G.; Magenes, G. & Cerutti, S. (2006). Comparison of entropy-
based regularity estimators: Application to the fetal heart rate signal for the
identification of fetal distress. IEEE Transactions on Biomedical Engineering, 53, pp.
119-125
Friesen, G. M.; Jannett, T. C.; Jadallah, M. A.; Yates, S. L.; Quint, S. R. & Nagle, H. T. (1990).
A comparison of the noise sensitivity of nine QRS detection algorithms. IEEE Trans.
Biomed. Eng., 37, pp. 85–98
Goldberger, A. L.; Amaral, L. A. N.; Glass, L.; Hausdorff, J. M.; Ivanov, P. C.; Mark, R. G.;
Mietus, J. E.; Moody, G. B.; Peng, C. K. & Stanley, H. E. (2000). PhysioBank,
PhysioToolkit, and PhysioNet: Components of a new research resource for complex
physiologic signals. Circulation, 101, 23, pp. e215-e220 [Circulation Electronic Pages;
Goldberger, A. L.; Peng, C. K. & Lipsitz, L. A. (2002). What is physiologic complexity and
how does it change with aging and disease? Neurobiol. Aging, 23, pp. 23-26
Hanqing, C.; Lake, D. E.; Ferguson, J. E.; Chisholm, C. A.; Griffin, M. P. & Moorman, J. R.
(2006). Toward quantitative fetal heart rate monitoring. IEEE Transactions on
Biomedical Engineering, 53, pp. 111-118
Hild, K. E.; Alleva, G.; Nagarajan, S. & Comani, S. (2007a). Performance comparison of six
independent components analysis algorithms for fetal signal extraction from real
fMCG data. Phys. Med. Biol., 52, pp. 449-462
Hild, K. E.; Attias, H. T.; Comani, S. & Nagarajan, S. S. (2007b). Fetal cardiac signal
extraction from magnetocardiographic data using a probabilistic algorithm. Signal
Proc., 87, pp. 1993–2004
Horigome, H.; Ogata, K.; Kandori, A.; Miyashita, T.; Takahashi-Igari, M.; Chen, Y. J.;
Hamada, H. & Tsukada, K. (2006). Standardization of the PQRST waveform and
analysis of arrhythmias in the fetus using vector magnetocardiography. Pediatr.
Res., 59, pp. 121-125
Kandori, A.; Miyashita, T.; Tsukada, K.; Horigome, H.; Asaka, M.; Shigemitsu, S.; Takahashi,
M. I.; Terada, Y. & Mitsui, T. (1999a). Sensitivity of foetal magnetocardiograms
versus gestation week. Med. Biol. Eng. Comput., 37, pp. 545-548
Kandori, A.; Miyashita, T.; Tsukada, K.; Horigome, H.; Asaka, M.; Shigemitsu, S.; Takahashi,
M.; Terada, Y.; Mitsui, T. & Chiba, Y. (1999b). A vector fetal magnetocardiogram
system with high sensitivity. Rev. Sci. Instrum., 70, pp. 4702-4705
Khattak, A. Z.; Padhye, N. S.; Williams, A. L.; Lasky, R. E.; Moya, F. R. & Verklan, M. T.
(2007). Longitudinal assessment of heart rate variability in very low birth weight
infants during their NICU stay. Early Hum. Dev., 83, pp. 361-366
Kikuchi, A.; Unno, N.; Horikoshi, T.; Shimizu, T.; Kozuma, S. & Taketani, Y. (2005). Changes
in fractal features of fetal heart rate during pregnancy. Early Hum. Dev., 81, pp. 655-
661
Köhler, B U.; Hennig, C. & Orglmeister, R. (2002). The principles of software QRS detection.
IEEE Eng. Med. Biol. Mag., 21, pp. 42–57
Koch, R. H.; Rozen, J. R.; Sun, J. Z. & Gallagher, W. J. (1993). Three SQUID gradiometer.
Appl. Phys. Lett., 63, pp. 403–405
Laguna, P. & Moody, G. B. (1998). Power spectral density of unevenly sampled data by
least-square analysis: Performance and application to heart rate signals. IEEE Trans.
Biomed. Eng., 45, pp. 698-715
Lange, S.; Van Leeuwen, P.; Geue, D.; Cysarz, D. & Grönemeyer, D. (2005). Application of
DFA in fetal heart rate variability. Biomedizinsiche Technik, 50, suppl. 1, pp. 1481-
1482
Lomb, N. R. (1976). Least-squares frequency analysis of unequally spaced data. Astrophys.
and Space Sci., 39, pp. 447-462
Matlashov, A.; Zhuravlev, Y.; Lipovich, A.; Alexandrov, A.; Mazaev, E.; Slobodchikov, V. &
Washiewski, O. (1989). Electronic noise suppression in multi-channel
neuromagnetic system, In: Advances in Biomagnetism, Williamson, S. J.; Hoke, M.;
Stroink, G. & Kotani, M. (Eds.), pp. 7725–7728, Plenum Press, New York
NewDevelopmentsinBiomedicalEngineering444
Mosher, J. C.; Flynn, E. R.; Quinn, A.; Weir, A.; Shahani, U.; Bain, R. J. P.; Maas, P. &
Donaldson, G. B. (1997). Fetal magnetocardiography: methods for rapid data
reduction. Rev. Sci. Instrum., 68, pp. 1587-1595
Neonen, J.; Montonen, J. & Katila, T. (1996). Thermal noise in biogmagnetic measurements.
Rev. Sci. Instrum., 67, pp. 2397-2405
Osei, E. K. & Faulkner, K. (1999). Fetal position and size data for dose estimation. Br. J.
Radiol., 72, pp. 363-370
Padhye, N. S.; Brazdeikis, A. & Verklan, M. T. (2004). Monitoring fetal development with
magnetocardiography, Proc. 26th Ann. Intl. Conf. IEEE Eng. in Med. and Biol. Soc., pp.
3609–3610, San Francisco, CA, USA
Padhye, N. S.; Brazdeikis, A. & Verklan, M. T. (2006). Change in complexity of fetal heart
rate variability, Proc. 28th Ann. Intl Conf. IEEE Eng. in Med. and Biol. Soc., pp. 1796–
1798, New York City, NY, USA
Padhye, N. S.; Verklan, M. T.; Brazdeikis, A.; Williams, A. L.; Khattak, A. Z. & Lasky, R. E.
(2008). A comparison of fetal and neonatal heart rate variability at similar post-
menstrual ages, Proc. 30th Ann. Intl Conf. IEEE Eng. in Med. and Biol. Soc., pp. 2801–
2804, Vancouver, BC, Canada
Pan J. & Tompkins, W. J. (1985). A real-time QRS detection algorithm. IEEE Trans. Biomed.
Eng., 32, pp. 230-236
Peng, C. K.; Buldyrev, S. V.; Havlin, S.; Simons, M.; Stanley, H. E. & Goldberger, A. L. (1994).
Mosaic organization of DNA nucleotides. Phys. Rev. E, 49, pp. 1685-1689
Richman, J. S. & Moorman, J. R. (2000). Physiologic time series analysis using approximate
entropy and sample entropy. Am. J. Physiol., 278, pp. 2039-2049
Sarvas, J. (1987). Basic mathematical and electromagnetic concepts of the biomagnetic
inverse problem. Phys. Med. Biol., 32, pp. 11-22
Scheer, K. & Nubar, J. (1976). Variation of fetal presentation with gestational age. Am. J.
Obstet. Gynecol., 125, pp. 269-270
Shiavi, R. (1999). Introduction to applied statistical signal analysis, 2nd ed., Academic Press, San
Diego
Sternickel, K. & Braginski, A. I. (2006). Biomagnetism using SQUIDs: status and
perspectives. Supercond. Sci. Technol., 19, pp. S160-S171
Stolz, R.; Bondarenko, N.; Zakosarenko, V.; Schulz, M. & Meyer, H. G. (2003). Integrated
gradiometer-SQUID system for fetal magneto-cardiography without magnetic
shielding. Superconductivity Science Technologies, 16, pp. 1523-1527
Tinkham, M. (1996). Introduction to Superconductivity, McGraw-Hill, New York
Uzunbajakau, S. A.; Rijpma, A. P.; ter Brake, H. J. M. & Peters, M. J. (2005). Optimization of a
third-order gradiometer for operation in unshielded environments. IEEE Trans.
Appl. Supercond., 15, pp. 3879-3885
Van Leeuwen, P.; Lange, S.; Bettermann, H.; Grönemeyer, D. & Hatzmann, W. (1999). Fetal
heart rate variability and complexity in the course of pregnancy. Early Hum. Dev.,
54, pp. 259-269
Van Leeuwen, P.; Cysarz, D.; Lange, S. & Geue, D. (2007). Quantification of fetal heart rate
regularity using symbolic dynamics. Chaos, 17, 015119-9
Van Leeuwen, P.; Geue, D.; Lange, S. & Groenemeyer, D. (2009). Analysis of fetal movement
based on magnetocardiographically determined fetal actograms and fetal heart rate
accelerations, In: ECIFMBE 2008, IFMBE Proceedings Vol. 22, Vander Sloten, J.;
Verdonck, P.; Nyssen, M. & Haueisen, J. (Eds.), pp. 1386-1389, Springer, Berlin
Vázquez-Flores, G. J. (2007). A realistic biomagnetic model for optimized acquisition of fetal
magnetocardiograms in unshielded clinical settings, Thesis, University of Houston
Verklan, M. T.; Padhye, N. S. & Brazdeikis, A. (2006). Analysis of fetal heart rate variability
obtained by magnetocardiography. J. Perinat. Neonat. Nurs., 20, pp. 343-348
Vrba, J. (1996). SQUID gradiometers in real environments, In: SQUID Sensors: Fundamentals,
Fabrication and Applications, Weinstock, H. (Ed.), pp. 117-178, Kluwer Academic
Publishers, Dordrecht
Vrba, J. (2000). Multichannel SQUID biomagnetic systems, In: Applications of
Superconductivity, Weinstock, H. (Ed.), pp. 61-138, Kluwer Academic Publishers,
Dordrecht
Vrba, J. & Robinson, S. E. (2001). Signal processing in magnetoencephalography. Methods,
25, pp. 249-271
Wakai, R. T. (2004). Assessment of fetal neurodevelopment via fetal magnetocardiography.
Experimental Neurology, 190, Suppl. 1, pp. S65-S71
Weinstock, H. (1996). SQUID Sensors: Fundamentals, Fabrication and Applications, Kluwer
Academic Publishers, Dordrecht
Weinstock, H. (2000). Applications of Superconductivity, Kluwer Academic Publishers,
Dordrecht
Williamson, S. J.; Pellizone, M.; Okada, Y.; Kaufman, L.; Crum, D. B. & Marsden, J. R. (1985).
Five channel SQUID installation for unshielded neuromagnetic measurements, In:
Biomagnetism: Applications and Theory, Weinberg, H.; Stroink, G. & Katila T. (Eds.),
pp. 46–51, Pergamon Press, New York
Yamamoto, Y. & Hughson, R. L. (1994). On the fractal nature of heart rate variability in
humans: effects of data length and beta-adrenergic blockade. Am. J. Physiol., 266,
pp. R40-R49
Yohai, V.; Stahel, W. A. & Zamar, R. H. (1991). A procedure for robust estimation and
inference in linear regression, In: Directions in Robust Statistics and Diagnostics, Part
II, Stahel W. A. & Weisberg, S. W. (Eds.), Springer-Verlag, Berlin
Zhao, H. & Wakai, R. T. (2002). Simultaneity of foetal heart rate acceleration and foetal trunk
movement determined by foetal magnetocardiogram actocardiography. Phys. Med.
Biol., 47, pp. 839-846
BiomagneticMeasurementsforAssessmentofFetalNeuromaturationandWell-Being 445
Mosher, J. C.; Flynn, E. R.; Quinn, A.; Weir, A.; Shahani, U.; Bain, R. J. P.; Maas, P. &
Donaldson, G. B. (1997). Fetal magnetocardiography: methods for rapid data
reduction. Rev. Sci. Instrum., 68, pp. 1587-1595
Neonen, J.; Montonen, J. & Katila, T. (1996). Thermal noise in biogmagnetic measurements.
Rev. Sci. Instrum., 67, pp. 2397-2405
Osei, E. K. & Faulkner, K. (1999). Fetal position and size data for dose estimation. Br. J.
Radiol., 72, pp. 363-370
Padhye, N. S.; Brazdeikis, A. & Verklan, M. T. (2004). Monitoring fetal development with
magnetocardiography, Proc. 26th Ann. Intl. Conf. IEEE Eng. in Med. and Biol. Soc., pp.
3609–3610, San Francisco, CA, USA
Padhye, N. S.; Brazdeikis, A. & Verklan, M. T. (2006). Change in complexity of fetal heart
rate variability, Proc. 28th Ann. Intl Conf. IEEE Eng. in Med. and Biol. Soc., pp. 1796–
1798, New York City, NY, USA
Padhye, N. S.; Verklan, M. T.; Brazdeikis, A.; Williams, A. L.; Khattak, A. Z. & Lasky, R. E.
(2008). A comparison of fetal and neonatal heart rate variability at similar post-
menstrual ages, Proc. 30th Ann. Intl Conf. IEEE Eng. in Med. and Biol. Soc., pp. 2801–
2804, Vancouver, BC, Canada
Pan J. & Tompkins, W. J. (1985). A real-time QRS detection algorithm. IEEE Trans. Biomed.
Eng., 32, pp. 230-236
Peng, C. K.; Buldyrev, S. V.; Havlin, S.; Simons, M.; Stanley, H. E. & Goldberger, A. L. (1994).
Mosaic organization of DNA nucleotides. Phys. Rev. E, 49, pp. 1685-1689
Richman, J. S. & Moorman, J. R. (2000). Physiologic time series analysis using approximate
entropy and sample entropy. Am. J. Physiol., 278, pp. 2039-2049
Sarvas, J. (1987). Basic mathematical and electromagnetic concepts of the biomagnetic
inverse problem. Phys. Med. Biol., 32, pp. 11-22
Scheer, K. & Nubar, J. (1976). Variation of fetal presentation with gestational age. Am. J.
Obstet. Gynecol., 125, pp. 269-270
Shiavi, R. (1999). Introduction to applied statistical signal analysis, 2nd ed., Academic Press, San
Diego
Sternickel, K. & Braginski, A. I. (2006). Biomagnetism using SQUIDs: status and
perspectives. Supercond. Sci. Technol., 19, pp. S160-S171
Stolz, R.; Bondarenko, N.; Zakosarenko, V.; Schulz, M. & Meyer, H. G. (2003). Integrated
gradiometer-SQUID system for fetal magneto-cardiography without magnetic
shielding. Superconductivity Science Technologies, 16, pp. 1523-1527
Tinkham, M. (1996). Introduction to Superconductivity, McGraw-Hill, New York
Uzunbajakau, S. A.; Rijpma, A. P.; ter Brake, H. J. M. & Peters, M. J. (2005). Optimization of a
third-order gradiometer for operation in unshielded environments. IEEE Trans.
Appl. Supercond., 15, pp. 3879-3885
Van Leeuwen, P.; Lange, S.; Bettermann, H.; Grönemeyer, D. & Hatzmann, W. (1999). Fetal
heart rate variability and complexity in the course of pregnancy. Early Hum. Dev.,
54, pp. 259-269
Van Leeuwen, P.; Cysarz, D.; Lange, S. & Geue, D. (2007). Quantification of fetal heart rate
regularity using symbolic dynamics. Chaos, 17, 015119-9
Van Leeuwen, P.; Geue, D.; Lange, S. & Groenemeyer, D. (2009). Analysis of fetal movement
based on magnetocardiographically determined fetal actograms and fetal heart rate
accelerations, In: ECIFMBE 2008, IFMBE Proceedings Vol. 22, Vander Sloten, J.;
Verdonck, P.; Nyssen, M. & Haueisen, J. (Eds.), pp. 1386-1389, Springer, Berlin
Vázquez-Flores, G. J. (2007). A realistic biomagnetic model for optimized acquisition of fetal
magnetocardiograms in unshielded clinical settings, Thesis, University of Houston
Verklan, M. T.; Padhye, N. S. & Brazdeikis, A. (2006). Analysis of fetal heart rate variability
obtained by magnetocardiography. J. Perinat. Neonat. Nurs., 20, pp. 343-348
Vrba, J. (1996). SQUID gradiometers in real environments, In: SQUID Sensors: Fundamentals,
Fabrication and Applications, Weinstock, H. (Ed.), pp. 117-178, Kluwer Academic
Publishers, Dordrecht
Vrba, J. (2000). Multichannel SQUID biomagnetic systems, In: Applications of
Superconductivity, Weinstock, H. (Ed.), pp. 61-138, Kluwer Academic Publishers,
Dordrecht
Vrba, J. & Robinson, S. E. (2001). Signal processing in magnetoencephalography. Methods,
25, pp. 249-271
Wakai, R. T. (2004). Assessment of fetal neurodevelopment via fetal magnetocardiography.
Experimental Neurology, 190, Suppl. 1, pp. S65-S71
Weinstock, H. (1996). SQUID Sensors: Fundamentals, Fabrication and Applications, Kluwer
Academic Publishers, Dordrecht
Weinstock, H. (2000). Applications of Superconductivity, Kluwer Academic Publishers,
Dordrecht
Williamson, S. J.; Pellizone, M.; Okada, Y.; Kaufman, L.; Crum, D. B. & Marsden, J. R. (1985).
Five channel SQUID installation for unshielded neuromagnetic measurements, In:
Biomagnetism: Applications and Theory, Weinberg, H.; Stroink, G. & Katila T. (Eds.),
pp. 46–51, Pergamon Press, New York
Yamamoto, Y. & Hughson, R. L. (1994). On the fractal nature of heart rate variability in
humans: effects of data length and beta-adrenergic blockade. Am. J. Physiol., 266,
pp. R40-R49
Yohai, V.; Stahel, W. A. & Zamar, R. H. (1991). A procedure for robust estimation and
inference in linear regression, In: Directions in Robust Statistics and Diagnostics, Part
II, Stahel W. A. & Weisberg, S. W. (Eds.), Springer-Verlag, Berlin
Zhao, H. & Wakai, R. T. (2002). Simultaneity of foetal heart rate acceleration and foetal trunk
movement determined by foetal magnetocardiogram actocardiography. Phys. Med.
Biol., 47, pp. 839-846
NewDevelopmentsinBiomedicalEngineering446
OpticalSpectroscopyonFungalDiagnosis 447
OpticalSpectroscopyonFungalDiagnosis
RenatoE.deAraujo,DiegoJ.Rativa,MarcoA.B.Rodrigues,ArmandoMarsdenandLuiz
G.SouzaFilho
X
Optical Spectroscopy on Fungal Diagnosis
Renato E. de Araujo, Diego J. Rativa, Marco A. B. Rodrigues
Department of Electronic and Systems, Federal University of Pernambuco
Brazil
Armando Marsden, Luiz G. Souza Filho
Department of Mycology and Tropical Medicine, Federal University of Pernambuco
Brazil
1. Introduction
Occurring globally, most fungi are undetectable to naked eye, living for the most part in soil,
dead matter, as well as symbionts of plants, animals, or other fungi. Fungal infections are of
important concern in several patients submitted to treatment with prolonged antibiotic
therapy, immunosuppressive drugs, corticosteroids, degenerative diseases, diabetes,
neoplasias, blood dyscrasias, endocrinopathies and other debilitating conditions as
transplanted patients. In the most of cases, a rapid diagnostic and treatment is therefore
critical (Davies, 1988).
In dermatological mycology, diagnostics modalities available are histopathology, direct
microscopic examination of clinical specimen, culture and serology. Visual examination of
skin, nail and hair samples for detect the presence of fungi is an essential step to confirm the
clinical diagnosis of cutaneous fungus infection. Normally, the identification of fungi is
done mainly by morphological in vivo studies based on visual macroscopic and microscopic
aspects. Therefore, visual inspection requires a lot of training.
Characteristics of an organism's growth on culture media, such as colony size, color, and
shape, provide clues to species identification. The prolonged incubation time is a major
limitation of fungal cultures as a diagnostic tool. Biochemical and molecular biology
techniques such as serology are also used for that purpose (Rippon, 1999; De Hoog et al.,
2001). In particular, the serology test for detection of fungal antibodies take about 2 to 3
weeks, and it is of limited value especially in immunocompromised patients in whom
production of antibodies is impaired. Multiple test techniques can be highly accurate but
may require several days to yield results, creating delay in diagnosis, which may even
culminate in a fatal outcome.
Here we exploit the autofluorescence spectroscopy of fungi as a tool to identify microbial
infections. Different types of light source were used to excite endogenous fungal
fluorochromes and a simple mathematical method was developed to identify specific
features of the emission spectrum of six fungal species.
23
NewDevelopmentsinBiomedicalEngineering448
2. Fungal autofluorescence
Fluorescence consists of the electromagnetic radiation emitted by a material, especially of
visible light, after absorption of incident radiation and persisting only as long as the
stimulating radiation is continued. A number of cellular constituents uoresce when excited
directly or excited by energy transfer from another constituent, this uorescence is called
autouorescence (Prasad, 2003). In the most of cases, excitation can be obtained by use of
near ultraviolet (UV) light, with wavelength () going from 320 to 400 nm (Prasad, 2003;
Richards-Kortum & Sevick-Muraca, 1996). After the absorption of UV light by a
fluorochrome, radiation of longer wavelength (visible light) is emitted.
The autofluorescence spectroscopic technique is a simple and quick procedure that can be
exploited on fungal detection from in vivo diagnosis of dermatophytic infection to in vitro
tissue or incubation on culture media by immunofluorescent techniques (Mustakallio &
Korhonen, 1966; Asawanonda & Charles, 1999).
The first use of fluorescence by UV excitation in dermatology was reported in 1925
(Margarot & Deveze, 1925), with the detection of fungal infection on hair. At the present
time UV light in dermatology is used predominantly in diagnostic areas involving
pigmentary disorders, cutaneous infections, and the porphyrias (Asawanonda & Charles,
1999). Moreover, UV light can be very helpful establishing the extent of infection by
Malassezia furfur, which presents a yellowish autofluorescence (Mustakallio & Korhonen,
1966). Blue-green fluorescence can be observed in Microsporum audouinii and Microsporum
canis infections (Asawanonda & Charles, 1999). Microsporum distortum and Microsporum
ferrugineum also present a greenish fluorescence. A faint blue color is emitted by
Trichophyton schoenleinii and a dull yellow is seen in Microsporum gypseum fluorescence
(Asawanonda & Charles, 1999). In vitro studies indicate that the chromophores pteridine is
one of the chemical substances responsible for the fluorescence of M. canis and M. gypseum
(Wolf, 1957; Chattaway & Barlow, 1958; Wolf, 1958). It was also showed the tryptophan
dependence on the fluorochrome synthesis of Malassezia yeasts (Mayser et al., 2004; Mayser
et al., 2002).
The advantages and limitations of UV light on fungal diagnosis are already known
(Asawanonda & Charles, 1999). The emission spectrum overlap of different fungi can make
them indistinguishable by a visual inspection of fluorescence. Moreover, some species of
fungi do not contain fluorescent chemicals and therefore not all the fungi infections can be
detected by visual analyses of their autofluorescence. To overcome this limitation
nonspecific fluorochrome stains, such as Calcofluor White (440nm) and Blancophor
(470nm) that binds to cellulose and chitin in cell walls of fungi, can be used to detect
without ambiguity fungal elements in dermatological assays (in vitro) (Harrington &
Hageage 1991).
3. UV Light Sources
In dermatology, the long-wave ultraviolet (UV) light source, known as Wood’s lamp, has
become an invaluable tool for diagnostic procedure. Wood’s lamp was invented in 1903 by
Robert W. Wood (1868–1955) (Wood, 1919). Wood’s lamp is a high-pressure mercury
fluorescent lamp that emits a broad band spectrum, with wavelength going from 320 to 400
nm, with a peak at 365 nm. In fluorescent lamps, mercury atoms are excited through
OpticalSpectroscopyonFungalDiagnosis 449
2. Fungal autofluorescence
Fluorescence consists of the electromagnetic radiation emitted by a material, especially of
visible light, after absorption of incident radiation and persisting only as long as the
stimulating radiation is continued. A number of cellular constituents uoresce when excited
directly or excited by energy transfer from another constituent, this uorescence is called
autouorescence (Prasad, 2003). In the most of cases, excitation can be obtained by use of
near ultraviolet (UV) light, with wavelength () going from 320 to 400 nm (Prasad, 2003;
Richards-Kortum & Sevick-Muraca, 1996). After the absorption of UV light by a
fluorochrome, radiation of longer wavelength (visible light) is emitted.
The autofluorescence spectroscopic technique is a simple and quick procedure that can be
exploited on fungal detection from in vivo diagnosis of dermatophytic infection to in vitro
tissue or incubation on culture media by immunofluorescent techniques (Mustakallio &
Korhonen, 1966; Asawanonda & Charles, 1999).
The first use of fluorescence by UV excitation in dermatology was reported in 1925
(Margarot & Deveze, 1925), with the detection of fungal infection on hair. At the present
time UV light in dermatology is used predominantly in diagnostic areas involving
pigmentary disorders, cutaneous infections, and the porphyrias (Asawanonda & Charles,
1999). Moreover, UV light can be very helpful establishing the extent of infection by
Malassezia furfur, which presents a yellowish autofluorescence (Mustakallio & Korhonen,
1966). Blue-green fluorescence can be observed in Microsporum audouinii and Microsporum
canis infections (Asawanonda & Charles, 1999). Microsporum distortum and Microsporum
ferrugineum also present a greenish fluorescence. A faint blue color is emitted by
Trichophyton schoenleinii and a dull yellow is seen in Microsporum gypseum fluorescence
(Asawanonda & Charles, 1999). In vitro studies indicate that the chromophores pteridine is
one of the chemical substances responsible for the fluorescence of M. canis and M. gypseum
(Wolf, 1957; Chattaway & Barlow, 1958; Wolf, 1958). It was also showed the tryptophan
dependence on the fluorochrome synthesis of Malassezia yeasts (Mayser et al., 2004; Mayser
et al., 2002).
The advantages and limitations of UV light on fungal diagnosis are already known
(Asawanonda & Charles, 1999). The emission spectrum overlap of different fungi can make
them indistinguishable by a visual inspection of fluorescence. Moreover, some species of
fungi do not contain fluorescent chemicals and therefore not all the fungi infections can be
detected by visual analyses of their autofluorescence. To overcome this limitation
nonspecific fluorochrome stains, such as Calcofluor White (440nm) and Blancophor
(470nm) that binds to cellulose and chitin in cell walls of fungi, can be used to detect
without ambiguity fungal elements in dermatological assays (in vitro) (Harrington &
Hageage 1991).
3. UV Light Sources
In dermatology, the long-wave ultraviolet (UV) light source, known as Wood’s lamp, has
become an invaluable tool for diagnostic procedure. Wood’s lamp was invented in 1903 by
Robert W. Wood (1868–1955) (Wood, 1919). Wood’s lamp is a high-pressure mercury
fluorescent lamp that emits a broad band spectrum, with wavelength going from 320 to 400
nm, with a peak at 365 nm. In fluorescent lamps, mercury atoms are excited through
collisions with electrons and ions. When the atoms return to their original energy level, they
emit photons. The output intensity of a Wood’s lamp is typically of few mW/cm
2
.
For medical purposes, light on the UV region of the electromagnetic spectrum can be
obtained with optoeletronics devices rather than Wood’s lamp. A light-emitting diode (LED)
is a semiconductor device that generates light when an electric current passes through it.
LEDs are completely solid-state technology, making them extremely durable. On other
hand, vibration or shock easily breaks the fragile glass tubing of a fluorescent lamp. In
addition to being robust and efficient producers of light, LEDs are compact, low voltage and
low power consuming devices, suitable to be used in small equipments. Moreover, it is
possible to find LEDs in a wide range of colors, extending from ultraviolet (350 nm) to the
far-infrared (1500 nm) region of the electromagnetic spectrum.
Ultraviolet light can also be obtained by the use of medical LASER systems, as excimer
LASER (XeCl, XeF) and by infrared pulse LASERS (exploring the generation of second and
third harmonic). The number of LASERS in medical clinics has rapidly increased in the last
two decades, turning LASER therapy and diagnostic more accessible.
4. Autofluorescence spectroscopy
This section is devoted to describe the possibility of applying different UV light sources on
the identification of fungi by optical spectroscopy.
Here six species of filamentous fungi were used: Five dermatophytes (Microsporum gypseum,
Microsporum canis, Trichophyton schoenleinii, Trichophyton rubrum, Epidermophyton floccosum)
and one hyalohyphomycetes (Fusarium solani). Theses fungi are recognized as emergent
pathogens in the Northeast of Brazil. All of the samples studied were isolated from patients
with dermatomycoses (superficial mycoses) attended in the medical mycology laboratory at
the Federal University of Pernambuco. The biological materials were cultivated on Petri
dishes with a Sabouraud Dextrose Agar (SDA) medium containing chloranphenicol (0.05
g/L). After isolation and identification (by microscopic and macroscopic morphological
analysis) of the fungi, the samples were placed in glass tubes with SDA without antibiotic
and preserved at room temperature (25
o
C).
Four different light sources were explored in the experiment: 4 Watts UV fluorescent lamp
(Wood’s lamp) from Toshiba (BLUE FL4BLB) and from XELUX (G5), UV LEDs from
Roithner LASER (UVLED365-10), and the third harmonic from a Nd:YAG nanosecond
pulsed laser (Continuum/ Surelte). The light sources spectra are presented on figure 1. All
light sources radiates on the UV-A region of the electromagnetic spectrum. The bandwidth
and the peak wavelength of the light sources used were respectively 43 and 353nm for the
Toshiba lamp, 18 and 375nm for the Xelux lamp, 19 and 363nm for the Roithner LED. The
bandwidth of the UV LASER light at 352 nm was 3.5nm.
NewDevelopmentsinBiomedicalEngineering450
Fig. 1. Light sources emission spectra
In our experimental setup for fungal autofluorescence spectroscopy, the excitation UV light
was focused on the sample. To keep the UV intensity with about the same value (5mW/cm
2
)
for all light sources, neutral density filters were used. The fungal autofluorescence light was
collected by a lens system and sent to a spectrometer (SPEX/Minimate). A color filter
(Corning 3-73) was placed at the entrance of the spectrometer to ensure that the excitation
light would not reach the photomultiplier. A GaAs photomultiplier (RCA Electronic Device)
was used to convert the collected light to an electrical signal. The signal was digitalized by a
lock-in amplifier (SR530 Stanford Research) and sent to a computer, where it was stored and
analyzed. The spectrum resolution of the experimental system was 0.5 nm. The
experimental setup scheme is shown in Figure 2.
Fig. 2. Scheme of the experimental setup used.
For all fungi, the first fluorescence measurements were taken seven days after inoculation,
and repeated 14 and 21 days later. In all experiments, all samples were investigated
applying different light sources (UV Lamp, LED, and LASER). The excitation light power
was monitored to ensure similar excitation conditions. Two set of attempts were performed
OpticalSpectroscopyonFungalDiagnosis 451
Fig. 1. Light sources emission spectra
In our experimental setup for fungal autofluorescence spectroscopy, the excitation UV light
was focused on the sample. To keep the UV intensity with about the same value (5mW/cm
2
)
for all light sources, neutral density filters were used. The fungal autofluorescence light was
collected by a lens system and sent to a spectrometer (SPEX/Minimate). A color filter
(Corning 3-73) was placed at the entrance of the spectrometer to ensure that the excitation
light would not reach the photomultiplier. A GaAs photomultiplier (RCA Electronic Device)
was used to convert the collected light to an electrical signal. The signal was digitalized by a
lock-in amplifier (SR530 Stanford Research) and sent to a computer, where it was stored and
analyzed. The spectrum resolution of the experimental system was 0.5 nm. The
experimental setup scheme is shown in Figure 2.
Fig. 2. Scheme of the experimental setup used.
For all fungi, the first fluorescence measurements were taken seven days after inoculation,
and repeated 14 and 21 days later. In all experiments, all samples were investigated
applying different light sources (UV Lamp, LED, and LASER). The excitation light power
was monitored to ensure similar excitation conditions. Two set of attempts were performed
one month apart. Spectroscopic analysis of isolated growth medium fluorescence was also
performed.
5. Spectroscopic results and analysis
All samples studied fluoresced. Figure 3 shows the fluorescence of F. solani, T. rubrum and T.
schoenleinii, M. gypseum, M. canis and E. floccosum excited with the UV LED 21 days after
inoculation. An increase of the fluorescence intensity at the 21st day was noticed for several
fungi. Spectroscopic results show (Figure 4) that fluorescence emissions induced by UV
Lamps (Toshiba and Xelux) are quite similar from the ones obtained with UV LED (Figure
3). It can be observed on Figure 3 and 4 that the T. rubrum has a fluorescence spectrum very
distinct from the other microorganisms.
Fig. 3. Fungal emission after UV LED excitation (21 days after inoculation).
Fig. 4. Fungal emission after UV lamp excitation (21 days after inoculation).
NewDevelopmentsinBiomedicalEngineering452
The closeness of the peak emission wavelength and the spectrum shape of all samples, other
than the T. rubrum, make it hard to distinguish fungi by a visual analysis of their
autofluorescence. Although a careful spectroscopic analysis of the fluorescence shows
distinct features on the detected emissions. Difference between fungi fluorescence spectra
can be better perceived by analyzing the emission intensity at specific wavelength. Table 1
presents the values of a relative intensity defined as (I
λ1
-I
λ2
-I
λ3
)/(I
λ1
+I
λ2
+I
λ3
), where I
λ1
, I
λ2
and I
λ3
are respectively the intensity of the fluorescence at 430, 485 and 550 nm, obtain in
Fig. 3.
(I
1
-I
2
-I
3
)/(I
1
+I
2
+I
)
Fungi 1º experiment 2º experiment
T. rubrum
1.25 ± 0.05 1. 25 ± 0.05
F
. solani
-4.15 ± 0.05 -4.20 ± 0.05
T. schoenleinii
-3.50 ± 0.05 -3.50 ± 0.05
M
. canis
-7.50 ± 0.05 -7.55 ± 0.05
E
.
f
loccosum
-1.60 ± 0.05 -1.60 ± 0.05
Table 1. Fungal fluorescence spectral characteristics (LED excitation).
Fungal emission spectra obtained using the narrow band UV LASER excitation source is
presented in Figure 5. UV LASER induced fluorescence present three peaks, resulting from
specific energy decaying channels. The graphics in Figure 5 are normalized at 460 nm, to
better show the spectra distinctions. Relative intensities of the peaks (417, 460 and 505 nm)
can be explored to identify the studied fungi. Table 2 presents values of a relative intensity
defined as (I
λ1
-I
λ2
)/(I
λ1
+I
λ2
), where I
λ1
and I
λ2
are respectively the intensity of the
fluorescence at 417 and 505nm, obtain by Fig. 5. The results in Table 2 indicate that a
spectroscopic analysis of UV LASER induced fluorescence can be explored on the
identification of fungi.
Fig. 5. Fungal emission after UV LASER excitation (21 days after inoculation).
OpticalSpectroscopyonFungalDiagnosis 453
The closeness of the peak emission wavelength and the spectrum shape of all samples, other
than the T. rubrum, make it hard to distinguish fungi by a visual analysis of their
autofluorescence. Although a careful spectroscopic analysis of the fluorescence shows
distinct features on the detected emissions. Difference between fungi fluorescence spectra
can be better perceived by analyzing the emission intensity at specific wavelength. Table 1
presents the values of a relative intensity defined as (I
λ1
-I
λ2
-I
λ3
)/(I
λ1
+I
λ2
+I
λ3
), where I
λ1
, I
λ2
and I
λ3
are respectively the intensity of the fluorescence at 430, 485 and 550 nm, obtain in
Fig. 3.
(I
1
-I
2
-I
3
)/(I
1
+I
2
+I
)
Fungi 1º experiment 2º experiment
T. rubrum
1.25 ± 0.05 1. 25 ± 0.05
F
. solani
-4.15 ± 0.05 -4.20 ± 0.05
T. schoenleinii
-3.50 ± 0.05 -3.50 ± 0.05
M
. canis
-7.50 ± 0.05 -7.55 ± 0.05
E
.
f
loccosum
-1.60 ± 0.05 -1.60 ± 0.05
Table 1. Fungal fluorescence spectral characteristics (LED excitation).
Fungal emission spectra obtained using the narrow band UV LASER excitation source is
presented in Figure 5. UV LASER induced fluorescence present three peaks, resulting from
specific energy decaying channels. The graphics in Figure 5 are normalized at 460 nm, to
better show the spectra distinctions. Relative intensities of the peaks (417, 460 and 505 nm)
can be explored to identify the studied fungi. Table 2 presents values of a relative intensity
defined as (I
λ1
-I
λ2
)/(I
λ1
+I
λ2
), where I
λ1
and I
λ2
are respectively the intensity of the
fluorescence at 417 and 505nm, obtain by Fig. 5. The results in Table 2 indicate that a
spectroscopic analysis of UV LASER induced fluorescence can be explored on the
identification of fungi.
Fig. 5. Fungal emission after UV LASER excitation (21 days after inoculation).
(I
1
-I
2
)/(I
1
+I
2
)
Fungi 1º experiment 2º experiment
T. rubrum
0.55 0.54
F. solani
-0.09 -0.13
T. schoenleinii
-0.13 -013
M. canis
-0.10 -0.08
E. floccosum
0.28 0.26
Table 2. Fungal fluorescence spectral characteristics (LASER excitation)
6. Conclusion
Here it was demonstrated that optical spectroscopy can be exploit as a tool for fungal
diagnosis. We observed distinct features on fungal emission. Although it is impossible do
distinguish several microorganisms only by a visual analysis of their fluorescence. A careful
spectroscopic analysis of fungal autofluorescence is required on the on the identification of
microbial infections.
By exciting fungal fluorochromes with a broadband UV light source (LED and Lamp), we
showed that a multiple wavelength (430, 485 and 550 nm) analysis of their autofluorescence
spectrum can differentiate several fungi species. It has been proposed before a device for
fungal diagnosis base on the analysis of the relative intensity of two specific wavelengths
(Rativa, 2008). Here a better method for fungal identification is presented, based on the
evaluation of three spectra regions of the fluorescent emission. We believe that a more refine
mathematical model should be explored on a bigger group of fungi species. For that we are
currently working with the Kolmogorov-Smirnov method on the fungal autofluorescence
spectrum.
Here we also showed that UV narrow band light source (LASER) can lead to special features
on the fluorescent spectrum. In that case a dual-wavelength analysis can be use to
distinguish all the six fungal species studied. Although UV LASERS are still too expensive
to be used for fungal diagnosis, their prices are constantly decreasing over the past decade.
In the near feature UV LASER can be an important tool for dermatological diagnosis.
7. References
Asawanonda, P. & Charles, T.R. Wood's light in dermatology. Int J Dermatol, 38 (1999) 801-
807.
Davies, S. F. Diagnosis of pulmonary fungal infections. Semin Respir Infect; 3, (1988) 162-171.
De Hoog, G. S.; Guarro, J.; Gene, J. & Figueras, M. J. (2001) Atlas of Clinical Fungi. 2nd ed.,
American Society Microbiology, Washington.
Chattaway, F. W. and Barlow, A. J. E. Fluorescent substances produced by Dermatophytes.
Nature, 4604 (1958) 281-282.
Harrington, B. J. & Hageage, G. J. Jr. Calcofluor white: Tips for improving its use. Clin
Microbiol Newslett, 13 (1991) 3–5.
Mayser, P.; Schäfer, U.; Krämer, H. J.; Irlinger, B. & Steglich, W. Pityriacitrin – a ultraviolet-
absorbing indole alkaloid from the yeast Malassezia furfur. Arch Dermatol Res; 94
(2002) 131– 134.
NewDevelopmentsinBiomedicalEngineering454
Mayser, P.; Tows, A.; Kramer, H. J. & Weiss, R. Further characterization of pigment-
producing Malassezia strains. Mycoses, 47 (2004) 34–39.
Margarot, J. & Deveze, P. Aspect de quelques dermatoses lumiere ultraparaviolette. Bull Soc
Sci Med Biol Montpellier, 6 (1925) 375-378.
Monod, M.; Jaccoud, S.; Stirnimann, R.; Anex, R.; Villa, F.; Balmer, S. & Panizzon, R.
Economical Microscope Configuration for Direct Mycological Examination with
Fluorescence in Dermatology. Dermatology, 201 (2000) 246-248.
Mustakallio, K. & Korhonen, P. Monochromatic ultraviolet photography in dermatology. J.
Investig. Derm., 47 (1966) 351-356.
Prasad, P. N. (2003) Introduction to Biophotonics, 1st ed. Wiley-Interscience, New York.
Rativa, D. J.; Gomes, A. S. L.; Benedetti, M. A.; Souza Filho, L. G.; Marsden, A. & de Araujo,
R. E. (2008) Optical spectroscopy on in vitro fungal diagnosis, Proceedings of 30th
Annual International EMBS Conference, pp. 4871 – 4874, Vancouver, Aug. 2008, IEEE,
Vancouver.
Richards-Kortum, R. & Sevick-Muraca, E. Quantitative Optical Spectroscopy for Tissue
Diagnosis. Annu. Rev. Phys. Chem., 47 (1996) 555–606.
Rippon, J. W. (1988) Medical Mycology: The Pathogenic Fungi and the Pathogenic Actinomycetes.
3rd ed. W B Saunders Co. Philadelphia
Wolf, F. T. Chemical nature of the fluorescent pigment produced in Microsporum-infected
hair. Nature, 4591 (1957) 180-181.
Wolf, F. T. Fluorescent Pigment of Microsporum. Nature, 182 (1958) 475-476.
Wood, R. W. Secret communications concerning light rays. J. of Physiol; 5e serie: t IX (1919).
Real-TimeRamanSpectroscopyforNoninvasiveinvivoSkinAnalysisandDiagnosis 455
Real-TimeRamanSpectroscopyforNoninvasiveinvivoSkinAnalysis
andDiagnosis
JianhuaZhao,HarveyLui,DavidI.McLeanandHaishanZeng
X
Real-Time Raman Spectroscopy for
Noninvasive in vivo Skin Analysis
and Diagnosis
Jianhua Zhao, Harvey Lui, David I. McLean and Haishan Zeng
Laboratory for Advanced Medical Photonics and Photomedicine Institute,
Department of Dermatology and Skin Science,
University of British Columbia & Vancouver Coastal Health Research Institute
Cancer Imaging Department, British Columbia Cancer Research Center,
Vancouver, Canada
1. Introduction
Human skin has been the object of numerous investigations involving noninvasive optical
techniques including infrared (IR) spectroscopy and Raman spectroscopy (Zeng et al. 1995;
Zeng et al. 2008; Kollias et al. 2002; Richards-Kortum et al. 1996; Mahadevan-Jansen et al.
1996; Hanlon et al. 2000). IR and Raman spectroscopy are complimentary techniques. Both
techniques probe the vibrational properties of molecules according to different underlying
physical principles. For example, IR spectroscopy is based on the absorption properties of
the sample where the signal intensity follows the Beer’s Law, while Raman spectroscopy
relies on detecting photons that are scattered inelastically by the sample. The intensity of the
Raman shift is directly proportional to molecular concentration. The differences in
underlying mechanisms confer certain advantages for each method. The instrument for IR
spectroscopy is simpler, but the spectra are strongly affected by water absorption in the IR
region. The instrumentation for Raman spectroscopy is more complicated than for IR
because the Raman signal is extremely weak, but its intensity is proportional to the
concentration and independent of the sample thickness. Comparing these two techniques,
Raman spectroscopy is more useful for in vivo applications. Since its introduction by
Williams et al. for skin research, Raman spectroscopy has gained increasing popularity
(Williams et al. 1992; Barry et al. 1992). Gniadecka et al studied human skin, hair and nail in
vitro and the signatures of cutaneous Raman spectra have been well documented
(Gniadecka et al. 1997; Gniadecka et al. 1998; Gniadecka et al. 2003; Gniadecka et al. 2004;
Edwards et al. 1995). Caspers et al reported the Raman properties of different skin layers
using in vivo confocal microscopy (Caspers et al. 1998; Caspers et al. 2001; Caspers et al. 2003).
Raman spectroscopy has also been used to study dysplasia and cancer in a variety of human
tissues, including skin (Huang et al. 2001a; Huang et al. 2005; Huang et al. 2006; Gniadecka et
al. 1997; Gniadecka et al. 2004; Lieber et al. 2008a; Lieber et al. 2008b; Nijssen et al. 2002).
Because the probability of Raman scattering is exceedingly low it has heretofore been
24