SSupply Chain Management 2011 Part 12 pptx
Bạn đang xem bản rút gọn của tài liệu. Xem và tải ngay bản đầy đủ của tài liệu tại đây (1.28 MB, 40 trang )
Complexity in Supply Chains:
A New Approach to Quantitative Measurement of the Supply-Chain-Complexity
431
Calinescu, A., et al. 2001. Classes of complexity in manufacturing. 17th national conference
on manufacturing research, 4–6 September, University of Cardiff, Cardiff,
351–356.
Deshmukh, A.V., Talavage, J.J. and Barash, M.M., 1992. Characteristics of part mix
complexity measure for manufacturing systems. IEEE international conference on
systems, man and cybernetics, 18–21 October, New York, USA, 1384–1389.
Deshmukh, A.V., Talavage, J.J., and Barash, M.M., 1998. Complexity in manufacturing
systems. Part 1: analysis of static complexity. IIE Transactions, 30 (7), 645–655.
Frizelle, G. and Woodcock, E., 1995. Measuring complexity as an aid to developing
operational strategy. International Journal of Operations and Production
Management, 15 (5), 26–39.
Gove, P.B., 1986. Complexity. Webster’s third new international dictionary of the English
language unabridged. Massachusetts, USA: Merriam-Webster-Verlag.
Hoyle, D., 2009. ISO 9000 Quality Systems Handbook. Butterworth-Heinemann, Oxford,
UK.
Isik, F. 2010. An entropy-based approach for measuring complexity in supply chains.
International Journal of Production Research, 48 (12), 3681 – 3696.
Lee, H.L., Padmanabhan, V. and Whang, S., 1997a. The bullwhip effect in supply chains.
Sloan Management Review, 38 (3), 93-102.
Lee, H.L., Padmanabhan, V. and Whang, S., 1997b. Information distortion in a supply chain:
The bullwhip effect. Management Science, 43 (4), 546-558.
Makui A. and Aryanezhad M. B., 2003. A new method for measuring the static
complexity in manufacturing, Journal of the Operational Research Society, 54(5),
555-557.
Martin, J. W. (2007). Lean Six Sigma for supply chain management: The 10-step solution
process. The McGraw-Hill Companies, Inc. New York, NY.
Martínez-Olvera, C. 2008. Entropy as an assessment tool of supply chain information
sharing. European Journal of Operational Research, 185 (1), 405-417.
Milgate, M., 2001. Supply chain complexity and delivery performance: an international
exploratory study. Supply Chain Management: An International Journal, 6 (3), 106–
118.
Montgomery, C.D., Jennings, C.L., Kulahci, M., 2008. Introduction to Time Series Analysis
and Forecasting (Wiley Series in Probability and Statistics). John Wiley & Sons, Inc.,
Hoboken, NJ, USA.
Ronen, B. and Karp, R., 1994. An information entropy approach to the small-lot concept.
IEEE Transactions on Engineering Management, 41 (1), 89–92.
Sivadasan, S., et al., 2002. An information-theoretic methodology for measuring the
operational complexity of supplier–customer systems. International Journal of
Operations and Production Management, 22 (1), 80–102.
Sivadasan, S., et al., 2006. Advances on measuring the operational complexity of supplier–
customer systems. European Journal of Operational Research, 171 (1), 208–226.
Shannon, C.E., 1948. A mathematical theory of communication. Bell System Technical
Journal, 27, 379–423.
Supply Chain Management
432
Shannon, C.E., Weaver, W., 1949. The Mathematical Theory of Communication. University
of Illinois Press, Chicago, IL.
Wilding, R., 1998. The supply chain complexity triangle: uncertainty generation in the
supply chain. International Journal of Physical Distribution and Logistics
Management, 28 (8), 599–616.
Yao, D.D., 1985. Material and information flows in flexible manufacturing systems. Material
Flow, 2, 143–149.
20
A Multi-Agent Model for Supply Chain Ordering
Management: An Application to the Beer Game
Mohammad Hossein Fazel Zarandi
1
, Mohammad Hassan Anssari
2
,
Milad Avazbeigi
3
and Ali Mohaghar
2
1
Amirkabir University of Technology
2
University of Tehran
3
European Centre for Soft Computing, Supported by a Master Grant
1,2
Iran
3
Spain
1. Introduction
The American Production and Inventory Control Society Dictionary defines the term supply
chain (SC) as “the process from the initial raw materials to the ultimate consumption of the
finished product linking across supplier–user companies.” Supply chain management
(SCM) literature covers wide range of areas such as logistics, production, scheduling, facility
location, procurement, inventory management, ordering management, and so on. Due to the
increasing competition in today’s global market, business enterprises are forced to improve
their supply chains to reduce inventory cost and enhance customer service levels (Wang &
Shu, 2005; Giannoccaro, 2003).
Supply chain ordering management (SCOM), which is the main concern of this book chapter is
an integrated approach to determine the ordering size of each actor of SC to the upstream actor
aiming to minimize inventory costs of the whole supply chain. SCOM is focused on the demand
of the chain aiming to reduce inventory holding costs, lower slacks, improve customer services,
and increase the benefits throughout the entire supply chain (Chaharsooghi et al., 2008).
The observed performance of human beings operating supply chains, whether in the field or
in laboratory settings, is usually far from optimal from a system-wide point of view (Lee &
Whang, 1999; Petrovic, 2008). This may be due to lack of incentives for information sharing,
bounded rationality, or possibly the consequence of individually rational behaviour that
works against the interests of the group. In a few cases, the researchers' focus is placed on
the coordination and integration of inventory policies between more than three stages
(Kimbrough et al., 2002; Mahavedan et al., 1997; Petrovic et al., 1999; Wang & Shu, 2005).
When there is no coordination among supply chain partners, each entity makes decision
based on its own criteria, which results in local optimization as opposed to global optimum.
So called Beer game (Sterman, 1989) is a well-known example of supply chain which has
attracted much attention from practitioners as well as academic researchers. Optimal
parameters of the beer game ordering policy, when customers demand increases, have been
analyzed in two different situations. It has been shown that minimum cost of the chain
(under conditions of the beer game environment) is obtained when the players have
Supply Chain Management
434
different ordering policies rather than a single ordering policy (Strozzi et al., 2007). Indeed,
most of previous works on order policy of beer game use genetic algorithms as optimization
technique (Kimbrough et al., 2002; Strozzi et al., 2007).
One ordering policy based on genetic algorithm under conditions of the Beer game
environment was introduced (Kimbrough et al., 2002); we call that GA-based algorithm in
this chapter. GA-based algorithm has some degrees of freedom contrary to 1-1 algorithm; In
the GA-based algorithm, each actor of chain can order based on its own rule and learns its
own ordering policy in coordination with other members with the aim of minimizing
inventory costs of the whole supply chain.
One limitation of the GA-based algorithm is the constraint of fixed ordering rule for each
member through the time. An attempt to mitigate the problem of fixed ordering rules was
initiated in (Chaharsooghi et al., 2008), in this study a reinforcement learning model is
applied for determining beer game ordering policy. The RL model enables agents to have
different rules throughout the time. In this book chapter we try to extract multiple rules for
each echelon in the supply chain using Genetic Algorithm.
This book chapter can be viewed as a contribution to the understanding of how to design
learning agents to discover insights for complicated systems, such as supply chains, which are
intractable when using analytic methods. In this chapter, the supply chain is considered as a
combination of various multi-agent systems collaborating with each other. Thus, SCOM can be
viewed as a multi-agent system, consisting of ordering agents. Each ordering agent tries to
make decisions on ordering size of the relevant echelon by considering the entire supply chain.
Agents interact and cooperate with each other based on a common goal. For example, in a
linear supply chain with four echelons (as considered in this chapter), there are four ordering
agents in SCOM system, each of which is responsible for ordering decisions in its particular
echelon. The main objective of ordering agents is to minimize long-term system-wide total
inventory cost of ordering from immediate supplier. This is a complex task because of the
uncertainty embedded in the system parameters (e.g. customer demand and lead-times) and
demand amplification effect (Forrester, 1961), known as ‘bullwhip effect’(Lee & Wu, 2006;
Fazel Zarandi & Avazbeigi ,2008; Fazel Zarandi et al., 2009).
Throughout this study, we use findings from the management science literature to
benchmark the performance of our agent-based approach. The purpose of the comparison is
to assess the effectiveness of an adaptable or dynamic order policy that is automatically
managed by computer programs—artificial agents. Also the results of the proposed model
are compared with two other existing methods in the literature (Chaharsooghi et al., 2008;
Kimbrough et al., 2002).
The rest of the book chapter is organized as follows. In section 2, the proposed GA for multi-
agent supply chain is described in detail. In section 3, the method is applied on different
cases and is compared with other models in the literature. Also in this section, the results are
discussed. Finally in the last section, conclusions are summarized.
2. Genetic algorithm with local search for multi-supply chain
2.1 Genetic Algorithm Pseudo Code
Genetic algorithms, originally called genetic plans, were initiated by Holland, his colleagues,
and his students at the University of Michigan in the 1970s as stochastic search techniques
based on the mechanism of natural selection and natural genetics, have received a great deal
of attention regarding their potential as optimization techniques for solving discrete
optimization problems or other hard optimization problems (Masatoshi, 2002).
A Multi-Agent Model for Supply Chain Ordering Management: An Application to the Beer Game
435
2.2 Representation of ordering policies in GA
In the proposed GA, each rules set (ordering policy) is encoded using binary system. In Fig.
2, the encoding schema is demonstrated. Each echelon in the supply chain has w rules. All
rules are represented in binary system with NumberOfBytes cells which NumberOfBytes is a
parameter of the model. The first cell in each echelon rule, stores the sign of the rule. 1 is for
positive and 0 is for negative. These cells are distinguished with grey colour. The next
NumberOfBytes-1 bits represent how much to order.
1. Initialization. A certain number of rules (Ordering Policies) are randomly generated
to form generation 0.
2. Pick the first binary rule from the current generation and decode the chosen rule to
obtain the decimal ordering rules.
3. Agents play the Beer Game according to their current decimal rules.
4. Repeat step (3), until the game period (say 35 weeks) is finished.
5. Calculate the total cost for the whole team and assign fitness value to the current
rule.
6. Pick the next rule from the current generation and repeat steps (3), (4) and (5) until
the performance of all the rules in the current generation have been evaluated.
7. Use GA with local search to generate a new generation of rules and repeat steps (2)
to (6) until the maximum number of generation is reached
Fig. 1. The pseudo code of the proposed GA
W rules –instead of one rule– enable each agent to have a more adaptive and dynamic
behaviour. The effect of different W’s on system objective function is also studied in next
sections.
Window
Basis (w)
Echelon 1 (Agent 1) Echelon 2 (Agent II) Echelon 3 (Agent III) Echelon 4 (Agent IV)
Rule 1
1 1 0 1 0
1 0 0 0 0
1 0 0 1 0
0 1 1 0 0
Rule 2
0 0 1 0 0
1 1 1 1 1
1 1 0 0 0
1 0 0 1 1
.
.
.
.
.
.
.
.
.
.
.
.
.
.
.
Rule w-1
1 0 1 0 0
1 0 1 0 1
0 1 0 1 0
0 1 0 1 0
Rule w
1 0 0 0 1
0 1 0 1 0
1 1 0 1 0
0 1 0 1 0
Fig. 2. Encoding Schema
When it is needed to run a supply chain using a specific ordering policy, first it is
mandatory that the chromosome of the ordering policy –similar to that shown in Fig. 2–
decoded to decimal system. Two examples of decoding procedure are shown in Fig. 3.
1 1 0 1 1
Æ
+13
0 1 1 0 0
Æ
-3
Fig. 3. Decoding Example
Supply Chain Management
436
2.3 Objective function
In the MIT Beer Game, each player incurs both inventory holding costs and penalty costs if
the player has a backlog. We now derive the total inventory cost function of the whole
supply chain. We begin with the needed notation. In the MIT Beer Game:
• N is the number of players and is 4
• IN
i
(t) is the net inventory of player i at the beginning of period t
• C
i
(t) is the cost of player i at period t
• H
i
is the inventory holding cost of player i, per unit per period (e.g., in the MIT Beer
Game, US$1 per case per week)
• P
i
is the penalty/backorder cost of player i, per unit per period (e.g., in the MIT Beer
Game, US$2 per case per week)
• S
i
(t) is the new shipment player i received in period t
• D
i
(t) is the demand received from the downstream player in week t (for the Retailer, the
demand from customers)
According to the temporal ordering of the MIT Beer Game, each player’s cost for a given
time period, e.g., a week, can be calculated as following: If IN
i
(t)≥0, then C
i
(t)=IN
i
(t)×H
i
else
C
i
(t)=|IN
i
(t)|×P
i
, where IN
i
(t)=IN
i
(t-1)+S
i
(t)-D
i
(t) and S
i
(t) is a function of both information
lead time and physical lead time. The total cost for the supply chain after M periods is
11
()
NM
i
it
Ct
==
∑∑
(1)
2.4 GA operators
1) Selection Operator: In the proposed GA, for selection of the chromosomes from the current
population, the tournament method is chose. In this method, at each time two chromosomes
are selected randomly from the current population and then the chromosome with the
minimum cost will be selected as a member of the next population. This process continues
until the required chromosomes are chosen for the new population.
2) Mutation Operator: Mutation in the proposed GA, includes the replacement of the zero-
cells with one-cells and vice versa. The Mutation type indicates that how many cells should
change.
3) Crossover Operator: Crossover operator randomly chooses 2*M columns (M: Crossover
Type) from the randomly chosen chromosome from the current population. Then, the
position of two columns changes in the selected chromosome.
4) Rearrangement Operator as Local Search of GA: Rearrangement operator, first randomly
choose a chromosome from the chromosomes selected by the Selection method, then choose
two cells randomly and change the positions of those cells randomly. If the new
chromosome had a smaller cost function, then the operator adds the new chromosome to the
new population. Otherwise, the operator repeats the process until an improvement occurs.
3. Results and conclusions
To validate the proposed system, some experiments are designed. The experiments and
their results are summarized in Tables 1 and 2. In the following, each experiment is
described in detail.
A Multi-Agent Model for Supply Chain Ordering Management: An Application to the Beer Game
437
Experiment
Number Of
Bytes
W Best Ordering Policy Lead Time
1 4 1 [0,0,0,0] 2 for all echelons
2 5 1 [0,1,2,2] 2 for all echelons
3 5 2 [1,0,6,0;1,8,4,9] 2 for all echelons
4 5 4 [0,2,12,4;4,8,5,8;0,4,4,8;0,9,3,2] 2 for all echelons
5 5 1 [0,0,1,0] Unifrom [0-4]
6 5 2 [0,0,1,4;0,0,2,0] Unifrom [0-4]
7 5 3 [0,0,1,0;0,0,2,0;0,1,2,4] Unifrom [0-4]
8 5 4 [0,0,0,7;0,0,9,9;0,6,4,0;0,0,0,1] Unifrom [0-4]
9 5 5 [0,0,10,1;0,0,4,8;0,0,2,2;0,1,6,5;0,01,3] Unifrom [0-4]
10 5 4 [0,1,2,15;0,3,8,0;0,2,4,10;0,1,8,3] Unifrom [0-4]
11 5 4 [0,0,4,0;0,0,6,8;0,0,4,4;0,0,9,0] Unifrom [0-4]
12 5 2 [0,0,3,7;0,0,5,3] Unifrom [0-4]
13 4 1 [1,1,1,1] 2 for all echelons
14 4 2 [0,1,4,2;0,5,2,3] 2 for all echelons
15 4 3 [0,3,0,5;0,2,5,1;0,4,5,3] 2 for all echelons
16 4 4 [0,1,3,3;1,3,5,6;0,2,6,6;0,0,7,3] 2 for all echelons
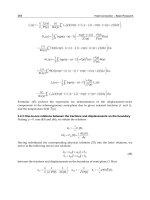
Table 1. Best ordering policies achieved by the method
In the first experiment, the performance of the multi-agent system is tested under
deterministic conditions. The customer demands four cases of beer in the first 4 weeks, and
then demands eight cases of beer per week starting from week 5 and continuing until the
end of the game (35 weeks). When facing deterministic demand with penalty costs for every
player (The MIT Beer Game), the optimal order for every player is the so-called ‘‘pass
order,’’ or ‘‘one for one’’ (1–1) policy—order whatever is ordered from your own customer.
As the result shows ([0, 0, 0, 0]) we found that the artificial agents can learn the 1–1 policy
consistently.
In the second experiment, we explored the case of stochastic demand where demand is
randomly generated from a known distribution, uniformly distributed between [0, 15]. Lead
time for all echelon is a constant value through the time and is 2. In this case the model is
compared with (Kimbrough et al., 2002) as the result show, the model outperforms
Kimbrough’s model.
In experiment 3 and 4, the influence of window basis (w) on the objective function of the
problem is studied. As it can be seen, more number of rules leads to smaller values of total
cost. This supports the idea that more number of rules enables the agents to be more
adaptive and flexible to the environmental changes.
Supply Chain Management
438
Experiment Demand
Best
Total
Cost
Worst
Total
Cost
Avera
ge
Total
Cost
1-1
Best
Total
Cost
GA
Best
Total
RL
Best
Total
Cost
1
All the demands are 8 except
4 first weeks which is 4
400 400 400 400 400 -
2 Uniform [0-15]
1536
1586 1561 3890 1820 -
3 Uniform [0-15] 1514 1570 1548 - - -
4 Uniform [0-15] 1458 1545 1487 - - -
5 Uniform [0-15]
2124
2124 2124 7463 2555 2417
6 Uniform [0-15] 2030 2030 2030 - - -
7 Uniform [0-15] 2010 2067 2030 - - -
8 Uniform [0-15] 1979 2010 1992 - - -
9 Uniform [0-15] 2056 2234 2134 - - -
10 Uniform [0-15]
1667
- - 5453 3109 3169
11 Uniform [0-15]
1896
- - 8397 4156 4038
12 Uniform [0-15]
1967
- - 7826 4330 4205
13
F(x) =|Max Demand*sin(x.Π/Period)|
793.715 793.715 793.715 - - -
14
F(x)= |Max Demand*sin(x.Π/Period)|
744.826 774.237 762.079 - - -
15
F(x)= |Max Demand*sin(x.Π/Period)|
779.689 799.455 789.174 - - -
16
F(x)= |Max Demand*sin(x.Π/Period)|
644.872 699.865 668.943 - - -
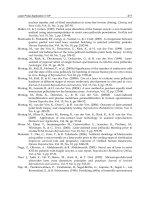
Table 2. Comparison of models with other models in the literature
In experiments 5 to 9, the model is evaluated under more challenging conditions. The
demand and lead time are both nondeterministic and have distribution function uniform [0,
15] and [0, 4] respectively. The results are compared with 1-1 ordering policy (Chaharsooghi
et al., 2008; Kimbrough et al., 2002). The best objective function achieved by the model is
1979 which is much smaller than (Chaharsooghi et al., 2008) results (2417). Again the
positive effect of window basis can be seen as the number of window basis increases to
some extent the best objective function value decreases. A trend stops at window basis equal
to 5. This can be due to the exponential growth in the search space, which makes the search
process so complex for GA (with the current encoding schema 25*5*4 = 2100 possible
solutions exist).
A Multi-Agent Model for Supply Chain Ordering Management: An Application to the Beer Game
439
Fig. 4. Customer Demand in comparison with retailer
Fig. 5. Customer Demand in comparison with wholeseller
Fig. 6. Customer Demand in comparison with Distributer
Supply Chain Management
440
Fig. 7. Customer Demand in comparison with manufacturer
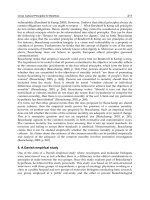
In experiments 10, 11 and 12, the proposed window basis model is again compared with 1-1
ordering policy. 1-1 ordering policy is described in (Kimbrough et al., 2002; Sterman, 1989).
In all cases, the model has a better performance. The ordering values of four echelons base
on the best ordering policy achieved by the model for experiment 10 are depicted in fig. 4, 5,
6 and 7.
In the last 4 experiments, the model is applied on a periodic function with the function of
F(x)=|MaxDemand*sin(x.Π/Period)| (2)
and the impact of different window basis is studied. in this function Max Demand is 7 and
period is 8. As table 2 shows, models with window basis with the 2 multiples have a better
performance.
It should be noted that in the first 12 experiments, the genetic population is 100, the number
of generation is 400, the mutation, crossover and the rearrangement ration are 0.2. In the last
four experiments, the genetic population is 300, the number of generation is 400, the
crossover and mutation ratio are 0.3 and the rearrangement ratio is 0.2.
4. Conclusion
In this a new intelligent multi-agent system is proposed for determination of the best
ordering policy in order to minimize the cost of supply chain.
The model is compared with previous models in the literature and as the results show, the
model outperforms all the previous models.
The best ordering policy is obtained by a new genetic algorithm which is equipped with
some local searches. One limitation of the previous presented GA-based algorithms is the
constraint of fixed ordering rule for each member through the time. To resolve this problem
a new concept –window- is introduced in this book chapter. Application of the window
basis enables the agents to have different ordering rules throw the time. Experiment results
prove that the new multi-agent system is capable of finding patterns in nondeterministic
and periodic data both.
A Multi-Agent Model for Supply Chain Ordering Management: An Application to the Beer Game
441
5. References
Chaharsooghi, S.K., Heydari, J. & Zegordi, S. H. (2008). A reinforcement learning model for
supply chain ordering management: An application to the beer game. Decision
Support Systems. Vol. 45, page numbers 949–959.
Fazel Zarandi, M.H. & Avazbeigi, M. (2008). A Fuzzy Logic Approach to prove
Bullwhip Effect in Supply Chains, Proceedings of AMERICA, Toronto, ON.,
Canada.
Fazel Zarandi, M.H., Avazbeigi, M. & Turksen, I. B. (2009). An intelligent fuzzy Multi-Agent
System for reduction of bullwhip effect in supply chains, Proceedings of NAFIPS09,
Cincinnati, Ohio, USA.
Forrester, J. W. (1961). Industrial Dynamics, Cambridge, MIT Press, Massachusetts.
Giannoccaro, I., Pontrandolfo, P. & Scozzi, B. (2003). A fuzzy echelon approach for inventory
management in supply chains. European Journal of Operational Research, Vol. 149,
page numbers 185–196.
Kimbrough, S.O., Wu, D. J. & Zhong, F., 2002. Computers play the beer game: can artificial
agents manage supply chains?. Decision Support Systems, Vol. 33, page numbers
323–333.
Lee, H. & Whang, S. (1999). Decentralized multi-echelon supply chains: incentives and
information. Management Science, Vol. 45(5), page numbers 633– 640.
Lee, H. T. & Wu, J. C. (2006). A study on inventory replenishment policies in a two echelon
supply chain system. Computers & Industrial Engineering, Vol. 51, page numbers
257–263.
Masatoshi, S. (2002). Genetic Algorithms and Fuzzy Multiobjective Optimization, (Operations
Research Computer Science Interfaces Series), Massachusetts: Kluwer Academic
Publishers.
Mahadevan, S., Marchalleck, N., Das, K. T. & Gosavi, A. (1997). Self-improving factory
simulation using continuous-time average-reward reinforcement learning.
Proceedings of the 14th International Conference on Machine Learning, page numbers
202–210.
Petrovic, D., Roy, R. & Petrovic, R. (1999). Modeling and simulation of a supply chain in an
uncertain environment. European Journal of Operational Research, Vol. 109, page
numbers 299–309.
Petrovic, D., Xie, Y., Burnham, K. & Petrovic, R. (2008). Coordinated control of distribution
supply chains in the presence of fuzzy customer demand. European Journal of
Operational Research, Vol. 185, page numbers 146–158.
Sterman, J. (1989). Modeling managerial behavior: misperceptions of feedback in a dynamic
decision making experiment. Management Science, Vol. 35 (3), page numbers 321–
339.
Strozzi, F., Bosch, J. & Zaldívar, J. M. (2007). Beer game order policy optimization under
changing customer demand. Decision Support Systems, Vol. 42, page numbers 2153–
2163.
Wang, J. & Shu, Y F. (2005). Fuzzy decision modeling for supply chain management. Fuzzy
Sets and Systems, Vol. 150, page numbers 107–127.
Supply Chain Management
442
Wang, J. & Shu, Y F. (2007). A possibilistic decision model for new product supply chain
design, Journal of Operational Research, Vol. 177, page numbers 1044–1061
21
A Collaborative Vendor – Buyer Deteriorating
Inventory Model for Optimal Pricing, Shipment
and Payment Policy with
Two – Part Trade Credit
Nita H. Shah
1
and Kunal T. Shukla
2
1
Department of Mathematics, Gujarat University, Ahmedabad – 380009, Gujarat,
2
JG College Of Computer Application, Drive – in road, Ahmedabad – 380054, Gujarat,
India
1. Introduction
The classical economic order quantity model of Wilson’s was developed with the assumption
that the buyer must pay off immediately on arrival of the goods in the inventory system. In
fact, offering buyers to delays payment for goods received is considered as a sales promotional
tool in the business world. With offer of trade credit, vendor increases sales, attracts more
buyers and reduces on – hand stock level. Under this marketing strategy, the time of the
buyer’s capital tied up in stock reduced which eventually reduces the buyer’s holding cost of
finance. In addition, during this allowable credit period, the buyer can earn interest on the
generated revenue. For the small – scale industries having a limited finance, the trade credit
acts as a source of short – term funds. Goyal (1985) developed an economic order quantity
model with a constant demand rate under the condition of permissible delay in payments.
After that numbers of variants of the trade credit problem have been analyzed. For example
Shah (1993a, 1993b), Aggarwal and Jaggi (1995), Kim et al. (1995), Jamal et al. (1997), Shinn
(1997), Chu et al. (1998), Chen and Chung (1999), Chang and Dye (2001), Teng (2002), Chung
and Huang (2003), Shinn and Hwang (2003), Chung and Liao (2004, 2006), Chung et al. (2005),
Teng et al. (2005), Ouyang et al. (2005) and their cited references. For up – to day available
literature on permissible delay period, refer to the article by Shah et al. (2010).
The above cited references assume that the vendor offer the buyer a “one – part” trade
credit, i.e. the vendor offers a permissible delay period. If the account is settled within this
period, no interest is charged to the buyer. As a result, with no incentive for making early
payments, and earning interest through generated revenue during the credit period, the
buyer postpones payment up to the last day of the permissible period offered by the vendor.
As an outset, from the vendor’s end, offering trade credit leads to delayed cash inflow and
increases the risk of cash flow shortage and bad debt. To increase cash inflow and reduce
the risk of a cash crisis and bad debt, the vendor may offer a cash discount to attract the
buyer to pay for goods earlier. i.e. the vendor offers a “two – part” trade credit to the buyer
to balance the trade off between delayed payment and cash discount. For example, under an
agreement, the vendor agrees to a 2% discount to the buyer’s purchase price if payment is
made within 10 days. Otherwise, full payment is to be settled within 30 days after the
Supply Chain Management
444
delivery. In financial management, this credit is denoted as “2|10 net 30”. If the vendor only
offers the buyer a 30 days credit period, i.e. “one – part” trade credit, then this is denoted as
“net 30” (Brigham, 1995). The papers related to this credit policy are by Lieber and Orgler
(1975), Hill and Riener (1979), Kim and Chung (1990), Arcelus and Srinivasan (1993),
Arcelus et al. (2001, 2003). Ouyang et al. (2002), Chang (2002) and Huang and Chung (2003)
developed inventory models when two – credit policy is offered by the vendor to the buyer.
The above cited model’s are derived either from the vendor’s or the buyer’s end. However, the
two players may have their own goals. The decision taken from the buyer’s end may not be
agreeable to vendor and vice versa. Lee et al. (1997) argued that without coordinated inventory
management in the supply chain may result in excessive inventory investment, revenue
reduction and delays in response to customer satisfaction. Therefore, the joint discussion is
more beneficial as compared to the individual decision. Goyal (1976) first developed a single
vendor – single buyer integrated inventory model. Banerjee (1986) extended Goyal’s (1976)
model under assumption of a lot – for – lot production for the vendor. Later, Goyal (1988)
established that if vendor produces an integer multiple of the buyer’s purchase quantity then
the inventory cost can be reduced. Lu (1995) generalized Goyal’s (1988) model by relaxing the
assumption that the vendor can supply to the buyer only after finishing the entire lot size.
Bhatnagar et al. (1993), Goyal (1995), Viswanathan (1998), Hill (1997, 1999), Kim and Ha (2003),
Kalle et al. (2003), Li and Liu (2006) developed more batching and shipping policies for an
integrated inventory model. However, these articles did not incorporate the effect of trade
credit on the integrated optimal decision. Abad and Jaggi (2003) developed a vendor – buyer
integrated model assuming lot – for – lot production under a permissible delay in payments.
Later, Shah (2009) extended Abad and Jaggi’s(2003) model for deteriorating items. In both the
articles, the vendor offered a “one – part” trade credit to the buyer.
Ho et al. (2008) studied impact of a “two – part” trade credit policy in the integrated
inventory model. This model assumed that units in inventory remain of 100% utility during
the cycle time. However, the products like medicines and drugs, food products, vegetables
and fruits, fashion goods, x – ray films etc loose its 100% utility in due course of time. In this
chapter, we analyze effect of a “two – part” trade credit policy in the integrated inventory
model when units are subject to constant deterioration and demand is retail price sensitive.
The supplier offers the buyer a cash discount if payment is made before an allowable period,
and if the buyer does not pay within the allowable period, the full account against purchases
made before the delay payment due date. The joint profit is maximized with respect to the
optimal payment policy, selling price, lot – size and the number of shipments from vendor
to buyer in one production run. An algorithm is developed to determine the optimal policy.
Numerical examples are given to validate the theoretical results. The sensitivity analysis of
the optimal solutions with respect to model parameters is also carried out.
2. Assumptions and notations
The proposed model is formulated using the following assumptions and notations.
1. The integrated inventory system comprises of a single – vendor and single buyer for a
single item.
2. Shortages are not allowed.
3. The inventory holding cost rates excluding interest charges for the vendor is I
v
and for
the buyer is I
b
.
4. To accelerate the cash inflow and reduce the risk of bad debt, the vendor offers a
discount β (0 < β < 1) off the purchase price, if the buyer settles the account within time
M
1
. Otherwise, the full account is due within time M
2
, where M
2
>M
1
≥0.
A Collaborative Vendor – Buyer Deteriorating Inventory Model
for Optimal Pricing, Shipment and Payment Policy with Two – Part Trade Credit
445
5. The vendor’s unit production cost is $ C
v
and unit sale price is $ C
b
. The buyer’s unit
retail price is $ P. Here
(1 )
bbv
PC C C
β
>>− >.
6. During the allowable credit period to the buyer, the vendor opts to give up an
immediate cash inflow until a later date. Thus, the vendor endures a capital
opportunity cost at a rate I
vo
during the time between delivery and payment of the item.
7. During period [M
1
, M
2
], a cash flexibility rate
vc
f
is available to quantize the advantage
of early cash income for the vendor.
8. During the credit period (i.e. M
1
or M
2
), the buyer earns interest at a rate of I
be
on the
revenue generated by selling the product.
9. The demand rate for the item is a decreasing function of the sale price and is given
by
()RP aP
η
−
=
, where a > 0 is scaling demand, and η > 1 is a price – elasticity
coefficient.
10.
The capacity utilization “ρ” is defined as the ratio of the demand rate, R(P) to the
production rate p(P), i.e. ρ = R(P)/p(P) where ρ < 1 and is fixed.
11.
The buyer’s cycle time is T, order quantity is Q per order.
12.
The buyer’s ordering cost per order is A
b
.
13.
During the production period, the vendor produces in batches of size nQ (where n is a
positive integer) and incurs a batch set up cost A
v
. After the production of first Q units,
the vendor ships them to the buyer and then makes continuous shipping at every T-
units of time until the vendor’s inventory level depletes to zero.
14.
The units in inventory deteriorate at a constant rate, θ (0 < θ < 1). The deteriorated can
neither be repaired nor replaced during the cycle time T.
3. Mathematical model
The inventory on hand depletes due to price – sensitive demand and deterioration of units.
The rate of change of inventory at any instant of time ‘t’ is governed by the differential
equation,
()
() (); 0
dI t
RP It t T
dt
θ
=
−− ≤≤
with initial condition I(0) = Q and boundary condition I(T) = 0. The solution of the
differential equation is
{}
()
()
() 1; 0
Tt
RP
It e t T
θ
θ
−
=
−≤≤
and procurement quantity, Q is
{}
()
(0) 1
T
RP
QI e
θ
θ
=
=−
3.1 Vendor’s total profit per unit time
During each production run, the vendor produces in batches of the size nQ with a batch set
up cost A
v
. The cycle length of the vendor is nT- units. Therefore, the vendor’s set up cost
per unit time is (A
v
/nT). Using method given by Joglekar (1988), with the unit production
Supply Chain Management
446
cost C
v
, the inventory holding cost rate excluding interest charges I
v
and capital opportunity
cost per $ per unit time I
vo
, the vendor’s carrying cost per unit time is
[]
[]
0
()
(1)(1) ()
()
()( 1)(1 ) 1
T
vv vo
T
vv vo
CI I
nItdt
T
CI I
RP n e T
T
θ
ρρ
ρρ θ
+
−−+
+
⎡
⎤
=
−−+ −−
⎣
⎦
∫
For each unit of item, the vendor charges
(
)
(
)
1
j
b
KC
β
− if the buyer pays at time M
j
,j=1,2,
K
1
= 1 and K
2
= 0. The opportunity cost at the finance rate I
vo
per unit time for offering trade
credit is
(
)
(
)
1
jbvoj
Q
KCIM
T
β
−⋅⋅⋅. However, if the buyer pays at M
1
- time, during M
2
– M
1
the vendor can use the revenue ((1 – β)C
b
) to avoid a cash flow crisis. The advantage gain
per unit time from early payment at a cash flexibility rate f
vc
is
(
)
21
(1 ) ( ) /
jbvc
KC
f
MMQT
β
⋅− ⋅ ⋅ − .
Thus, the vendor’s total profit per unit time is the revenue generated plus the advantage
from early payment minus production cost, set up cost, inventory holding cost and
opportunity cost for offering trade credit.
()
[]
2
21
12
() 1
()()
(1)(1) 1
(1 ) (1 ) ( ) ,
1,2; 1, 0
v
jjbv
T
vv vo
jvoj j bvc
A
TVP n K C C
TTnT
CI I RP
neT
T
KvIM K CfMM
TT
jKK
θ
β
ρρ θ
θ
ββ
=− − −
+
⎡
⎤
−
−−+ −−
⎣
⎦
−− + − −
===
(1)
3.2 Buyer’s total profit per unit time
The buyer’s ordering cost is A
b
for each order of Q – units, so the ordering cost per unit time
is (A
b
/T). The inventory holding cost excluding interest charges per unit time is
(
)
2
1()
1
jbb
T
KCIRP
eT
T
θ
β
θ
θ
⎛⎞
−
⎜⎟
⎡
⎤
−−
⎣
⎦
⎜⎟
⎝⎠
On the basis of length of the payment time, two cases arise: (i) T< M
j
and (ii) T ≥ M
j
; j=1,2
These two cases are shown in Figure 1.
Case: (i) T < M
j
; j = 1, 2.
Here, the buyer’s cycle time ends before the payment time. So buyer does not pay
opportunity cost for the items kept in stock. The buyer earns interest at the rate of I
be
on the
revenue generated; hence, the interest earned per unit time is,
()
()
2
0
()
11
() ( ) 1
2
T
T
be
be be j j
PI R P
T
PI R P tdt PI Q M T e M T
TT
θ
θ
⎡
⎤
⎡⎤
+−= +−−
⎢
⎥
⎢⎥
⎢
⎥
⎣⎦
⎣
⎦
∫
A Collaborative Vendor – Buyer Deteriorating Inventory Model
for Optimal Pricing, Shipment and Payment Policy with Two – Part Trade Credit
447
Fig. 1. Inventory and interest earned for the buyer under trade credit
Case: (ii) T ≥ Mj; j = 1, 2
In this case, the buyer’s allowable payment time ends on or before the inventory is depleted
to zero. The interest earned per unit time is
2
0
()
()
2
j
M
be
j
be
PI R P M
PI
RPtdt
TT
=
∫
.
After the due date M
j
, the buyer pays interest charges at the rate of I
bc
. Therefore, the interest
charges payable per unit time is,
(
)
(
)
()
2
11()
() ( ) 1
j
j
T
j b bc j b bc
TM
j
M
KCI KCIRP
Itdt e T M
T
T
θ
ββ
θ
θ
−
−−
⎡
⎤
=
−− −
⎢
⎥
⎣
⎦
∫
The buyer purchase cost per unit time is ((1 – K
j
β) C
b
Q/T) and revenue generated per unit
time is (PQ/T). Therefore, the buyer’s total profit per unit time is revenue generated plus
interest earned minus the total cost comprises of the purchase cost, ordering cost, inventory
holding cost excluding interest charges and interest charges payable, i.e.
1
2
(,)
(,) ; 1,2
(,)
jj
j
jj
TBP P T T M
TBP P T j
TBP P T T M
<
⎧
⎪
==
⎨
≥
⎪
⎩
(2)
Where
Supply Chain Management
448
()
()
()
()
1
2
2
(,) 1
1()
1
()
1
1
2
bb
jj
jbb
T
T
be
j
CQ A
PQ
TBP P T K
TTT
KCIRP
eT
T
PI R P
T
eMT
T
θ
θ
β
β
θ
θ
θ
=−− −
−
⎡⎤
−−−
⎣⎦
⎡
⎤
++−−
⎢
⎥
⎢
⎥
⎣
⎦
(3)
And
()
()
()
2
2
2
()
2
(,) 1
1()
()
1
2
1()
()1
j
bb
jj
jbb
be
j
T
jbbc
TM
j
CQ A
PQ
TBP P T K
TTT
KCIRP
PI R P M
eT
T
T
KCIRP
eTM
T
θ
θ
β
β
θ
θ
β
θ
θ
−
=−− −
−
⎡⎤
−−−+
⎣⎦
−
⎡
⎤
−−−−
⎢
⎥
⎣
⎦
(4)
3.3 The joint total profit per unit time
When the buyer and vendor opt for the joint decision, the joint total profit per unit time is,
1
2
(, ,)
(, ,) ; 1,2
(, ,)
jj
j
jj
TP n P T T M
TP n P T j
TP n P T T M
<
⎧
⎪
==
⎨
≥
⎪
⎩
(5)
Where
()
()
[]
()
()
()
11
2
21
2
2
(, ,) () (,)
1
1
()()
(1)(1) 1
(1 ) ( )
()
1
1
2
1()
1
(
jjj
jbvoj
v
vb
T
vv vo
jbvc
T
be
j
jbb
T
be
TP n P T TVP n TBP P T
KCIMQ
A
Q
PC A
TTn T
CI I RP
neT
T
KCfMMQ
T
PI R P
T
eMT
T
KCIRP
eT
T
PI R
θ
θ
θ
β
ρρ θ
θ
β
θ
β
θ
θ
=+
−
⎛⎞
=− − + −
⎜⎟
⎝⎠
+
⎡
⎤
+
−−+ −−
⎣
⎦
−−
+
⎡⎤
++−−
⎢⎥
⎢⎥
⎣⎦
−
⎡⎤
−−−
⎣⎦
+
()
()
2
)
1
1
2
T
j
P
T
eMT
T
θ
θ
⎡⎤
+−−
⎢⎥
⎢⎥
⎣⎦
(6)
And
A Collaborative Vendor – Buyer Deteriorating Inventory Model
for Optimal Pricing, Shipment and Payment Policy with Two – Part Trade Credit
449
()
()
[]
()
()
22
2
2
21
2
()
2
(, ,) () (,)
1
1
()()
(1)(1) 1
(1 ) ( ) ( )
2
1()
1
1()
j
jjj
jbvoj
v
vb
T
vv vo
jbvc bej
jbb
T
jbc
TM
TP n P T TVP n TBP P T
KCIMQ
A
Q
PC A
TTn T
CI I RP
neT
T
KCfMMQPIRPM
TT
KCIRP
eT
T
KvIRP
e
T
θ
θ
θ
β
ρρ θ
θ
β
β
θ
θ
β
θ
−
=+
−
⎛⎞
=− − + −
⎜⎟
⎝⎠
+
⎡
⎤
−
−−+ −−
⎣
⎦
−−
++
−
⎡⎤
−−−
⎣⎦
−
−−()1
j
TM
θ
⎡⎤
−−
⎢⎥
⎣⎦
(7)
Assuming θ to be very small, ignoring θ
2
and its higher powers, we get
()
(
)
[]
()
1
21
1()
()1
22
()()(1)(1)
()
1
222
1
1()1
2
(1 ) ( ) ( ) 1
2
jbb
jv
vv vo
be
j
v
jbvoj b
jbvc
KCIRPT
T
TP P c R P
CI I RP n T
PI R P
TT
M
T
A
T
KCIMRP A
Tn
T
KCfMMRP
β
θ
ρρ
θ
θ
β
θ
β
−
⎛⎞
=− + −
⎜⎟
⎝⎠
+−−+
⎡
⎤
⎛⎞
−++−
⎜⎟
⎢
⎥
⎝⎠
⎣
⎦
⎛⎞
⎛⎞
−− + − +
⎜⎟
⎜⎟
⎝⎠
⎝⎠
⎛⎞
+− − +
⎜⎟
⎝⎠
(6a)
Also
()
()
[]
()
()
()
2
2
21
()1 1 ()1
22
()()(1)(1)
1
2
()
(1 ) ( ) ( ) 1
22
1()()
1()
2
1()
jv jbvoj
vv vo
v
b
be j
jbvc
jbbbc
jbbc j
jbbc
TT
TP P C R P K C I M R P
CI I RP n T
A
A
Tn
PI R P M
T
KCfMMRP
T
KCIIRPT
KCIRPM
KCIRPM
θθ
β
ρρ
θ
β
β
β
β
⎛⎞ ⎛⎞
=− + −− +
⎜⎟ ⎜⎟
⎝⎠ ⎝⎠
+−−+
⎛⎞
−−+
⎜⎟
⎝⎠
⎛⎞
+− − ++
⎜⎟
⎝⎠
−+
−−−
−
+
2
2
j
T
(7a)
The problem now is to compute the optimal values of n, P and T such that TP
j
(n, P, T); j=1, 2
in equation (5) is maximized.
Supply Chain Management
450
4. Solution methodology
For fixed P and T, the second order partial derivative of equation (5) with respect to ‘n’ is,
2
23
(, ,)
2
0
j
v
TP n P T
A
nnT
∂
−
=<
∂
for j = 1, 2 suggest that TP
j
(n, P, T) is a concave function in ‘n’.
This guarantees that the search for the optimal shipment number n* is reduced to find a
local optimal solution.
4.1 Determination of the optimal cycle time ‘T’ for any given ‘n’ and ‘P’
For given n and P, the partial derivative of TP
j1
(n, P, T) in (6 – a) with respect to T,
2
1
23
(, ,)
2
0
j
v
b
TP n P T
A
A
n
TT
∂
⎛⎞
=− + <
⎜⎟
∂
⎝⎠
suggests that TP
j1
(n, P, T) is a concave function in T.
Hence, there exists unique value of T = T
j1
(n, P) (say) which maximizes TP
j1
(n, P, T). T
j1
(n, P)
can be obtained by setting
1
(, ,)
0
j
TP n P T
T
∂
=
∂
and is given by,
()
()()
()
()
() ( )
() ( )
1
21
2
11
() 1 1
11
v
b
j
vv vo v
jbvoj j bvc
jbb be j
A
A
n
T
CI I n PC
RP K CI M K C f M M
KCIPI M
ρρ θ
β
θβ θ
βθ
⎛⎞
+
⎜⎟
⎝⎠
=
⎧
⎫
+⎡− −+⎤−−
⎣⎦
⎪
⎪
⎪
⎪
+− − − −
⎨
⎬
⎪
⎪
+− + −
⎪
⎪
⎩⎭
(8)
To ensure T
j1
(n, P) < M
j
, we substitute (8) into inequality T
j1
(n, P) < M
j
and obtain
()
()()
()
() ( )
()( )( )
2
21
11
()
1
2
11
vv vo v
j
v
bjbvc
jbbvoj be j
CI I n PC
RPM
A
AKCfMM
n
KCIIM PI M
ρ
ρθ
βθ
βθθ
⎡
⎤
+⎡− −+⎤−−
⎣⎦
⎢
⎥
⎢
⎥
+< − − −
⎢
⎥
⎢
⎥
+− + + −
⎣
⎦
(9)
Substituting (8) into (6), the joint total profit for case 1 is,
TP
j1
(n, P) = TP
j
(n, P, T
j1
(n, P)) (10)
Furthermore, from (9), we have T
j2
(n, P) ≥ M
j
if and only if
()
()()
()
() ( )
()( )( )
2
21
11
()
1
2
11
vv vo v
j
v
bjbvc
jbbvoj be j
CI I n PC
RPM
A
AKCfMM
n
KCIIM PI M
ρ
ρθ
βθ
βθθ
⎡
⎤
+⎡− −+⎤−−
⎣⎦
⎢
⎥
⎢
⎥
+≥ − − −
⎢
⎥
⎢
⎥
+− + + −
⎣
⎦
(11)
The second order partial derivative of TP
j2
(n, P, T) in (7 – a) is,
A Collaborative Vendor – Buyer Deteriorating Inventory Model
for Optimal Pricing, Shipment and Payment Policy with Two – Part Trade Credit
451
()
()
2
2
2
23
,,
1
() 1 2 0
j
v
jjbbcbe b
TP n P T
A
RPM K CI PI A
n
TT
β
∂
⎧⎫
⎛⎞
⎡⎤
=
−−−++<
⎨⎬
⎜⎟
⎣⎦
∂
⎝⎠
⎩⎭
(12)
which suggests that for fixed n and P, TP
j2
(n, P, T) is a concave function in T.
By solving the equation
(
)
2
,,
0
j
TP n P T
T
∂
=
∂
, we obtain the value of T= T
j2
(n, P) (say) which
maximizes TP
j2
(n, P, T) and is given by
()
()
()() ( ) ( )
()
()( )
22
2
21
2()1()
11 1
()
1
v
bbe j jbbc j
j
vv vo j bvc
vjbbbcvoj
A
APIRPM KCIRPM
n
T
CI I n K Cf M M
RP
PC K CI I I M
β
ρ
ρβ θ
θβ θ
⎛⎞
+− +−
⎜⎟
⎝⎠
=
⎧
⎫
+⎡− −+⎤− − −
⎣⎦
⎪
⎪
⎨
⎬
−− +− + +
⎪
⎪
⎩⎭
(13)
Substituting (13) into (7 – a), the joint total profit for case 2 is
TP
j2
(n, P) = TP
j
(n, P, T
j2
(n, P)) (14)
For simplicity, define
()
()()
()
()( )
() ( )
()
2
21
11
()
1
2
11
vv vo v
j
jjbbbcvoj
j
bvc be
j
CI I n PC
RPM
KCII IM
KCfMMPIM
ρρ θ
βθ
βθθ
⎡
⎤
+⎡− −+⎤+−
⎣⎦
⎢
⎥
⎢
⎥
Δ= + − + +
⎢
⎥
⎢
⎥
+− − + −
⎢
⎥
⎣
⎦
, j =1,2 (15)
Since, M
2
> M
1
≥ 0, K
1
= 1 and K
2
= 0, we have Δ
2
> Δ
1
.
Theorem 1: For given n and P,
a.
When
1
v
b
A
A
n
+
<Δ
, if max {TP
11
(n, P), TP
21
(n, P)} = TP
11
(n, P) then the optimal
payment time is M
1
and optimum cycle time is TP
11
(n, P). Otherwise, the optimal
payment time is M
2
and optimum cycle time is TP
21
(n, P).
b.
When
12
v
b
A
A
n
Δ≤ + <Δ
, if max {TP
21
(n, P), TP
12
(n, P)} = TP
21
(n, P) then the
optimal payment time is M
2
and optimum cycle time is TP
21
(n, P). Otherwise the
optimal payment time is M
1
and optimum cycle time is TP
12
(n, P)
c.
When
2
v
b
A
A
n
+
≥Δ
, if max {TP
12
(n, P), TP
22
(n, P)} = TP
12
(n, P) then the optimal
payment time is M
1
and optimum cycle time is TP
12
(n, P) Otherwise the optimal
payment time is M
2
and optimum cycle time is TP
22
(n, P)
Proof: It immediately follows from (9), (11) and (15).
4.2 Determination of the buyer’s optimal retail price for any given n
For computing optimal value of retail price; P we follows methodology given by Teng et al.
(2005).
Supply Chain Management
452
Define
f
j
(P) =Δ
j
, j = 1, 2 (16)
It is easy to check that f
j
(P) is strictly decreasing function of P for given n. Also
lim
()
0
j
fP
P
=∞
→
and
lim
() 0
j
fP
P
=
→∞
for fixed n, guarantees that there exist a unique value
of P
jo
such that
()
v
jj
ob
A
f
PA
n
=+
(17)
Then, (9) and (11) reduce to
if and only if P < P
jo
, then T
j1
(n, P) < M
j
(18)
and
if and only if P ≥ P
jo
, then T
j2
(n, P) ≥ M
j
(19)
respectively.
Now our problem is to find the optimal value of retail price; P which maximize the joint
total profit
()
(
)
()
1
2
,,
,1,2
,,
jjo
j
jjo
TP n P if P P
TP n P j
TP n P if P P
⎧<
⎪
==
⎨
≥
⎪
⎩
(20)
For fixed n, the optimal value of P which maximizes TP
ji
(n, P), j = 1, 2 and i =1,2, can be
obtained by first order necessary condition
(
)
,
0
ji
TP n P
P
∂
=
∂
and examining the second order
sufficient condition
()
2
2
,
0
ji
TP n P
P
∂
<
∂
for concavity.
From the above arguments, we outline the computational algorithm to find the optimal
solution (n*, P*, T*).
Computational algorithm
Step 1
Set n =1.
Step 2 For j = 1,2.
i.
Determine P
jo
by solving (17).
ii.
If there exists a P
j1
such that P
j1 <
P
j0,
(
)
1
,
0
j
TP n P
P
∂
=
∂
and
()
2
1
2
,
0,
j
TP n P
P
∂
<
∂
then compute
T
j1
(n, P
j1
) using (8) and T
j1
(n, P
j1
) using (10).
Otherwise, set TP
j1
(n, P
j1
, T
j1
(n, P
j1
)) = 0.
iii.
If there exists a P
j2
such that P
j2
≥ P
j0
,
()
2
,
0
j
TP n P
P
∂
=
∂
and
()
2
2
2
,
0,
j
TP n P
P
∂
<
∂
then compute
T
j2
(n, P
j2
) using (13) and T
j2
(n, P
j2
) using (14).
Otherwise, set TP
j2
(n, P
j2
, T
j2
(n, P
j2
)) = 0.
A Collaborative Vendor – Buyer Deteriorating Inventory Model
for Optimal Pricing, Shipment and Payment Policy with Two – Part Trade Credit
453
Step 3 Set
() ()
(
)
()
()
max
,, 1,2 ,, ,
1,2
nn
i
jj
i
j
i
j
i
TPnP T j TP nP T nP
i
==
=
then (P
(n)
, T
(n)
) is the optimal
solution for given n.
Step 4 If TP (n, P
(n)
, T
(n)
) ≥ TP (n-1, P
(n-1)
, T
(n-1)
), then go to step 5. Otherwise, go to step 6.
Step 5 Set n = n + 1, go to step 2.
Step 6 Set TP (n, P
*
, T
*
) ≥ TP (n-1, P
(n-1)
, T
(n-1)
), then (n*, P*, T*)is the optimal solution.
Knowing the optimal solution (n*, P*, T*), the optimal order quantity per order for the buyer
Q* can be obtained using
{}
*
*
*
()
1
T
RP
Qe
θ
θ
=
− .
5. Numerical illustration
Example 1 In order to validate the solution procedure, consider an integrated inventory
system with following parametric values: a=250,000,
ρ=0.9, η=1.25, C
v
=$2/unit,
C
b
=$4.5/unit, A
v
=$1000/Set up, A
b
=$300/Order, I
v
=0.08/$/annum, I
b
=0.08/$/annum,
I
vo
=0.09/$/annum, I
bc
=0.16/$/annum, I
be
=0.12/$/annum and f
vc
=0.17/$/annum.
Consider, a trade credit term “2|10 net 30”, i.e. M
1
=10 days, M
2
=30 days and β=2% is
offered by the vendor to the buyer. The deterioration rate of units in inventory is 5%.
Using the computational procedure, the maximum total joint profit of the integrated system
is TP(n*, P*, T*) = $ 109628.38. The buyer makes the payment within 10 days and avails of
2% discount in purchase cost, the retail price is P*=$ 10.6616/unit, the replenishment cycle
time T* = T
12
= 0.2330 year = 85.04 days and the ordering quantity Q*=3041.09units/order.
The optimal shipment from the vendor to the buyer us n*= 10.
Example 2 In Table 1, we study the effects of credit terms M
1
and M
2
. The no trade credit is
taken as a bench mark. The relationship between credit terms and profits of buyer, vendor
and total are calculated.
It is observed that the profit gain in percentage is positive for the integrated decision. i.e.
total profit for the integrated decision under the two – part trade credit policy is beneficial
than the total profit when no credit is offered. It is also observed that the profit gain in
percentage is not always positive for the vendor. Under credit terms “2|10, net 30” or if
vendor extends the due date to M
2
=30 days after the delivery, the vendor’s profit gains in
percentage are negative.
Table 1 also suggests that if the vendor offers the payment due date at 30 days then offering
a 2% discount can encourage the buyer to settle the payment earlier. However, if the vendor
extends the due date to 60 days or 90 days, the integrated profit will be maximized as the
buyer pays at the end of the net period. The offer of due date at 60 days or 90 days after
delivery by the vendor will not accelerate cash inflows. Hence, in an integrated supply
chain, the vendor needs to decide the credit policy very carefully to get mutual benefit from
a two – part trade credit scenario.
Example 3 Using the same data as in Example 1, we compare the impact of trade credit for
independent and coordinated decision in Table 2. The optimal solutions of “cash on
delivery” (i.e.M
1
= M
2
= 0 and β = 0) and “2|10 net 30” are computed.
In independent decision, buyer is dominant decision maker and then the vendor defines his
policy.
Supply Chain Management
454
1
M
2
M
Optimum
Payment
time
n P T R(P) Q
Profit Profit gain (%)
BuyerVendorIntegratedBuyerVendorIntegrated
0 0 - 10 10.75 87.47 128433096 78100 30961 109061 - - -
0 30 30 12 10.59 T
2
=84.95 130763061 78292 31312 109604 0.25 1.13 0.49
10 10 10 10.66 T
12
=85.04129763041 78706 30922 109628 0.78 -0.13 0.52
20 20 10 10.73 T
12
=84.52128762999 78947 30560 109507 1.084 -1.23 0.41
0 60 60 13 10.66 T
2
=65.80 129752350 79996 30074 110070 2.43 -2.86 0.93
10 60 13 10.66 T
12
=65.81129752350 79996 30075 110071 2.43 -2.86 0.93
20 60 13 10.66 T
12
=65.81129752350 79997 30077 110074 2.43 -2.86 0.93
0 90 90 13 10.72 T
2
=66.03 128822341 78870 32131 111001 0.98 3.78 1.78
10 90 13 10.72 T
12
=66.03128822341 78870 32133 111003 0.98 3.78 1.78
20 90 13 10.72 T
12
=66.03128822341 78870 32134 111005 0.98 3.78 1.78
Table 1. Optimal solution under different payment time
Table 2 suggests that under both an independent and coordinated policy, offer of trade
credit to the buyer fallout in a lower retail price and hence, pushes up market demand and
total joint profit. However, when the vendor and buyer work independently, irrespective of
whether or not the vendor offers trade credit to the buyer, the retail price which maximizes
the buyer’s profit is much higher than that in a coordinated policy. This in turn reduces
demand and hence the buyer’s order quantity decreases for each subsequent order. This
lowers profit of the vendor as well as the channel significantly. Therefore, the joint decision
Decision
making
Credit
terms
Payment
time
nP T
(days)
R(P) Q nQ
Profit
Buyer Vendor Integrated
Independent Cash on
Delivery
0 11 24.05 114.72 4696 1487 16357 89348 10539 99887
Trade
Credit
(2|10
net 30)
10 11 23.89 112.47 4733 1460 16060 91296 10754 102050
Coordinated Cash on
Delivery
0 10 10.75 87.47 12843 3096 30960 78100 30961 109061
Trade
Credit
(2|10
net 30)
10 10 10.66 85.04 12976 3041 30410 78706 30922 109628
Allocated 98075 11553 109628
Table 2. Optimal solution under different payment scenario
A Collaborative Vendor – Buyer Deteriorating Inventory Model
for Optimal Pricing, Shipment and Payment Policy with Two – Part Trade Credit
455
opted by the players of the supply chain can significantly improve the profit of the entire
supply chain. From the vendor’s end a joint decision is more advantageous than the
independent decision. This is not true for the buyer. Therefore, to make the joint decision
beneficial to the vendor and buyer both, Goyal (1976)’s method is implemented to enjoy
long term partnership which benefits both the vendor and buyer.
We reallocate TP(n*, P*, T*) and obtained
Buyer's profit =
()
(
)
() ()
**
***
** *
,
,,
,
BB
BB v
TBP P T
TP n P T
TBP P T TVP n
×
⎡
⎤
+
⎣
⎦
91296
109628
102050
98075
=×
=
and
Vendor’s profit =
()
(
)
() ()
*
***
** *
,,
,
v
BB j
TVP n
TP n P T
TBP P T TVP n
×
⎡
⎤
+
⎣
⎦
10754
109628
102050
11553
=×
=
The allocated results are listed at the bottom of Table 2.
Table 3 exhibits the benefits of a collaborative lot size credit policy. This shows that the
profit increase of a joint decision is $ 9174 (= 10906 – 9987) for the “cash on delivery scenario
and $ 7578(= 109628 – 102050) for the “2|10 net 30” scenario respectively. Under
independent decision, offer of trade credit improves profit by 2.17% as compared to cash on
delivery. The joint decision improves profit by 0.52%. The surplus capital generated for the
supply chain by joint decision and trade credit policy is $ 9741 which is 8.93% increase in the
profit. This concludes that the player can expect larger channel profit from the coordination
and trade credit policy.
Independent Coordinated Improvement
Cash on delivery 99887 109061 9174 (9.18%)
Trade credit (2|10, net 30) 102050 109628 7578 (7.43 %)
Improvement 2163 (2.17 %) 567 (0.52 %) 9741 (8.93 %)
Table 3. Improvement solution for coordinated system
Example 4 In this example, we compute the relative performances for various values of the
model parameters. The values of
ρ, (A
b
/A
v
) and (I
b
/I
v
) are varied. The other model
parameters take values as given in Example 1. The offer of “2|10 net 30” by the vendor is
consider. The optimal solutions and the integrated profit are exhibited in Table 4.
It is observed that increase in
ρ, lowers the buyer cycle time and tempted to take advantage
of a trade credit more frequently. The buyer’s retail price decreases and integrated profit
increases significantly. The number of shipments increases significantly.