Multiprocessor Scheduling Part 7 pptx
Bạn đang xem bản rút gọn của tài liệu. Xem và tải ngay bản đầy đủ của tài liệu tại đây (379.5 KB, 30 trang )
Multiprocessor Scheduling: Theory and Applications
170
3.3. Construction heuristics
Often solutions for problems are needed very fast, as the problem is an element of a
dynamic real world setting. This requirement can generally not be met by exact algorithms
like branch and bound algorithm and Lagrangian relaxation method, especially when the
problem is NP hard. Besides, not everyone is interested in the optimal solution. In many
cases, it is preferable to find a sub-optimal, but good solution in a short time which can be
obtained by constructive algorithms. Most of the researchers have reported that the above
enumerative and Lagranginan algorithms are computationally expensive for larger problem
size and tend for other techniques viz. construction heuristics and heuristic search
algorithms. Constructive algorithms generate solutions from scratch by adding solution
components to an initially empty solution until it is complete. A common approach is to
generate a solution in a greedy manner, where a dispatching rule decides heuristically
which job should be added next to the sequence of jobs that makes up the partial solution.
Dispatching rules have been applied consistently to scheduling problems. They are
procedures designed to provide good solutions to complex problems in real-time. The term
dispatching rule, scheduling rule, sequencing rule or heuristic are often used
synonymously.
Panwalker and Iskander (1977) named construction heuristics as scheduling rules and made
a survey about different scheduling rules. Blackstone et al. (1982) called as dispatching rules
and discussed the state of art of various dispatching rules in the manufacturing operations.
Haupt (1989) termed the construction heuristics as priority rules and provides a survey of
this type of priority rule based scheduling. Montazer and Van Wassenhove (1990)
extensively studied and analysed these scheduling rule using simulation techniques for a
flexible manufacturing system.
A distinction in dispatching rules can be made as static and dynamic rules. Static rules are
just a function of the a priori known job data and dynamic dispatching rules, on the other
hand, depend on the partial solution constructed so far. An example of a static rule is
Earliest Due Date (EDD) and an example of a dynamic rule is Modified Due Date (MDD). A
possibility to get still better performing dispatching policies is to combine simple rules like
EDD or MDD. After having pilot investigations on the different dispatching rules, a
Backward heuristic dispatching rule is suggested for bottleneck facility total weighted
tardines problems which is described as below [Maheswaran, 2004] :
3.3.1. Backward Heuristics (BH).
BH is a dynamic dispatching rule. It is a greedy heuristic procedure, in which the sequential
job assignment starts from the last position and proceed backward towards the first
position. The assignments are complete when the first position is assigned a job. The process
consists of the following steps:
Step 1: Note the position in the sequence in which the next job is to be assigned. The
sequence is developed starting from position n and continuing backward to
position 1. So, the initial value of the position counter is n.
Step 2: Calculate T, which is the sum of the processing times for all unscheduled jobs.
Step 3: Calculate the penalty for each unscheduled job i as (T – d
i
) X w
i
. If d
i
>T, the penalty
is zero, because only tardiness penalties are considered.
Hybrid Search Heuristics to Schedule Bottleneck Facility in Manufacturing Systems
171
Step 4: The next job to be scheduled in the designated position is the one having the
minimum penalty from step 3. In the case of tie, choose the job with the largest
processing time.
Step 5: Reduce the position counter by 1.
Repeat steps 1 through 5 until all jobs are scheduled.
Numerical Example:
The backward heuristics is explained by a numerical example by considering a four jobs
problem in which the processing time, due date and weight of the four jobs are given below,
Job no.
Processing time p
i
Due Date d
i
Weight w
i
1 37 49 1
2 27 36 5
3 1 1 1
4 28 37 5
For backward heuristics, the sequence is developed from the fourth position and at this time
T = 93 and penalty for job 1 is 44, job 2 is 285, job 3 is 93 and job 4 is 280. The job 1 is having
the minimum penalty and scheduled at the fourth position of the sequence.
For the third position, T = 56 and penalty for the job 2 is 100, job 3 is 55 and job 4 is 140.
Now, job 3 is having minimum penalty and scheduled at the third position of the sequence.
For, the second position, T = 55 and the penalty of job 2 is 95 and job 4 is 90 and so job 4 is
scheduled ant second position and job 2 is scheduled at first position of the sequence.
The resultant sequence generated from the backward phase is 2 – 4 – 3 – 1 with a total
weighted tardiness value of 189.
3.4. Heuristic Search Algorithms
Heuristic search algorithms are often developed and used to solve many difficult NP-hard
type computational problems in science and engineering. Since uninformed search by
enumeration methods seems computational prohibitive for large search spaces, heuristic
search receives increasing attention [Morton & Pentico, 1993]. Heuristics can derive near
optimal solutions in considerably less time than the exact algorithms. Heuristics often seek
to exploit special structures in a problem to generate good solutions quickly. However, there
is no guarantee that heuristics will find an optimal solution.
Heuristics are obtained by
• using a certain amount of repeated trials,
• employing one or more agents viz. neurons, particles, chromosomes, ants, and so on,
• operating with a mechanism of competition and cooperation,
• embedding procedures of self modification of the heuristic parameters or of the
problem representation.
Heuristic search algorithms utilize the strengths of individual heuristics and offer a guided
way for using various heuristics in solving a difficult computational problem. According to
Osman (1996), a heuristic search “is an iterative generation process which guides a subordinate
heuristic by combining intelligently different concepts for exploring and exploiting the search
spaces…” [Osman, 1996, Osman & Kelly, 1996]. Heuristic search algorithms have shown
promise for solving “…complex combinatorial problems for which optimization methods have failed
to be effective and efficient.”
Multiprocessor Scheduling: Theory and Applications
172
A wide range of different heuristic search techniques have been proposed. They have some
basic component parts in common and are:
• A representation of partial and complete solutions is required.
• Operators, which either extend partial solutions or modify complete solutions are
needed.
• An objective function, which either estimates the costs of partial solutions or determines
the costs of complete solutions is needed.
• The most crucial component of heuristic search techniques is the control structure that
guides the search.
• Finally, a condition for terminating the iterative search process is required.
Common heuristic methods include:
• Tabu search, [Glover 1989; 1990; Glover et al., 1993; 1995],
• simulated annealing [Kirkpatrick et al., 1983],
• greedy random adaptive search procedures (GRASP) [Deshpande & Triantaphyllou,
1998; Feo & Resende, 1995],
• iterated local search [Helena et al., 2001],
• genetic algorithms [Goldberg, 1989], and
• ant colony optimization [Den Besten et al., 2000].
Instead of searching the problem space exhaustively, Reeves (1993) informs that modern
heuristic techniques concentrate on guiding the search towards promising regions of the
search space. Prominent heuristic search techniques are, among others, simulated annealing,
Tabu search and evolutionary algorithms. The first two of them have been developed and
tested extensively in combinatorial optimization. To the contrary, evolutionary algorithms
have their origin in continuous optimization. Nevertheless, the components of evolutionary
algorithms have their counterparts to other heuristic search techniques. A solution is called
an individual which is modified by operators like crossover and mutation. The objective
function corresponds to the fitness evaluation. The control structure has its counterpart in
the selection scheme of evolutionary algorithms.In evolutionary algorithms, the search is
loosely guided by a multi-set of solutions called a population, which is maintained in
parallel. After a number of iterations (generations) the search is terminated by means of
some criterion.
3.4.1. Classification of Heuristic Search Algorithms
Depending upon the characteristics to differentiate between search algorithms, several
classifications are possible and each of them being the results of a specific view point. The
most important methods of classification are:
• Nature inspired vs Non nature inspired
• Population based vs Single point search
• Dynamic vs Static objective function
• One vs Various neighborhood structure
• Memory Usage vs Memory less method
Nature inspired vs Non nature inspired
Perhaps, the most intuitive way of classifying heuristic search algorithms is based on the
origin of the algorithms. There are nature inspired algorithms like evolutionary algorithms
and ant algorithms, and non nature inspired algorithms like Tabu search and iterated local
search / improvement algorithms. This classification is not meaningful for the following
Hybrid Search Heuristics to Schedule Bottleneck Facility in Manufacturing Systems
173
two reasons. First, many hybrid algorithms do not fit in either class or in a sense that it fit
both at the same time. Second, sometimes it is difficult to clearly tell the genesis of an
algorithm.
Population based vs Single point search
Another characteristic which can be used for the classifications is the way of performing the
search. Does the algorithm work on a population or on a single solution at a time?
Algorithms working on single solution are called as trajectory methods and encompass local
search based heuristics. They all share the property of describing a trajectory in the search
space during the search process. Population based methods on the contrary perform search
process which describe the evolution of a set of points in the solution space.
Dynamic vs Static objective function
Search algorithms can also be classified according to the way they make use of the objective
function. While some algorithms keep the objective function given in the problem
representation “as it is” and some others like guided local search will modify during the
search. The idea behind this search is to escape from the local optima by modifying the
search landscape. Accordingly, during the search the objective function is altered by trying
to incorporate information collected during the search process.
One vs Various neighborhood structure
Most search algorithms work on single neighborhood structure. In other words, the fitness
landscape, which is searched doesn’t change in the course of the algorithm. Other
algorithms use a set of neighborhood structures which gives the possibility to diversify the
search and tackle the problem jumping between different landscapes
Memory Usage vs Memory less method
A very important feature to classify the heuristic search algorithms is whether they use
memory of search history or not. Memories less algorithms perform a Markov process, as
the information they need is only the current state of the search process. There are several
different ways of making use of memory. Usually it will be differentiated between short
term and long term memory structures. The first usually keeps track of recently
performed moves, visited solutions or, in general, decisions taken. The second is usually
the accumulation of synthetic parameters and indexes about the search. The use of
memory is nowadays recognized as one of the fundamental elements of the powerful
heuristics.
4. Hybrid Algorithms Developed
The main objective of this work is to formulate different hybrid search heuristics which are
designed to solve the problems of higher sizes within reasonable time. In this work, three
different heuristic search algorithms are formulated and used to solve the bottleneck
scheduling problems with objective of minimizing the total weighted tardiness.
They are:
• Heuristic Improvement algorithm [Maheswaran & Ponnambalam, 2003]
• Iterated Local Improvement Evolutionary Algorithm [Maheswaran & Ponnambalam,
2005]
• Self Improving Mutation Evolutionary Algorithms [Maheswaran et al., 2005]
Multiprocessor Scheduling: Theory and Applications
174
4.1. Heuristic Improvement algorithm (HIA)
Heuristic Improvement algorithm is devised in such a way to improve an initial sequence
generated by construction heuristics. Generally, construction heuristics can be used to get
the solution to the scheduling problems in a faster way. Construction heuristics generate
solutions from scratch by adding solution components to an initially empty solution until it
is complete. But, the results of these heuristics are not accurate. A common approach is to
generate a solution in a greedy manner, where a dispatching rule decides heuristically
which job should be added next to the sequence of jobs that makes up the partial solution.
After pilot anlaysis, it is observed that the dynamic backward dispatching rules based on
heuristics is performing well. It is proposed to apply a greedy heuristic improvement
algorithm, which will operate on the sequence developed by backward heuristic as initial
sequence for the improvement.
4.1.1. Procedural Steps of Heuristic Improvement Algorithm
The proposed heuristic improvement algorithm adopts the forward heuristic method
addressed by Sule (1997) operating on some initial sequence. The procedure is out lined
below:
Step 1: Initialize the sequence with backward heuristics and set its total weighted tardiness
value as the objective value. The sequence obtained from backward heuristic is
assumed to be the initial sequence and this is the best sequence at this stage with
the total weighted tardiness as the objective value.
Step 2: Let k define the lag between two jobs in the sequence that are exchanged. For
example, jobs occupying positions 1 and 3 have a lag k = 2.
Step 3: Perform the forward pass on the job sequence found in the backward phase that is
the best sequence at this stage. The forward pass progresses from the job position 1
towards the job position n.
Step 3.1: Set k = n – 1
Step 3.2: Set exchange position j = k + 1
Step 3.3: Determine the savings by exchanging two jobs in the best sequence with a
lag of k. The job scheduled in position j is exchanged with the job
scheduled in a position (j-k). If (j-k) is zero or negative then go to step 3. 6.
Calculate the penalty after exchange and compare it to the best sequence
penalty.
Step 3.4:If there is either positive or zero savings in step 3.3, then go to step 3.5;
otherwise the exchange is rejected. Increase the value of j by one. If j is
equal to or less than n, then go to step 3.3. If j >n, then go to step 3.6.
Step 3.5: If the total penalty has decreased, the exchange is acceptable. Perform the
exchange. The new sequence is now the best sequence; Go to step 3.1.
Even if the savings is zero, make the exchange and go to step 3.1, unless
the set of the jobs associated in this exchange has been checked and
exchanged in an earlier application of the forward phase. In that case, no
exchange is made at this time. Increase the value of j by one. If j < n, then
go to step 3.3. If j = n, then go to step 3.6.
Step 3.6: Decrease value of k by one. If k > 0, then go to step 2. If k = 0, then go to
step 4.
Step 4: The resulting sequence is the best sequence generated by this procedure.
Hybrid Search Heuristics to Schedule Bottleneck Facility in Manufacturing Systems
175
Numerical Example :
The four jobs problem given in section 3.3.1 is further improved by the forward phase. The
sequence generated by backward phase 2 – 4 – 3 – 1 with a total weighted tardiness value of
189 is consider as the best sequence at this stage. Set Lag k = n – 1 which yields k = 3.
Exchange jobs in the position between j & (j+k). So, in the present sequence exchange job 2
and job 1 and the new sequence is 1 – 4 – 3 – 2 which yields a total weighted tardiness value
of 420 and there is no savings and the exchange is not accepted.
There is no more exchange possible for the lag k = 3 and reduce k by one which yields k = 3.
Exchange job 2 and job 3, which yields the sequence 3 – 4 – 2– 1 with value 144. As there is
savings and accept the change and this is the best sequence now.
Once again set the lag k = 3, and repeat the procedure for the new sequence and finally the
optimum sequence will be 3 – 2 – 4 – 1 with a total weigted tardiness of 139.
The forward phase algorithm is described by means of a flowchart as shown in the figure 1.
Figure 1. Heuristic Improvement Algorithm
Multiprocessor Scheduling: Theory and Applications
176
4.2. Iterated Local Improvement Evolutionary Algorithm (ILIEA)
According to the survey of Thomas Baeck et al. (1991), on the Evolution Strategies and its
community has always placed more emphasis on mutation than crossover. The role of local
search in the context of evolutionary algorithms and the wider field of evolutionary
computing has been much discussed. In its most extreme form, this view casts mutation and
other local operators as mere adjuncts to recombination, playing auxiliary (if important)
roles such as keeping the gene pool well stocked and helping to tune final solutions.
Radcliffe and Surry. (1994) investigated that a greater role for mutation, hill-climbing and
local refinements are needed for evolutionary algorithms. Ackley (1987) recommends genetic
hill climbing, in which crossover plays a rather less dominant role.
Iterated local improvement evolutionary algorithm is designed similar to an iterated local
improvement algorithm with evolutionary based perturbation tool. Iterated local
improvement algorithm is a simple but effective procedure to explore multiple local
minima, which can be implemented in any type of local search algorithm. It is to perform
multiple runs with the algorithm and each using a different starting solution. A promising
but relatively unexplored idea is to restart near a local optimum, rather than from a
randomly generated solution. Under this approach, the next starting solution is obtained
from the current local optimum where the current local optimum is usually either the best
local optimum found so far from the history, or the most recently generated local optimum
by applying a pre-specified type of random move to it which is referred as kick or
perturbation.
Figure 2. Iterated Local Improvement Evolutionary Algorithm
Hybrid Search Heuristics to Schedule Bottleneck Facility in Manufacturing Systems
177
Iterated Local Improvement Evolutionary Algorithm (ILIEA) is hybrid algorithm having
POP = 2. The complexity of the algorithm is governed by the number of iterations used for
termination criterion. The complete process of iterated local improvement evolutionary
algorithm with an example is given in the figure 2. It consists of the following modules:
• Initial parents generation
• Population size POP = 2
• Crossover operation (Evolutionary perturbation technique)
• Crossover probability (P
c
) = 1
• Mutation operation (Self improvement technique)
• Mutation probability (P
m
) = 1
• New parents generation
4.2.1. Initial Parents Generation
A sequence of the bottleneck facility scheduling problem is mapped into a chromosome
with the alleles assuming different and non repeating integer values in the [1,n] interval.
Any sequence can be mapped into this permutation representation. This approach can be
found in most genetic algorithm articles dealing with sequencing problems [Franca et al.,
2001]. The total weighted tardiness of a sequence is assumed to be the fitness function for
ILIEA.
In this algorithm the population size is assumed to be two and the sequence developed by
the backward phase acts as one parent and sequence generated taking events in a random
order acts as the other parent.
4.2.2. Crossover Operation (Evolutionary Perturbation Technique)
Perturbation is a pre-specified type of random move applied to a solution. For a current
solution s*, a change or perturbation is applied to an intermediate state s’. Then the Local
Improvement is applied on s’ and a new solution s*’ is reached. If s*’ passes an acceptance
test, it becomes the next base solution for the search otherwise it returns to s*. The overall
procedure is shown in figure 3.
Figure 3. Procedures for Perturbation
Multiprocessor Scheduling: Theory and Applications
178
The crossover operation adopted in this work uses an evolutionary perturbation technique,
which involves the following processes:
• Iterated local search (ILS)
• Perturbation tool
• Perturbation strength
• Acceptance criterion
Iterated Local Search: The underlying idea of ILS is that of building a random walk in S*,
the space of local optima defined by the output of a given local search. Four basic
ingredients are needed to derive an ILS:
• a procedure to GenerateInitialSolution, which returns some initial solution,
• a local search procedure for LocalSearch,
• a scheme of how to perturb a solution, implemented by a procedure Perturbation, and
• an AcceptanceCriterion, which decides from which solution the search is continued.
The particular walk in S* followed by the ILS can also depend on the search history, which is
indicated by history in Perturbation and AcceptanceCriterion.
The effectiveness of the walk in S* depend on the definition of the four component
procedures of ILS: The effectiveness of the local search is of major importance, because it
strongly influences the final solution quality of ILS and its overall computation time. The
perturbations should allow the ILS to effectively escape local optima but at the same time
avoid the disadvantages of random restart. The acceptance criterion, together with the
perturbation, strongly influence the type of walk in S* and can be used to control the balance
between intensification and diversification of the search. The initial solution will be
important in the initial part of the search. The configuration problem in ILS is to find a best
possible choice for the four components such that best overall performance is achieved. The
algorithm outline of iterated local search is given in the figure 4.
Outline of Iterated Local Search
s
0
= GenerateInitialSolution
s* = LocalSearch (s
0
)
REPEAT
s’ = Perturbation (s
*
, history)
s
*’
= LocalSearch (s’)
s
*
= AcceptanceCriterion (s
*
, s
*’
, history)
until
termination criterion met
Figure 4. Iterated Local Search
Perturbation Tool :Though many researchers followed different types of perturbation tools,
an evolutionary operator perturbation tool is used in this work. Here, an ordered crossover
operator (OX) is used as perturbation tool. The operation of the OX is given as follows: The
operator takes the initial sequence s* from the base heuristics and another sequence s** is
generated randomly. The resultant sequence s’ will take, a fragment of the sequence from s*
and the selection of the fragment is made uniformly at random. In the second phase, the
empty positions of s’ are sequentially filled according s**. The accepted s* for the next
iteration will replace with worst of the previous s* and s**.
As an example, the sequence s’ inherits the elements between the two crossover points,
inclusive, from s* in the same order and position as they appeared. The length of the
Hybrid Search Heuristics to Schedule Bottleneck Facility in Manufacturing Systems
179
crossover is in the range between a random number generated in the range of [1, n-1] job
position as lower limit (LL) and a random number generated in the range of [LL, n] as the
upper limit (UL). The remaining elements are inherited from the alternate sequence s** in
the order in which they appear, beginning with the first position following the second
crossover point and skipping over all elements already present in s’.
An example for the perturbation tool is given in figure 5. The elements ǂ , ƥ, ǖ, Dž and ǚ are
inherited from s* in the same order and position in which they occur. Then, starting from
the first position after the second crossover point, s’ inherits from s**. In this example,
position 8 the next position, s’[8] = ǖ, which is already present in the offspring, so s** is
searched until an element is found which is not already present in s’. Since ǖ, ǚ and ƥ are
already present in s’, the search continues from the beginning of the string and s’ [8] = s** [2]
= ǃ, s’ [9] = s** [3] = DŽ, s’ [10] = s** [5] = dž, and so on until the new sequence is generated
[Starkweather. T. et al., 1991].
Parent 1 (s*) : DŽ- LJ- ǂ- ƥ- ǖ- Dž- ǚ- nj- ǃ- dž
Parent 2 (s**): ǂ -ǃ –DŽ-Dž- dž -LJ -nj -ǖ -ǚ –ƥ
Cross over points: LL = [3] and UL = [7]
Offspring (s’) : LJ –nj-ǂ- ƥ- ǖ- Dž- ǚ- ǃ –DŽ- dž
Figure 5. Ordered Crossover (OX)
Perturbation Strength : For some problems, appropriate perturbation strength is very small
and seems to be rather independent of the instance size. The strength of a perturbation is
referred as the number of solution components directly affected by a perturbation. The OX
operator will change most of the solution components in the sequence according to the
generated LL & UL values.
Acceptance Criteria : The perturbation mechanism together with the local improvement
defines the possible transitions between a current solution s* to a “neighboring” solution s*’.
The acceptance criteria determines whether s*’ is accepted or not as the new current
solution. A natural choice for the acceptance criterion is to accept only better solutions
which are a very strong intensification for search. This is termed as BETTER criterion.
Diversification of the search is extremely favored if every s*’ is accepted as the new solution.
This is termed as random walk (RW) criterion which is represented as
RW(s*, s*’, history) : = s*’ (2)
Since, the operator OX completely changes most of the solution components, the acceptance
criterion is chosen as RW.
The sequence obtained after perturbation is further improved in the mutation operation
which is self improving.
4.2.3. Mutation Operation (Self Improvement Technique)
The mutation operation adopted in this research uses a self improvement technique, which
consists of the following parts:
• Local search
• Neighborhood structure
Local Search : Local search methods move iteratively through the solution set S. Based on
the current and may be on the previous visited solutions, a new solution is chosen. The
choice of the new solution is restricted to solutions that are somehow close to the current
Multiprocessor Scheduling: Theory and Applications
180
solution i.e. in the 'neighborhood' of the current solution. Different local search methods
may be formulated depending on the method of choosing solutions from the neighborhood
of the current solution and the way in which the stopping criteria are defined [Helena, 1995].
A neighborhood search method requires a representation of solutions to be chosen, and an
initial solution to be constructed by some heuristic rule or created randomly. A neighbor is
generated by some suitable mechanism, and an acceptance rule is used to decide whether it
should replace the current solution or not. The acceptance rule in a neighborhood search
method usually requires the comparison of objective function values for the current solution
and its neighbor.
Neighborhoods are usually defined by first choosing a simple type of transition to obtain a
new solution from a given one, and then defining the neighborhood as the set of all
solutions that can be obtained from a given solution by performing one transition.
Generally, a local search method is based on the following two routines:
• Given an instance, construct an initial solution.
• Given an instance and any solution, determine if there is a neighboring solution of
lower cost, and if so, return one such solution. If no such solution exists, then the input
solution is returned and it is indicated that it is a local optimal solution.
The basic structure of a local search is presented in figure 6
Procedure Local Search (Search Space S, Neighborhood N, Z(ǔ);
begin
ǔ
0
: = Initial sequence (ǔ);
i : = 0;
while (¬termination criteria (ǔ
i
, i )) do
m : = Selectmove (ǔ
i
, N,
,
Z(ǔ
i
));
if Z
1
(ǔ) > Z (ǔ)
then ǔ
i+1
= ǔ
i
ǐ m;
else ǔ
i+1
= ǔ
i ;
i = i+ 1
end
end;
Figure 6. Local Search
Neighborhood Structure : Before applying local search methods to any problem a
neighborhood structure is to be defined. A systematic way of defining neighborhoods is
needed; otherwise, it is not possible to store the neighborhood. The neighborhoods define a
frame for the possibilities of walking through the solution space; they have a crucial
influence on the behavior of local search. If neighborhoods are small, the walk is very
restricted and, thus, it may be hard to reach good solutions. On the other hand, if
neighborhoods are large, it may be time consuming to decide in which direction (i.e. to
which neighbor) the search shall continue. However, not only the size but the more the
quality of the solutions in a neighborhood is of interest. If a neighborhood contains
promising solutions, it does not matter if the size of the neighborhood is small and, on the
other hand, large neighborhoods with only solutions of poor quality are not very helpful.
Hybrid Search Heuristics to Schedule Bottleneck Facility in Manufacturing Systems
181
Three common neighborhood schemes are used for scheduling problems and are given
below:
• Adjacent neighborhood interchange in which a job may be swapped with jobs directly
to its left or right in the schedule.
• Swap in which any two jobs in the schedule can be swapped.
• Insert in which a job is taken from its current position and placed in another position in
the schedule.
In this work, four mechanisms are used for finding the neighborhood solutions to solve the
bottleneck facility scheduling problems are investigated. They are:
• Adjacent neighborhood interchange
• Randomized neighborhood structure
• Randomized adjacent interchange (Ǚ
ai
),
• Randomized sliding mutation (Ǚ
sl
) and
• Randomized pair wise interchange (Ǚ
pw
)
Adjacent neighborhood interchange
The process of the adjacent neighborhood interchange mechanism is shown in figure 7. For any
solution s, neighbourhood of s, N(s), includes (n-1) different alternative neighbouring
solutions obtained by interchanging a job with its right job in the sequence.
Figure 7. Adjacent Neighborhood Interchange
Randomized Adjacent Interchange (ȥ
ai
)
This is a randomized version of adjacent interchange neighborhood structure. This operator
will generate a random number (R) in the range [1, n] and just interchanges the job present
in the position R with the next job in the sequence (R+1) and represented as:
Ǚ
ai
(ǖǑijǚ) = ǖǑjiǚ (3)
Job-2
Job-1
Job-n
Job-(n-1)
Job-3
Multiprocessor Scheduling: Theory and Applications
182
Randomized Sliding Mutation (ȥ
sl
)
This is a randomized version of inert neighborhood structure. This operator may be also
termed as randomized extraction and backward shift insertion operator. Sliding mutation
refers to “moving a job from the j
th
place and placing it before the i
th
position”. Two values
are generated randomly (R
1
and R
2
) in the range [1,n] in such a way that R
1
< R
2
and applied
to jobs present in the positions in between R
1
and R
2
. The job in position R
2
is placed before
the job in position R
1
and all jobs in between R
1
and R
2
are pushed one position and
represented as:
Ǚ
sl
(ǖiǑjǚ) = ǖjiǑǚ (4)
Randomized Pair wise Interchange (ȥ
pw
)
This operator may be also termed as random swap operator and similar to swap
neighborhood structure. Random swap refers to “the swapping according to the randomly
generated values”. Two values are generated randomly (R
1
and R
2
) in the range [1,n] and
applied to jobs present in the positions R
1
and R
2
and the jobs are swapped according to the
random values generated and represented as:
Ǚ
pw
(ǖiǑjǚ) = ǖjǑiǚ (5)
The improvement technique will be stopped with a maximum number of trials which is
assumed to be a function related to number of jobs (n).
The local search with different neighborhood structures with a termination criteria n*n*n
number of iterations, so that the complexity of the algorithm is in the order of O (n
3
), applied
on the initial sequence obtained by backward phase heuristics.
The potentials of three randomized neighborhood structure are investigated by applying on
the sequences generated by the EDD, MDD and BH heuristics as initial sequences. These
local search is applied for a termination criteria n*n*n number of iterations so that the
complexity of the algorithm is in the order of O (n
3
). It is observed that the local search
algorithm with adjacent neighborhood interchange is applied on the sequence generated by
backward heuristics is not able to improve further and it is decided to use the randomized
neighborhood structure. For large sizes of n, Ǚ
pw
structure can be applied as self improving
technique in this proposed iterated local improvement evolutionary algorithm with a
maximum number of trials for local improvement, which can be assumed as a function of
size of the problem.
4.2.4. New Parent Generation
In this proposed algorithm, the locally improved offspring obtained after self improvement
technique is used as a parent for the next generation. Even though, the improved offspring
value is less than the previous parents, it must be considered for the next generation. The
best parent of the previous generation will act as the other parent and the evolution process
is continued for the predetermined number of generation.
4.3. Self Improving Mutation Evolutionary Algorithms (SIMEA)
Evolutionary algorithms are generally used to solve problems of higher search spaces. The
search space in bottleneck facility scheduling problems is quite large (n!). Evolutionary
Algorithms (EA) is the term used to describe search methods based on the mechanics of
natural selection and evolution. Evolutionary Algorithms are often presented as general
Hybrid Search Heuristics to Schedule Bottleneck Facility in Manufacturing Systems
183
purpose search methods. The evolutionary process can be simulated on a computer in a
number of ways and two self improving mutation based evolutionary algorithms are
designed in this work to improve the results obtained from iterated local improvement
algorithm. Self Improving Mutation Evolutionary Algorithms (SIMEA) are population based
evolutionary algorithms in which each individual represents a sequence and the population
evolves through tournament selection, ordered crossover and self improving mutation. The
selection of initial population and termination criteria plays a vital role in the quality of the
solution and complexity of the algorithm. The process of self improving mutation
evolutionary algorithm is explained as below,
Self Improving Mutation Evolutionary Algorithm (SIMEA) is a hybrid algorithm having
population size POP = n, Crossover probability (P
c
) = 1 and Mutation probability (P
m
) = 1.
The complexity of the algorithm is governed by different parameters like size of the
population (POP) used for evolution, maximum trials for self improving mutation (M) and
number of generation needed for termination. The complete process of self improving
mutation evolutionary algorithm with an example is given in the figure 8. It consists of the
following parts:
• Sequence representation
• Initial population
• Selection Operator
• Crossover operator
• Self improving mutation operator
• Termination criterion
The proposed self improving mutation evolutionary algorithm is shown in the figure 8.
Figure 8. Self Improving Mutation Evolutionary Algorithm
Multiprocessor Scheduling: Theory and Applications
184
4.3.1. Sequence Representation for SIMEA
The solution representation for SIMEA is similar to the ILIEA. The sequence is mapped into
a chromosome with the alleles assuming different and non repeating integer values in the [1,
n] interval. Any sequence can be mapped into this permutation representation. The objective
function namely the total weighted tardiness of a sequence is considered as the fitness
function of SIMEA.
4.3.2. Initial Parents
For the SIMEA, the size of the initial population is assumed to be the number of jobs. The
individuals in the population are generated by means of a spread heuristics which
ensures a better range of possible values of the chromosomes in the initial population. The
individuals are generated in such a way that job 1 is fixed at the n
th
position for the n
th
chromosome.
4.3.3. Selection Operator
In this algorithm, it is proposed to use tournament selection with two different criteria on
number of individuals selected for evolution (POP). In one version of SIMEA, all individuals
in the population are selected for evolution (SIMEA I). Another version SIMEA applies a log
arithmetic reduction heuristic, which allows only e
log
10
n
individuals are selected for evolution
(SIMEA II).
4.3.4. Crossover Operator
On the selected individuals, the ordered crossover (OX) is implemented. The OX explained
in the section 4.2.2 is used to generate offspring. Since, the number of individuals selected
for evolution is more than two; more number of offspring will be generated.
4.3.5. Self Improving Mutation
The off springs obtained from the crossover are improved further by means of the self
improving operator explained in section 4.2.3. Here, it is assumed to have the termination
criterion for the improvement as n/2.
4.3.6. Termination Criterion
The termination criterion of the algorithm is based on the number of predetermined number
of generations. To have determined complexity, it is assumed to have n
2
number of
generations as termination criteria for both SIMEA I & SIMEA II.
5. Performance Evaluation
The set of bottleneck facility total weighted tardiness problem instances available in the
Operation Research Library maintained by Beasley are considered. The problem instances
are generated as follows:
For each job i (i=1, ,n), an integer processing time p
i
was generated from the uniform
distribution [1,100] and integer processing weight w
i
was generated from the uniform
distribution [1,10]. Instance classes of varying hardness were generated by using different
uniform distributions for generating the due dates. For a given relative range of due dates
RDD (RDD=0.2, 0.4, 0.6, 0.8, 1.0) and a given average tardiness factor TF (TF=0.2, 0.4, 0.6,
Hybrid Search Heuristics to Schedule Bottleneck Facility in Manufacturing Systems
185
0.8, 1.0), an integer due date d
i
for each job i was randomly generated from the uniform
distribution [P x (1-TF-RDD/2), P x (1-TF+RDD/2)], where
¦
=
=
n
i
i
pP
1
.
Here, there are 25 different combinations for (RDD, TF) pairs and five replicates are taken
for each (RDD, TF) combinations yielding 125 different test instances for each value of n.
In the OR library, there are three files wt40, wt50, and wt100 containing the instances of size
40, 50, and 100 respectively. Each file contains the data for 125 instances, listed one after the
other. The n processing times are listed first, followed by the n weights, and finally n due
dates, for each of the 125 instances in turn.
For example in wt40 the first 40 integers in the file are the processing times for the 40 jobs in
the first instance. The next 40 integers are the first instance’s weights. The next 40 integers
are the first instance's due dates. The next 40 integers are the second instance's processing
times, etc.
5.1. Optimal and Best Known Solution Values for SMTWTP
Optimal values of solutions are available for 124 instances out of 125 problems for 40 jobs
problem and the unsolved 40 jobs problem is number 19. The values for the unsolved
problems given in the files wtopt40 is the best known to Crauwels, et. al., 1998.
Optimal values of solutions are available for 115 instances out of 125 problems the 50 jobs
problem instances and the unsolved 50 jobs problems are problem no. 11, 12, 14, 19, 36,
44, 66, 87, 88 and 111. The values for the unsolved problems given in the files wtopt50 are
the best known to Crauwels, Potts & Van Wassenhove. The values of the solutions not
known to optimality have not been improved upon since and appear quite likely to be
optimal.
The best solution values known to Crauwels, Potts & Van Wassenhove (1998) for the 100
jobs problems are given in file wtbest100a. These solution values were used as the best
known by both Crauwels et al. and Congram et al, 1990. Therefore using the best solution
values known to Crauwels et al. allows results from future heuristics to be compared
directly with the tables given.
The local search heuristic iterated dynasearch has in some cases found better solutions to the
100 job problems than those known by Crauwels, Potts & Van Wassenhove. The best known
solutions to date are given in the file wtbest100b.
All the 125 problem instances for the different sizes n = 40, n = 50 and n = 100 are solved by
the three hybrid algorithms and compared with the best known results.
5.2. Performance Analysis of Heuristic Improvement Algorithm
Greedy forward heuristic is applied on BH sequence to improve the solution. This is only a
heuristic improvement operating on the sequence generated by the BH as initial sequence.
The average total weighted tardiness values calculated by the heuristic improvement for n =
40 is 38809.91, for n = 50 is 54509.62. But this heuristic improvement algorithm is not giving
good results for higher size n = 100. The results obtained are compared with the
optimum/best known results available in OR library. The average total weighted tardiness
for the different combinations of (RDD, TF) are calculated and the percentage of deviation
from best known values are given in table 1 for n = 40 and for n = 50.
Multiprocessor Scheduling: Theory and Applications
186
n = 40 n = 50
Average weighted
tardiness
Average weighted
tardiness
S.No RDD T.F.
Best Known HIA
% of
deviation
Best Known HIA
% of
deviation
1. 0.2 0.2 1151.8 1252 8.699 2184.4 2335.6 6.922
2. 0.2 0.4 9221.2 9897.8 7.337 13343.4 14007 4.973
3. 0.2 0.6 21464.8 22612.4 5.346 43196.8 44285.6 2.521
4. 0.2 0.8 73120.2 76097.8 4.072 87714.4 91441.6 4.249
5. 0.2 1.0 112514 114099 1.409 189113 190486.6 0.726
6. 0.4 0.2 66.4 89.4 34.639 176.4 265 50.227
7. 0.4 0.4 4815.8 5459 13.356 6452.4 6999 8.471
8. 0.4 0.6 20039.8 21438.2 6.978 32574.6 35494.2 8.963
9. 0.4 0.8 69790.8 74849 7.248 89835.2 93276.8 3.831
10. 0.4 1.0 91736.8 92656.2 1.002 166049.6 168238.2 1.318
11. 0.6 0.2 0 34.8 0 39.2
12. 0.6 0.4 3273.6 3611.2 10.313 3426.6 4324.8 26.213
13. 0.6 0.6 18541.2 19754.8 6.545 23277.6 26031.8 11.832
14. 0.6 0.8 71892.4 73419.8 2.124 81545.4 84014.2 3.028
15. 0.6 1.0 90276 91539.6 1.400 130365 133429.2 2.351
16. 0.8 0.2 0 0 0.000 0 0 0.000
17. 0.8 0.4 609.4 1071.4 75.812 2191.2 2782 26.962
18. 0.8 0.6 14593.8 16380.8 12.245 25873.8 29013.6 12.135
19. 0.8 0.8 49719.8 51182.6 2.942 63134.6 65413.8 3.610
20. 0.8 1.0 121667.6 123609 1.600 153155.6 155049.4 1.234
21. 1.0 0.2 0 0 0.000 0 0 0.000
22. 1.0 0.4 774 960.2 24.057 1839.4 2074.6 12.787
23. 1.0 0.6 22629.2 24172.8 6.821 20864.8 23921.4 14.650
24. 1.0 0.8 51664 53565.4 3.680 76158 77863.4 2.239
25. 1.0 1.0 91482.4 92494.6 1.106 109855.4 111953.4 1.910
Table 1. (RDD, TF) factor wise comparison - HIA
Experience with this method showed that in most instances the best sequence is obtained
either immediately after the application of the backward phase or with a very few additional
iterations of the forward phase. This seemed to be promising but not for large number of
jobs.
5.3. Performance Analysis of ILIEA
The iterated local improvement algorithm is coded in C++ on a personal computer with 1.3
GHz Pentium IV CPU and 128 MB main memory and running on Micro soft Windows
operating system 2000 (5 RELEASE version) with Borland C/C++ compiler (version 3.1).
They are tested on 125 bench mark instances of total weighted tardiness problems of each
sizes n = 40, n = 50 and n = 100.
Here, there are 25 different combinations for (RDD, TF) pairs and five replicates are taken
for each (RDD, TF) combinations yielding 125 different test instances for each value of n.
Hybrid Search Heuristics to Schedule Bottleneck Facility in Manufacturing Systems
187
The average total weighted tardiness values of five replicates of each (RDD, TF)
combinations for the size n = 40, n = 50, n = 100 are considered and compared with the best
known values available in the file wtopt40, wtopt50, wtopt100 respectively.
The (RDD, TF) factor wise comparison of results of iterated local improvement evolutionary
algorithm as given in the table 2.
n = 40 n = 50 n = 100
Average
weighted
tardiness
Average
weighted
tardiness
Average
weighted
tardiness
S.No RDD T.F.
Best
known
value
ILIEA
% of
deviation
Best
known
value
ILIEA
% of
deviation
Best
known
value
ILIEA
% of
deviation
1. 0.2 0.2 1151.8 1190.6 3.370 2184.4 2214.2 1.362 5343.8 6180.4 15.656
2. 0.2 0.4 9221.2 9221.2 0.000 13343.4 13523.2 1.347 52570 53164.6 1.131
3. 0.2 0.6 21464.8 21464.8 0.000 43196.8 43216.8 0.004 185027.8185835.2 0.004
4. 0.2 0.8 73120.2 73120.2 0.000 87714.4 87749.4 0.004 433824.6436382.6 0.006
5. 0.2 1.0 112514 112514 0.000 189113 189950.8 0.004 665021.4666331.8 0.002
6. 0.4 0.2 66.4 66.4 0.000 176.4 176.4 0.000 256.6 256.6 0.000
7. 0.4 0.4 4815.8 4833.2 0.360 6452.4 7102.2 10.070 24792.8 27262.8 9.963
8. 0.4 0.6 20039.8 20070 0.001 32574.6 32588.6 0.000 132402.4137293.2 3.694
9. 0.4 0.8 69790.8 69999 0.003 89835.2 90302.8 0.005 374993.8379095.6 1.093
10. 0.4 1.0 91736.8 91887.2 0.002 166049.6 166274 0.001 691626.8703858.2 1.768
11. 0.6 0.2 0 0 0.000 0 0 0.000 0 0 0.000
12. 0.6 0.4 3273.6 3303.4 0.009 3426.6 3604.6 0.052 12955 14756 13.903
13. 0.6 0.6 18541.2 18583 0.002 23277.6 24065.2 0.034 85544.2 91407.6 6.854
14. 0.6 0.8 71892.4 72006.8 0.002 81545.4 81756.4 0.003 315179.2330526.8 4.869
15. 0.6 1.0 90276 90796.6 0.006 130365 130731 0.003 607101.8611426.4 0.007
16. 0.8 0.2 0 0 0.000 0 0 0.000 0 0 0.000
17. 0.8 0.4 609.4 633.8 4.00 2191.2 2291.8 4.591 656.6 695.4 5.909
18. 0.8 0.6 14593.8 14672 0.005 25873.8 26188.8 1.217 67259.2 71899.8 6.900
19. 0.8 0.8 49719.8 50817.2 2.207 63134.6 63179.8 0.001 295368.4297195.6 0.006
20. 0.8 1.0 121667.6121667.6 0.000 153155.6153227.6 0.000 576902 578342.4 0.002
21. 1.0 0.2 0 0 0.000 0 0 0.000 0 0 0.000
22. 1.0 0.4 774 780.4 0.008 1839.4 1839.4 0.000 285 338.4 18.736
23. 1.0 0.6 22629.2 22839.6 0.009 20864.8 21067.6 0.010 132623 141838.2 6.948
24. 1.0 0.8 51664 51664 0.000 76158 76166.2 0.000 300435 303187.6 0.009
25. 1.0 1.0 91482.4 91502.8 0.000 109855.4109908.6 0.000 486114.2487220.8 0.002
Table 2. (RDD, TF) factor wise comparison - ILIEA
From the table 2, it is observed that the average percentage of deviation is 0.399% from the
best known values for size n = 40; 0.748% for size n = 50; 3.898% for size n = 100.
5.4. Performance Analysis of SIMEA I
The SIMEA I algorithm has been implemented in the C++ language on a personal computer
with 1.3 GHz Pentium IV CPU and 128 MB main memory. The
Multiprocessor Scheduling: Theory and Applications
188
Sself Improving Evolutionary algorithm was running on FreeBSD operating system (4.3
RELEASE version) with the GNU C/C++ compiler (version 2.95.3) which is easier for CPU
calculations. SIMEA I is having the following parameters POP = n, M = n/2 and no. of
iterations for termination is n*n. The algorithm is tested on 125 bench mark instances of total
weighted tardiness problems of each sizes n = 40, n = 50 and n = 100.
The (RDD, TF) factor wise comparison of results of Self Improving Evolutionary algorithm
algorithm version I is given in the table 3.
n = 40 n = 50 n = 100
Average
weighted
tardiness
Average
weighted
tardiness
Average
weighted
tardiness
S.No RDD T.F.
Best
known
value
SIMEA
I
% of
deviation
Best
known
value
SIMEA
I
% of
deviation
Best
known
value
SIMEA
I
% of
deviation
1. 0.2 0.2 1151.8 1170.4 1.615 2184.4 2224.8 1.849 5343.8 5372 0.528
2. 0.2 0.4 9221.2 9315 1.017 13343.4 13538.2 1.460 52570 52801.2 0.440
3. 0.2 0.6 21464.8 21575.6 0.516 43196.8 43458.8 0.607 185027.8185742.8 0.386
4. 0.2 0.8 73120.2 73223.8 0.142 87714.4 87981.2 0.304 433824.6434668.6 0.195
5. 0.2 1.0 112514 112539.6 0.023 189113 189139 0.014 665021.4 665064 0.006
6. 0.4 0.2 66.4 66.4 0.000 176.4 195.8 10.998 256.6 280.4 9.275
7. 0.4 0.4 4815.8 4892.8 1.599 6452.4 6599.4 2.278 24792.8 25229.2 1.760
8. 0.4 0.6 20039.8 20180 0.670 32574.6 32968.2 1.208 132402.4 133846 1.090
9. 0.4 0.8 69790.8 70047.2 0.367 89835.2 90117 0.314 374993.8376054.2 0.283
10. 0.4 1.0 91736.8 91806 0.075 166049.6166105.4 0.034 691626.8 691788 0.023
11. 0.6 0.2 0 0 0.000 0 0 0.000 0 0 0.000
12. 0.6 0.4 3273.6 3420 4.472 3426.6 3518.8 2.691 12955 13543.2 4.540
13. 0.6 0.6 18541.2 19224.6 3.686 23277.6 23824.4 2.349 85544.2 86340.4 0.931
14. 0.6 0.8 71892.4 71968.2 0.105 81545.4 81861 0.387 315179.2316436.6 0.399
15. 0.6 1.0 90276 90349 0.081 130365 130433.6 0.053 607101.8607239.6 0.023
16. 0.8 0.2 0 0 0.000 0 0 0.000 0 0 0.000
17. 0.8 0.4 609.4 717.6 17.755 2191.2 2255.2 2.921 656.6 685.8 4.447
18. 0.8 0.6 14593.8 14845 1.721 25873.8 26231 1.381 67259.2 68757 2.227
19. 0.8 0.8 49719.8 49861 0.284 63134.6 63435.6 0.477 295368.4296705.4 0.453
20. 0.8 1.0 121667.6121714.4 0.038 153155.6 153222 0.043 576902 577189 0.050
21. 1.0 0.2 0 0 0.000 0 0 0.000 0 0 0.000
22. 1.0 0.4 774 784 1.292 1839.4 1935.2 5.208 285 295 3.509
23. 1.0 0.6 22629.2 22975 1.528 20864.8 21290.2 2.039 132623 134451 1.369
24. 1.0 0.8 51664 51926.8 0.508 76158 76405.6 0.325 300435 301911.8 0.489
25. 1.0 1.0 91482.4 100839.4 10.228 109855.4110345.6 0.446 486114.2486581.6 0.096
Table 3. (RDD, TF) factor wise comparison – SIMEA I
From the table 3, it is observed that the average percentage of deviation is 1.91% from the
best known values for size n = 40; 1.49% for size n = 50; 1.3% for size n = 100.
Hybrid Search Heuristics to Schedule Bottleneck Facility in Manufacturing Systems
189
5.5. Performance Comparision of SIMEA II
The SIMEA II algorithm has also been implemented in the C++ language on a personal
computer with 1.3 GHz Pentium IV CPU and 128 MB main memory. SIMEA II is having the
following parameters POP = e
log
10
n
, M = n/2 and no. of iterations for termination is n*n. The
algorithm is tested on 125 bench mark instances of total weighted tardiness problems of
each sizes n = 40, n = 50 and n = 100.
The (RDD, TF) factor wise comparison for the average total weighted tardiness SIMEA II
with reduction heuristics and the percentage of deviation from the best known values are
given in the table 4.
n = 40 n = 50 n = 100
Average
weighted
tardiness
Average
weighted
tardiness
Average
weighted
tardiness
S.No RDD T.F.
Best
known
value
SIMEA
II
% of
deviation
Best
known
value
SIMEA
II
% of
deviation
Best
known
value
SIMEA
II
% of
deviation
1. 0.2 0.2 1151.8 1170 1.580 2184.4 2211.8 1.254 5343.8 5371.4 0.516
2. 0.2 0.4 9221.2 9369.4 1.607 13343.4 13363.8 0.153 52570 52797 0.432
3. 0.2 0.6 21464.8 21598 0.621 43196.8 43540.6 0.796 185027.8185655.2 0.339
4. 0.2 0.8 73120.2 73824.4 0.963 87714.4 88120.8 0.463 433824.6 434416 0.136
5. 0.2 1.0 112514 112769 0.227 189113 189373.2 0.138 665021.4 665842 0.123
6. 0.4 0.2 66.4 120.8 81.928 176.4 212 20.181 256.6 313.2 22.058
7. 0.4 0.4 4815.8 4905.4 1.861 6452.4 6712.6 4.033 24792.8 25412.8 2.501
8. 0.4 0.6 20039.8 20345.6 1.526 32574.6 32913 1.039 132402.4134384.2 1.497
9. 0.4 0.8 69790.8 70228 0.626 89835.2 91501 1.854 374993.8378026.8 0.809
10. 0.4 1.0 91736.8 92310.6 0.625 166049.6166540.8 0.296 691626.8 693124 0.216
11. 0.6 0.2 0 0 0.000 0 0 0.000 0 0 0.000
12. 0.6 0.4 3273.6 3575.4 9.219 3426.6 3745 9.292 12955 13465.2 3.938
13. 0.6 0.6 18541.2 18714.4 0.934 23277.6 24133.6 3.677 85544.2 87208.4 1.945
14. 0.6 0.8 71892.4 72350.2 0.637 81545.4 82350 0.987 315179.2316216.4 0.329
15. 0.6 1.0 90276 90897 0.688 130365 130864 0.383 607101.8608054.2 0.157
16. 0.8 0.2 0 0 0.000 0 0 0.000 0 0 0.000
17. 0.8 0.4 609.4 837 37.348 2191.2 2439 11.309 656.6 1065.2 62.230
18. 0.8 0.6 14593.8 15030.4 2.992 25873.8 26446.8 2.215 67259.2 69316.8 3.059
19. 0.8 0.8 49719.8 50249.2 1.065 63134.6 63622.4 0.773 295368.4 296488 0.379
20. 0.8 1.0 121667.6 121976 0.253 153155.6 153291 0.088 576902 577365.6 0.080
21. 1.0 0.2 0 0 0.000 0 0 0.000 0 0 0.000
22. 1.0 0.4 774 1111.6 43.618 1839.4 1973 7.263 285 310.4 8.912
23. 1.0 0.6 22629.2 23411.2 3.456 20864.8 22067.6 5.765 132623 135687 2.301
24. 1.0 0.8 51664 52064.6 0.775 76158 77737.6 2.074 300435 301742.4 0.433
25. 1.0 1.0 91482.4 92003.4 0.570 109855.4110337.6 0.439 486114.2487448.4 0.274
Table 4. (RDD, TF) factor wise comparison - SIMEA II
From the table 4, it is observed that the average percentage of deviation is 7.724% from the
best known values for size n = 40; 2.978% for size n = 50 and 4.506% for size n = 100.
Multiprocessor Scheduling: Theory and Applications
190
5.6. Performance Comparison of Algorithms
The average total weighted tardiness of all 125 problem instances obtained by different
search algorithms are calculated for the different sizes n = 40, n = 50 & n = 100 and
compared with the best known values and given in table 5.
S.No
n
Best
known
values
Backward
Heuristics
HIA ILIEA
SIMEA
I
SIMEA
II
1 40 37641.8 52602.07 38809.91 37745.35 38137.67 37954.46
2 50 52893.1 74157.74 54509.62 53086.02 53083.44 53339.87
3 100 217852.1 314076.6
Code Not
Structured
220978.9 218439.3 218788.4
Table 5. Comparison of Average Total weighted tardiness values
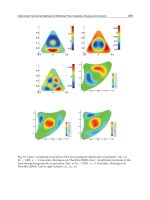
The percentage of deviation of the average total weighted tardiness obtained by the
different algorithms are calculated and given in figure 9.
n = 40
n = 40
n = 40
n = 40
n = 50
n = 50
n = 50
n = 50
n = 100
n = 100
n = 100
0
0.5
1
1.5
2
2.5
3
3.5
HIA ILIE A SIMEA I SIMEA II
Algorithms
Percentage of Deviation
Figure 9. Performance Comparison
From the figures, it is experienced that the performance of heuristic improvement algorithm
is poor for the higher sizes of n. This algorithm is giving results within less computational
time and it is not able to solve the problems of size n = 100 effectively and so not included in
the figure 9.
The iterated local improvement algorithm is giving results closer to the best known values
for n = 40 than other algorithms. But, when size of the problem is increased the percentage
of deviation is also increasing.
Hybrid Search Heuristics to Schedule Bottleneck Facility in Manufacturing Systems
191
But self improving mutation evolutionary algorithms perform well for higher sizes of
problems. It is observed SIMEA II is producing similar results with lesser computational
time than SIMEA I.
5.7. Percent Improvement
Since all the three algorithms have been developed from the backward heuristic sequence,
the percent improvement of the different heuristic search algorithms are calculated by the
formula,
Percent improvement
= x100
Z
ZZ
phase)(backward
)(algorithmphase)(backward
−
% (6)
The average percent improvement of the various heuristic search algorithms from backward
phase heuristic for different sizes n = 40, n = 50 & n = 100 are given in the table 6 and
comparison of percent improvement is shown in figure 10.
S.No
n HIA ILIEA SIMEA I SIMEA II
1. 40 26.22 28.24 27.50 27.85
2. 50 26.49 28.41 28.41 28.07
3. 100 NA 29.64 30.45 30.33
Table 6. Average Percent Improvement from Backward Heuristics
24
25
26
27
28
29
30
31
n = 40 n = 50 n = 100
Number of Jobs
Percent Improvement
HIA
ILIEA
SIMEA I
SIMEA II
Figure 10. Comparison of Percent Improvement
The observations on percent improvement reveals that SIMEA I & SIMEA II provide higher
improvements than other two heuristic algorithm namely, HIA & ILIEA. Besides this, HIA is
not structured to solve problems of higher size (i.e. n = 100).
6. Conclusion
Scheduling function is embedded in the domain of production planning control and it plays
an important role in the manufacturing process. The bottleneck scheduling problems can
arise in different practical situations in the manufacturing system. The objective function of
scheduling problem may be minimization of make span, lateness, weighted measures etc. In
Multiprocessor Scheduling: Theory and Applications
192
weighted performance measure cases, the priority indexes may be given to different jobs
according to the importance. Total weighted tardiness problems are proved to be NP hard
type problems. Enumerative methods are time consuming to solve problems of higher sizes
and construction heuristics are giving inaccurate results. In practice, there is a need to get
near optimal solutions within reasonable time. Heuristic search algorithms are used to get
near optimal solution. In this work, an attempt is made to hybridize trajectory and
population methods for solving the bottleneck facility total weighted tardiness problems.
The three heuristic search algorithms are developed and used to solve the different
benchmark instances.
Heuristic improvement algorithm is a trajectory method operating on a single sequence
developed by some construction heuristics as initial sequence. The forward heuristic is
working by a heuristic procedure with interchange method. It is observed that the process of
this improvement algorithm is tedious and is not able to solve problems of higher sizes
The ILIEA algorithm uses only a single pair of parents; one sequence obtained from a greedy
backward phase heuristic and the other by random generation act as the initial parents. The
performance of this algorithm, with and without crossover operation, is compared. The
average percentage of deviation is ranging from 27.54% to 38.28% for the iterated local
improvement algorithm without crossover and the ranging from 0.28% to 16.84% for the
iterated local improvement evolutionary algorithm with crossover.
SIMEA I algorithm is the extended form of the iterated local improvement evolutionary
algorithm with size of the population equal to number of jobs. Further, a log arithmetic
reduction rule is applied in the parent selection to develop another version SIMEA II and tested
with benchmark instances of SMTWTP. The performance of these two versions is compared
and it is observed SIMEA II is producing similar results with lesser computational time.
7. References
Abdul-razaq T. S., Potts C. N. and VanWassenhove L. N. (1990), A survey of algorithms for
the single-machine total weighted tardiness scheduling problem, Discrete Applied
Mathematics, Vol. 26, pp. 235 - 253.
Ackley D.H. (1987), A connectionist machine for genetic hill climbing, Kluwer Academic Press,
Boston.
Bahram Alidaee and Ramakrishnan K.R. (1996), A Computational Experiment of Covert-AU
Class of Rules for Single Machine Tardiness Scheduling Problems, Computers
Industrial Engineering Journal, Vol. 30, No. 2, pp 201 – 209.
Beasley J.E., O.R. library, />Baker K.R. (1995), Elements of Sequencing and Scheduling, Amos Tuck School, Dartmouth
College, Hanover, NH.
Blackstone J., Phillips D. and Hogg G. (1982), A state-of-the-art survey of dispatching rules
for manufacturing job shop operations, International Journal of Production Research,
Vol. 20, No. 1, pp. 27-45.
Congram R. K., Potts C. N. and Van de Velde S. L. (1998), An iterated dynasearch algorithm for
the single machine total weighted tardiness scheduling problem, Technical report, Faculty
of Mathematical Studies, University of Southampton, Southampton, UK.
Crauwels H. A. J., Potts C. N. and Van Wassenhove L. N. (1998), Local search heuristics for
the single machine total weighted tardiness scheduling problem, INFORMS Journal
on Computing, Vol. 10, No. 3, pp. 341 - 350.
Hybrid Search Heuristics to Schedule Bottleneck Facility in Manufacturing Systems
193
Della Croce F., Tadei R., Baracco P. and Grosso A. (1998), A New Decomposition Approach
for the Single Machine Total Tardiness Scheduling Problem, Journal of the
Operational Research Society, Vol. 49, pp. 1101- 1106.
Den Besten M. L., Stützle T., and Dorigo M. (2000), Ant colony optimization for the total
weighted tardiness problem, In the proceedings Parallel Problem Solving from Nature:
6th international conference of Berlin, Marc Schoenauer, Kalyanmoy Deb, Günter
Rudolph, Xin Yao, Evelyne Lutton, Juan Julian Merelo, and Hans-Paul Schwefel,
editors, Springer Verlag. Vol.1917 of LNCS, pp. 611-620.
Deshpande A. S. and Triantaphyllou E. (1998), A Greedy Randomized Adaptive Search
Procedure (GRASP) for Inferring Logical Clauses from Examples in Polynomial Time
and some Extensions, Mathematical and Computer Modeling, Vol. 27, No. 1, pp. 75-99.
Dileep R. Sule (1997), Industrial Scheduling, PWS Publishing Company, An International
Thomson Publishing Company.
Drobouchevitch G., Strusevich V.A. (2000), Heuristics for the two-stage job shop scheduling
problem with a bottleneck machine, European Journal of Operational Research, Vol.
123, pp. 229-240.
Drobouchevitch I.G., Strusevich V.A. (2001), Two-stage open shop scheduling problem with
a bottleneck machine, European Journal of Operational Research, Vol. 128, pp. 159-174.
Du J. and Leung J.Y.T. (1990), Minimizing Total Tardiness on One Machine is NP Hard,
Mathematics of Operational Research, Vol. 15, pp. 483 – 495.
Feo T. A. and Resende M. G. C. (1995), Greedy Randomized Adaptive Search Procedures,
Journal of Global Optimization, Vol. 6, pp. 109-133.
Glover F. (1989), Tabu Search. Part I, ORSA Journal on Computing, Vol. 1, pp. 190-206.
Glover F. (1990), Tabu Search. Part II, ORSA Journal on Computing, Vol. 2, pp. 4-32.
Glover F., Kelly J., and Laguna M. (1995), Genetic Algorithms and Tabu Search: Hybrids for
Optimization, Computers and Operations Research, Vol. 22, No. 1, pp. 111-134.
Glover F., Taillard E., and de Werra D. (1993), A User’s Guide to Tabu Search, Annals of
Operations Research, Vol. 41, pp. 3-28.
Goldberg D. E. (1989), Genetic Algorithms in Search, Optimization and Machine Learning,
Addison-Wesley, Reading, MA.
Haupt R. (1989), A Survey of Priority Rule-Based Scheduling, OR Spektrum Vol. 11, pp. 3- 16.
Helena R. Lourenco, Olivier Martin and Thomas Stutzle (2001), A Beginner’s Introduction to
Iterated Local Search, In the Proceedings of MIC’2001 - 4th Meta-heuristics
International Conference at Porto, Portugal.
Helena Ramalhinho Lourenco (1995), Job Shop Scheduling: Computational Study of Local
Search and Large-Step Optimization Methods, European Journal of Operational
Research, Vol. 83, No. 2, pp. 347 – 364.
Kirkpatrick S., Gelatt Jr C. D. and Vecchi M. P. (1983), Optimization by Simulated
Annealing, Science, Vol. 220, pp. 671-680
.
Lawler E.L. (1977), A ‘Pseudopolynomial’ algorithm for sequencing jobs to minimize total
tardiness, Annals of discrete Mathematics, Vol. 1, pp. 331–342.
Lawler E. L. and Wood D. E. (1966), Branch-and-bound methods: A survey, Operations
Research, Vol. 14, No, 4, pp. 699-719.
Maheswaran. R and Ponnambalam S.G., (2003) An Investigation on Single Machine Total
Weighted Tardiness Scheduling Problems, International Journal on Advanced
Manufacturing Technology, Vol. 22, No. 3 – 4, pp. 243 – 248.
Multiprocessor Scheduling: Theory and Applications
194
Maheswaran. R., (2004), Heuristics Search Algorithms in Single Machine Scheduling,
Unpublished Ph.D Thesis, Manonmanium Sundaranar University, Trinelveli.
Maheswaran. R and Ponnambalam S.G., (2005) An Intensive Search Evolutionary Algorithm
for Single Machine Total Weighted Tardiness Scheduling Problems, International
Journal on Advanced Manufacturing Technology, Vol. 25, No. 7 - 8, pp. 772 – 776.
Maheswaran. R, Ponnambalam S.G. and Aravindan C. (2005) A Meta-heuristic approach to
Single Machine Scheduling Problems, International Journal on Advanced
Manufacturing Technology, Vol. 26, No. 9 - 10, pp. 1150 – 1156.
Montazer M. and Van Wassenhove L. (1990), Analysis of scheduling rules for an FMS,
International Journal of Production Research, Vol. 28, pp. 785-802.
Morton, T. E., Pentico, D. W. (1993), Heuristic Scheduling Systems; With Applications to
Productions Systems and Project Management, John Wiley & Sons Inc., New York,
Chichester, Brisbane, Toronto, Singapore.
Osman I. H. (1996), Metaheuristics: A Bibliography, Annals of Operations Research, Vol. 63,
pp. 513-623.
Osman I. H. and Kelly, J. P. (1996), Meta-Heuristics: An Overview, in Meta-Heuristics: Theory
& Applications, Kluwer Academic Publishers, Boston/London/Dordrecht
.
Panwalker S. and Iskander W. (1977), A survey of scheduling rules, Operations Research, Vol.
25, No. 1, pp. 45-61.
Paulo M. Franca, Alexandre Mendes and Pablo Moscato (2001), A Memetic Algorithm for
the Total Tardiness Single Machine Scheduling Problem, European Journal Of
Operational Research, Vol. 132, No.1, pp 224 - 242.
Potts C.N. and Van Wassenhove L.N. (1982), A Decomposition Algorithm for the Single
Machine Tardiness Problem, Operations Research Letters Vol. 32, pp. 177-181.
Potts C. N. and VanWassenhove L. N. (1985), A branch and bound algorithm for total
weighted tardiness problem, Operations Research, Vol. 33, pp. 363 - 377.
Radcliffe N.J., and Surry P.D. (1994), Formal Memetic Algorithm, Evolutionary Computing,
Selected Papers from AISB Workshop, Lecture Notes in Computer Science,
Springer Verlag, pp. 1 – 16.
Reeves C. R. (1993), Modern Heuristic Techniques for Combinatorial Problems, Blackwell
Scientific Publications, Oxford.
Schrage L.E. and Baker K.R. (1978), Dynamic Programming Solution of Sequencing
Problems with Precedence Constraints, Operations Research Vol. 26, pp. 444-449.
Shapiro J. (1979), A survey of Lagrangian techniques for discrete optimization, Annals of
Discrete Mathematics, Vol. 5, pp. 113-138.
Szwarc W. and Mukhopadhyay S. (1997), Decomposition of the Single Machine Total
Tardiness Problem, Operations Research Letters, Vol. 19, pp. 243-250.
Starkweather. T., McDaniel. S., Whitley. C., Mathias. K., Whitley. D. (1991), A Comparison of
Genetic Sequencing Operators, In the proceedings of the 4
th
International Conference on
Genetic Algorithms, San Diego, California, Morgan Kaufmann, publishers, pp. 69-76.
Thomas Baeck, Frank Hoffmeister and Hans Paul Schwefel, (1991), A survey of evolution
strategies, In proceedings of the 4
th
International Conference on Genetic Algorithms,
Morgan Kaufmann, San Mateo.
Tsiushuang C., Xiangtong Q. and Fengsheng T. (1997), Single machine scheduling to
minimize weighted earliness subject to maximum tardiness, Computers Operations
Research, pp. 147-157.