Báo cáo hóa học: "Membrane Surface Nanostructures and Adhesion Property of T Lymphocytes Exploited by AFM" ppt
Bạn đang xem bản rút gọn của tài liệu. Xem và tải ngay bản đầy đủ của tài liệu tại đây (395.44 KB, 6 trang )
NANO EXPRESS
Membrane Surface Nanostructures and Adhesion Property
of T Lymphocytes Exploited by AFM
Yangzhe Wu Æ Hongsong Lu Æ Jiye Cai Æ
Xianhui He Æ Yi Hu Æ HongXia Zhao Æ
Xiaoping Wang
Received: 29 March 2009 / Accepted: 5 May 2009 / Published online: 5 June 2009
Ó to the authors 2009
Abstract The activation of T lymphocytes plays a very
important role in T-cell-mediated immune response.
Though there are many related literatures, the changes of
membrane surface nanostructures and adhesion property of
T lymphocytes at different activation stages have not been
reported yet. However, these investigations will help us
further understand the biophysical and immunologic
function of T lymphocytes in the context of activation. In
the present study, the membrane architectures of peripheral
blood T lymphocytes were obtained by AFM, and adhesion
force of the cell membrane were measured by acquiring
force–distance curves. The results indicated that the cell
volume increased with the increases of activation time,
whereas membrane surface adhesion force decreased, even
though the local stiffness for resting and activated cells is
similar. The results provided complementary and important
data to further understand the variation of biophysical
properties of T lymphocytes in the context of in vitro
activation.
Keywords T lymphocytes Á Cell activation Á
Membrane nanostructures Á Adhesion force
Introduction
Human peripheral blood T lymphocytes play a key role in
human adaptive immunity. Though the activation process
of T lymphocytes in vivo or in vitro has been well-studied
immunologically and biochemically, however, whether the
membrane surface nanostructures and adhesion property
change in the process of T lymphocyte activation in vitro is
largely unknown yet. However, the characterization of the
nano-mechanical changes in the process of T lymphocytes
activation in vitro has been hampered by the lack of sen-
sitive quantitative techniques [1]. Atomic force microscopy
(AFM) [2] is a powerful nano-technology tool that has
been applied to observe DNA micropatterns on the poly-
carbonate surface [3], to fabricate the nanostructure mate-
rials [4], and to measure the adhesion force, elasticity and
stiffness of sample [5–9]. The ultra-high force sensitivity of
AFM and its ability to measure properties of individual cell
makes the technique particularly appropriate for measuring
viscoelastic changes of cell membrane. However, up to
now, there are only a few reports of AFM application on
T-cell-related studying. Franco-Obrego
´
netal.[10]reported
on the application of AFM to measure distinct ion channel
classes on the outer nuclear envelope of human Jurkat
T cell, and to determine the density of pore proteins.
Wojcikiewicz et al. studied the interaction of leukocyte
function-associated antigen-1 (LFA-1), expressed on Jurkat
T cells, with intercellular adhesion molecules-1 and -2
Y. Wu Á J. Cai (&) Á Y. Hu
Chemistry Department, Jinan University, Guangzhou 510632,
Guangdong, People’s Republic of China
e-mail:
Y. Wu
e-mail:
H. Lu Á X. He
Institution for Tissue Transplantation and Immunology,
Jinan University, Guangzhou 510632, Guangdong,
People’s Republic of China
H. Zhao
Faculty of Chemical Engineering and Light Industry,
Guangdong University of Technology, Guangzhou 510090,
People’s Republic of China
X. Wang
The First Affiliated Hospital, Jinan University, Guangzhou
510632, Guangdong, People’s Republic of China
123
Nanoscale Res Lett (2009) 4:942–947
DOI 10.1007/s11671-009-9340-8
using AFM, and the interaction between individual pairs of
living T lymphocytes and endothelial cells [1, 11–13]. The
studies on biophysical properties (topography, nanostruc-
tures, adhesion force, stiffness, and others) of cells will
provide fundamental insights into cellular structures and
biology functions [14]. However, the variation of mem-
brane surface nanostructures and nano-mechanical property
of T lymphocytes in the context of in vitro activation
remains unclear.
In the present work, we reported on the application of
AFM to characterize the topography and to measure the
membrane adhesion force in the process of human
peripheral blood T lymphocytes upon in vitro activation.
Firstly, we evaluated the effect of fixative (glutaraldehyde)
and cell isolation process on the adhesion force of cell
membrane, indicating the fixative resulted in the increases
of adhesion force of cell membrane, whereas cell isolation
process decreased the adhesion force. Then, we found that
the adhesion force of lymphocytes decreased with the
increasing of the activation time. Our results provide
complementary and important data for further interpreting
the activation time-dependent variation of membrane sur-
face nanostructures and nano-mechanics, which may be
helpful in investigating the membrane function of T lym-
phocytes at the nanoscale resolution.
Materials and Methods
T Lymphocyte Isolation and Preparation
Peripheral venous blood was drawn from healthy, drug-free
adult donors and mixed with an anticoagulant (heparin)
immediately. The isolation of T lymphocytes was conducted
according to the RosetteSep Procedure: (1) 100 lLof
RosetteSep
Ò
human CD3
?
T lymphocyte enrichment cocktail
was fully mixed with 2 mL of whole blood, and incubated for
20 min at room temperature; (2) diluted with 2 mL of PBS
containing 2% bovine serum albumin (BSA) gently; (3)
layered the diluted solution on the top of 3 mL density
medium (Ficoll), then centrifuged at 1200g for 20 min; (4)
remove the enriched cells from the density medium:blood
plasma interface, and washed the enriched cells with 2% PBS
(centrifuged at 425g for 10 min) (repeated once). The iso-
lated T lymphocytes (1.44 9 10
6
) were cultured with culture
medium RPMI 1640 for the next experiments.
To understand the effects of glutaraldehyde fixative on
adhesion force, we firstly performed two groups that
included unfixed cells and fixed cells respectively (which
did not incubate in culture medium), and the group of fixed
cells was set as control I. However, because fixative could
stabilize cell membrane, glutaraldehyde was still used in
the following experiments to acquire the repeatable images
and force–distance curves. To estimate the effects of iso-
lation process on cells, we measured the adhesion force of
cells that incubated in culture medium for 24 h (no stim-
ulation), and the acquired data were set as control II. Then,
three testing (activation) groups, which were stimulated
with phorbol dibutyrate (PDB, 1 9 10
-7
mol/mL;
Calbiochem Co.) plus ionomycin (ION, 0.5 lg/mL; Sigma)
for 6, 24, and 48 h were performed. Cells were fixed by
2.5% glutaraldehyde (Sigma) in buffer solution for 10 min
and air dried before AFM measurements. The prepared
samples were measured immediately by AFM.
AFM Measurements
Atomic force microscopy (Autoprobe CP Research, Veeco,
USA) was performed using a commercial AFM, which was
performed in the contact mode or the tapping mode in air
(room temperature, humidity: 75%). The glass substrate
carrying cells was mounted onto the XY stage of the AFM
and the integral video camera was used to locate the cells.
The curvature radius of the silicon tip is less than 10 nm,
scan rate is 0.3–1 Hz.
The contact mode was for measuring adhesion force
(f, pN) cell membrane. Over ten thousands force curves were
acquired, each curve representing the mean value of
15 times automatic measurements by the instrument. The
tapping mode was for topographical analysis. The acquired
images were reproducible during repeated scanning. More
than 20 cells were investigated by the same two AFM probes
(the tapping-mode probe for imaging and the contact-mode
probe for force acquisition) for statistic analysis. And the
adhesion force measurement of all samples was carried out
with the same contact mode probe in air at room temperature.
Data Processing and Statistics
The acquired images (256 9 256 pixels) were only pro-
cessed with the instrument-equipped software (Image
Processing Software Version 2.1, IP 2.1) to eliminate low-
frequency background noise in the scanning direction or to
level the images (flatten order: 0–2). The data were
reported as mean ± SD, and data analysis was conducted
using Origin 6.0 software. The cell stiffness was qualita-
tively analyzed according to reported methods [7, 8, 15].
Results
Topographical Changes of T Lymphocytes
in Activation
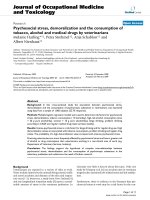
Resting T lymphocytes present typical spherical shape
(Fig. 1a–c), and cellular microvilli and pseudopodia are
Nanoscale Res Lett (2009) 4:942–947 943
123
clearly seen at the edge of cell. Figure 1b is an error-signal
mode image, in which the structural details like pseudo-
podia can be more easily distinguished. Figure 1c shows
nanostructural image of cell membrane, indicating the
smooth and intact membrane surface structure. Figure 1i
presents a height profile generated along the broken line in
Fig. 1a, and measurement indicated the size of cell is
4.5 lm in diameter and 1.87 lm in height.
Figure 1d–h indicates topographies and nanostructures
of activated T lymphocytes, and the lamellipodia-like
protrusion that is found to have a height of about 310 nm
(profile 1k) is shown by white dotted line in Fig. 1d and the
black arrow in Fig. 1e. Figure 1g is an enlarged view
(error-signal mode) of the square frame in Fig. 1f, and
cellular pseudopodia are shown by black arrows. Figure 1h
displays a representative nanostructural image of mem-
brane surface, displaying a large number of concaves or
membrane pores, whose average size is 40.73 ± 10.95 nm
in diameter; and the largest concave is about 200 nm in
diameter and 62 nm in depth, as shown in height profile
Fig. 1l. Figure 1j presents a height profile generated along
the black broken line in Fig. 1d, showing the size of cell is
5.469 lm in diameter and 2.34 lm in height.
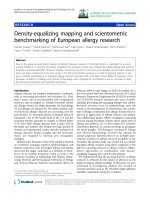
To quantify the topographical difference between rest-
ing and activated CD3
?
T lymphocytes, a statistical anal-
ysis was performed as shown in Fig. 2, including the
changes of average roughness (Ra) and particle mean
height of surface nanostructure, cell height, cell diameter
and cell volume. The results demonstrate that cell volume
double increases from 42.87 ± 0.84 lm
3
(resting) to
94.24 ± 8.81 lm
3
(activation) (Fig. 2c), which is in
accordance with the increases of cell height and cell
diameter (Fig. 2b). When the measurements were con-
ducted on nanoscale images, the results indicated that both
average roughness (Ra) and the mean height of membrane
surface particles increased after activation (Fig. 2a).
Adhesion Force Changes of T Lymphocytes
in Activation
To compare the difference in adhesion property of cell
membrane between resting and activated T lymphocytes,
Fig. 1 a–c Representative AFM topographical images of resting T
lymphocyte. a 3-D image of a resting T lymphocyte; b error-signal
mode image of a, the size of cell is 4.5 lm in diameter and 1.87 lm
in height as shown in height profile (i), and cellular pseudopodia at
the edge of cell could be clearly seen (b); c nanostructural image. d–h
Representative AFM images of activated T lymphocytes. d 3-D image
of an activated T lymphocyte; e error-signal mode image of d, the size
of cell is 5.469 lm in diameter and 2.34 lm in height as shown in
height profile (j). The lamellipodia-like protrusion was also clearly
visible (white dotted line in d and arrow in e, whose height is
310.1 nm as shown in height profile (k). g An enlarged error-signal
mode image of the square frame in f; h nanostructural image
possessing many concaves and the size of the largest concave is
192.2 nm in diameter and 62.15 nm in depth, which is shown by
profile (l) that generated along the broken line in h
944 Nanoscale Res Lett (2009) 4:942–947
123
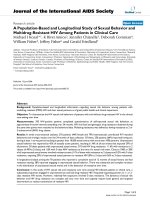
surface adhesion force was measured by acquiring
force–distance curves. Figure 3a–f presents representative
force–distance curves. To analyze the effects of fixative on
cellular mechanical properties, we firstly measured adhesion
force of fixed and unfixed lymphocytes (Fig. 3a, b). The
results indicated that the fixative results in the increases of
adhesion force of T cell membrane (Fig. 3g).
On the other hand, AFM observation exhibits that the
topography of T lymphocytes could be easily affected by
the isolation processes (such as centrifugation, washing
with PBS). Therefore, to evaluate how the isolation process
alters the adhesion property of cell membrane, the differ-
ence of adhesion force between control I (non-incubated)
and control II (incubated) (Fig. 3b, c) were then analyzed.
The results clearly indicated that the adhesion force
increased from 618 ± 207.28 pN (control I group) to
1025 ± 399.84 pN (control II group) (Fig. 3h), implying
isolation processes lowered the membrane surface adhesion
force.
Figure 3d, e, and f presents representative force–
distance curves of T lymphocytes that were stimulated with
PDB plus ION for 6, 24 and 48 h, respectively. The sta-
tistical analysis (Fig. 3h) suggests that the adhesion force
of cell membrane decreased with the increases of stimu-
lation time.
Discussion
AFM is not only a surface imaging technique, but also a
sensitive force spectrometer. It has emerged as a powerful
tool to measure the changes of mechanical property of cell
membrane [5, 6, 8, 16–19], cell stiffness [8, 17], cell vis-
coelasticity [20, 21], and to measure the interaction
between cells [1], by which one could get some valuable
information about the biophysical changes of the activated
lymphocytes. AFM-based force spectroscopy is also
particularly well suited for research in cell adhesion [19],
and can stretch cells thereby allowing measurement of their
rheological properties [17].
AFM observation indicates that cellular topography
changed after PDB plus ION treatment for 24 h (Fig. 2),
for example, the cell volume increased due to the cell
activation. Cellular pseudopodia and lamellipodia-like
protrusion of activated cells become more obvious and
abundant, and the nanostructures of nano-concaves or
membrane pores formed on the membrane surface of
activated cell are readily seen (Fig. 1h); however, the cell
membrane of resting T lymphocytes maintains integrity
(Fig. 1c). The topographical and nanostructural changes
(such as formation of membrane concaves/pores) might
correlate with cytoskeleton rearrangement and/or more
mass exchange of activated T cells than resting T cells.
Furthermore, the comparison of adhesion force between
fixed cells and unfixed cells reveals that fixative can result
in the increases of adhesion force of cell membrane, which
is in accordance with the previous literature result [22]. On
the other hand, the isolation process also affects the
mechanical properties of T lymphocytes, inducing the
decreases of the adhesion property of cell membrane. This
result implies that the isolation process may affect the
membrane biological function of T lymphocytes. Further-
more, as for testing groups, the measured adhesion force is
clearly smaller than that of both control I and control II
groups; after stimulated by PDB plus ION, the adhesion
force decreases with the increases of stimulation time
(Fig. 3h), and reaches the lowest at the stimulation time of
24 h, whereas the cell stiffness does not change obviously
according to the qualitative analysis of approaching branch
of force–distance curves.
The human immune system mainly includes cell-mediated
immune system and humoral immune system. T
lymphocytes play a key role in cell-mediated immune
response, and the activation investigation of T lymphocytes
Fig. 2 Histograms of statistical results. a, b The average roughness
and cell height of the resting and the activated groups are
approximately equal. However, mean height of particles of surface
nanostructure, cell diameter and cell volume in the activated group
are larger than those in the resting group (a–c)
Nanoscale Res Lett (2009) 4:942–947 945
123
in vitro can help researchers interpret the function of the
whole immune system. Because the activation process of T
cells is a key stage in T-cell mediated immune response,
the investigation of biophysical changes of T cells could
lead to further understanding of the mechanism of immune
response. Phorbol dibutyrate (PDB), an effective T cell
mitogen and an activator of protein kinase C (PKC), can
enter cells and activate T lymphocytes. Ionomycin (ION) is
aCa
2?
ionophore and used in research to raise the intra-
cellular level of Ca
2?
and in research on Ca
2?
transport
across biological membranes ( />Ionomycin). Therefore, PDB plus ION can play the role of
the ‘‘two-signal’’ of T cell activation. In the process of
activation and proliferation of T lymphocytes, the variation
of both cellular topography and membrane biophysical
properties might correlate with the changes of biological
function of T lymphocytes, such as the phosphorylation of
signaling molecules, changes of cell polarity, and Ca
2?
release [23–26]. Moreover, both PDB and ION are strong
pharmaceutical reagents that can quickly upregulate CD69
expression as early as 4 h after stimulation [27], and
following the expression of CD25 and CD71, therefore, the
expression of these activation markers and the mitosis of
cells might altogether contribute to the changes of cellular
topography and the decreases of membrane adhesion force.
In this work, the measurement results are useful to further
understand the relationship between cellular topography or
membrane mechanical property and the function of T
lymphocytes in immune response, which provide the
complementary data on studying T cell in vitro activation.
Conclusions
In the present work, the characterization of cellular topog-
raphy and measurement of membrane adhesion force in the
process of activation and proliferation of T lymphocytes are
reported. After stimulated with PDB plus ION for 24 h, the
cell volume of T lymphocytes increased onefold; the adhe-
sion force, however, decreased approximately to one-fifth
control II. As the activation time increased (6, 24, and 48 h),
the adhesion force of lymphocytes decreased, and it was the
Fig. 3 Representative force–
distance curves. a Force curve
of unfixed cells. b Force curve
of fixed cells, which were
measured immediately after
isolation. c Force curve of fixed
cells (control II) that incubated
in culture medium for 24 h after
isolation. d–f Force curves of
fixed T cells, which were
activated for 6, 24 and 48 h,
respectively. According to the
slope variation of approaching
portion of force curve (black
double-head arrow in a), the
changes of cell stiffness can be
preliminary determined. g
Histograms of statistical results
of surface adhesion force,
showing the fixed cells have a
greater adhesion force than
unfixed cells. h Comparison of
adhesion force of control groups
and testing groups, indicating
the adhesion force of non-
incubated cells (control I) is
smaller than that of incubated
cells (control II); and the cell
surface adhesion force
decreases with the increases of
activation time
946 Nanoscale Res Lett (2009) 4:942–947
123
smallest at the 24 h stimulation time, but the cell stiffness
does not alter obviously. The variation in membrane nano-
structures adhesion force between resting cells and activated
cells might closely correlate with the stimulus-induced
changes in immunologic function of T lymphocytes. Taken
together, this investigation provides complementary and
important data to further interpret the relationship between
immune function and the biophysical properties of
T lymphocytes.
Acknowledgements This work was supported by the general pro-
ject of NSFC (No. 60578025 and No. 30540420311) (J. C.), the
general project of NSFC (No. 30572199) and the major project of
NSFC (No. 30230350) (X. H.).
References
1. X. Zhang, E.P. Wojcikiewicz, V.T. Moy, Exp. Biol. Med. 231,
1306 (2006)
2. G. Binnig, C.F. Quate, C. Gerber, Phys. Rev. Lett. 56, 930
(1986). doi:10.1103/PhysRevLett.56.930
3. Z. Wang, R.X. Li, Nanoscale Res. Lett. 2, 69 (2007). doi:
10.1007/s11671-006-9032-6
4. S.R. Jian, J.Y. Juang, Nanoscale Res. Lett. 3, 249 (2008). doi:
10.1007/s11671-008-9144-2
5. H.J. Butt, B. Cappella, M. Kappl, Surf. Sci. Rep. 59, 1 (2005).
doi:10.1016/j.surfrep.2005.08.003
6. K. Waar, H.C. van der Mei, H.J.M. Harmsen, J. de Vries, J.
Atema-Smit, J.E. Degener, H.J. Busscher, Microbiology-Sgm
151, 2459 (2005). doi:10.1099/mic.0.27877-0
7. S.E. Cross, Y.S. Jin, J. Rao, J.K. Gimzewski, Nat. Nanotechnol.
2, 780 (2007). doi:10.1038/nnano.2007.388
8. W.A. Lam, M.J. Rosenbluth, D.A. Fletcher, Blood 109, 3505
(2007). doi:10.1182/blood-2006-08-043570
9. P. Parot, Y.F. Dufrene, P. Hinterdorfer, C. Le Grimellec, D.
Navajas, J.L. Pellequer, S. Scheuring, J. Mol. Recognit. 20, 418
(2007). doi:10.1002/jmr.857
10. A. Franco-Obregon, H.W. Wang, D.E. Clapham, Biophys. J. 79,
202 (2000). doi:10.1016/S0006-3495(00)76284-9
11. E.P. Wojcikiewicz, M.H. Abdulreda, X. Zhang, V.T. Moy, Bio-
macromolecules 7, 3188 (2006). doi:10.1021/bm060559c
12. X. Zhang, A. Chen, D. De Leon, H. Li, E. Noiri, S. Elitok, V.T.
Moy, M.S. Goligorsky, J. Am. Soc. Nephrol. 14, 46 (2003). doi:
10.1097/01.ASN.0000037401.02391.76
13. X. Zhang, E. Wojcikiewicz, V.T. Moy, Biophys. J. 83, 2270
(2002). doi:10.1016/S0006-3495(02)73987-8
14. W.F. Heinz, J.H. Hoh, Trends Biotechnol. 17, 143 (1999). doi:
10.1016/S0167-7799(99)01304-9
15. S. Strasser, A. Zink, G. Kada, P. Hinterdorfer, O. Peschel, W.M.
Heckl, A.G. Nerlich, S. Thalhammer, Forensic Sci. Int. 170,8
(2007). doi:10.1016/j.forsciint.2006.08.023
16. W.R. Bowen, R.W. Lovitt, C.J. Wright, J. Colloid Interface Sci.
237, 54 (2001). doi:10.1006/jcis.2001.7437
17. E. Canetta, A. Duperray, A. Leyrat, C. Verdier, Biorheology 42,
321 (2005)
18. V. Lulevich, T. Zink, H.Y. Chen, F.T. Liu, G.Y. Liu, Langmuir
22, 8151 (2006). doi:10.1021/la060561p
19. E.P. Wojcikiewicz, X. Zhang, A. Chen, V.T. Moy, J. Cell Sci.
116, 2531 (2003). doi:10.1242/jcs.00465
20. W. Fritzsche, Microsc. Res. Tech. 44, 357 (1999). doi:10.1002/
(SICI)1097-0029(19990301)44:5\357::AID-JEMT7[3.0.CO;2-U
21. W. Fritzsche, E. Henderson, Ultramicroscopy 69, 191 (1997).
doi:10.1016/S0304-3991(97)00043-0
22. G.A. Burks, S.B. Velegol, E. Paramonova, B.E. Lindenmuth, J.D.
Feick, B.E. Logan, Langmuir 19, 2366 (2003). doi:10.1021/la026
375a
23. J.K. Burkhardt, E. Carrizosa, M.H. Shaffer, Annu. Rev. Immunol.
26, 233 (2008). doi:10.1146/annurev.immunol.26.021607.090347
24. S. Dadsetan, L. Zakharova, T.F. Molinski, A.F. Fomina, J. Biol.
Chem. 283, 12512 (2008). doi:10.1074/jbc.M709330200
25. S. Feske, Nat. Rev. Immunol. 7, 690 (2007). doi:10.1038/nri2152
26. P.A. Negulescu, T.B. Krasieva, A. Khan, H.H. Kerschbaum,
M.D. Cahalan, Immunity 4, 421 (1996). doi:10.1016/S1074-7613
(00)80409-4
27. L. Xu, Y. Liu, X. He, Cell. Mol. Immunol. 2, 295 (2005)
Nanoscale Res Lett (2009) 4:942–947 947
123