Báo cáo hóa học: "Alloying and Strain Relaxation in SiGe Islands Grown on Pit-Patterned Si(001) Substrates Probed by Nanotomography" doc
Bạn đang xem bản rút gọn của tài liệu. Xem và tải ngay bản đầy đủ của tài liệu tại đây (317.65 KB, 5 trang )
NANO EXPRESS
Alloying and Strain Relaxation in SiGe Islands
Grown on Pit-Patterned Si(001) Substrates Probed
by Nanotomography
F. Pezzoli Æ M. Stoffel Æ T. Merdzhanova Æ
A. Rastelli Æ O. G. Schmidt
Received: 30 April 2009 / Accepted: 24 May 2009 / Published online: 6 June 2009
Ó to the authors 2009
Abstract The three-dimensional composition profiles of
individual SiGe/Si(001) islands grown on planar and
pit-patterned substrates are determined by atomic force
microscopy (AFM)-based nanotomography. The observed
differences in lateral and vertical composition gradients are
correlated with the island morphology. This approach
allowed us to employ AFM to simultaneously gather
information on the composition and strain of SiGe islands.
Our quantitative analysis demonstrates that for islands with
a fixed aspect ratio, a modified geometry of the substrate
provides an enhancement of the relaxation, finally leading
to a reduced intermixing.
Keywords SiGe Á Island Á Alloying Á Wet etching Á
Tomography Á AFM Á Lateral ordering
Introduction
The lattice mismatch between Si and Ge drives the for-
mation of SiGe quantum dots (QD) during strained layer
heteroepitaxy [1, 2]. For large-scale integration technolo-
gies [3], the position of such islands needs to be accurately
controlled on the substrate surface [4]. A viable process
relies on the fabrication of lithographically defined pits,
which act as a sink for the deposited adatoms, allowing the
exact positioning and addressability of individual QDs. In
addition, a precise control of the chemical composition of
the SiGe islands is required, since the three-dimensional
(3D) composition profile ultimately determines their elec-
tronic behavior and optical properties. However, little work
has been done on this topic, and the different intermixing
mechanisms sustaining the growth and evolution of Ge
islands in presence of a surface with an extrinsic mor-
phology are still debated [5–7]. It has been shown that SiGe
islands grown on patterned areas have larger volumes than
those on the surrounding planar surfaces [8, 9]. These
observations are corroborated by a recent comparison of
X-ray measurements and finite element calculations, which
suggests a different compositional state with a larger
intermixing and relaxation on the patterned substrates [7].
However, the compositional differences at the single dot
level were not yet considered.
In this letter we address the issue of the impact of
substrate patterning on shape, composition, and strain
relaxation at the single dot level by using atomic force
microscopy (AFM)-based nanotomography (NT-AFM).
Following Ref. [10], we have recently extended the capa-
bilities of NT-AFM to quantitatively determine the full 3D
composition profiles of strained SiGe islands [11]. In this
study, we compare lateral and vertical composition gradi-
ents of individual SiGe islands grown on pit-pattern and
planar Si(001) substrates. Above all, by combining struc-
tural data with the average island compositions as obtained
by NT-AFM, we are able to determine island strain only by
means of an AFM analysis. The experimental ability to
F. Pezzoli (&) Á M. Stoffel Á A. Rastelli Á O. G. Schmidt
Institute for Integrative Nanosciences, IFW Dresden,
Helmholtzstraße 20, 01069 Dresden, Germany
e-mail:
A. Rastelli
e-mail:
Present Address:
M. Stoffel
Institut fu
¨
r Halbleitertechnik, Pfaffenwaldring 47,
70569 Stuttgart, Germany
T. Merdzhanova
Max-Planck-Institut fu
¨
r Festko
¨
rperforschung,
Heisenbergstraße 1, 70569 Stuttgart, Germany
123
Nanoscale Res Lett (2009) 4:1073–1077
DOI 10.1007/s11671-009-9360-4
map the chemical composition at the nanoscale helps
indeed to shed new light on the driving forces governing
alloying. Our findings provide direct experimental evi-
dence that a nanostructured surface plays a major role in
determining strain relaxation and therefore in defining the
compositional profiles of the islands.
Experimental Procedure
The sample considered here consists of 8.5 monolayer of Ge
deposited by molecular beam epitaxy at 700°C on a pat-
terned Si(001) substrate [12]. A 500 9 500 lm
2
mesh of
pits aligned along the h110i directions was realized by
electron beam lithography followed by reactive ion etching.
The distance between nearby pits is 450 nm and their depth
and width about 25 and 85 nm, respectively. The surface
morphology of the sample was analyzed by AFM operating
in tapping mode with a super sharp silicon tip (nominal
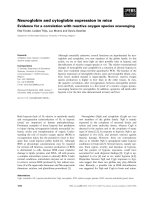
radius of curvature of 2 nm). Fig. 1a shows a 30 9 30 lm
2
AFM image of the surface morphology in proximity of a
corner of the patterned area. The observed material
depletion region is due to a directional diffusion of Ge from
the unpatterned, flat surface toward the patterned area,
which results in a gradient of the Ge amount available for
island formation in the patterned area [9]. Islands close to
the pattern edge are therefore larger than those a few
microns away from it and some of them exceed the critical
size for dislocation introduction [13]. Here we focus on the
two areas marked in Fig. 1a, in order to exclude most of the
large, dislocated islands at the boundaries of the patterned
field. The two island ensembles consist mainly of barn-
shaped islands [14], as corroborated by a facet analysis
(not shown). As reported in Fig. 1b, the mean height of
coherent islands is similar, being (49 ± 6) nm and (54 ± 3)
nm on the flat and patterned surfaces, respectively. How-
ever, for a fixed island volume, V, the aspect ratio, r (defined
as the ratio between height and the square root of the base
area), turns out to be larger for islands grown on the flat
surface, as shown in Fig. 1c. This result suggests some
differences in the compositional and/or strain state. To
study this further, we used a NT-AFM approach [11]. The
sample was dipped in HF and then etched by means of an
ammonium hydroxide–hydrogen peroxide solution (NHH),
Fig. 1 (Color online) a 30 lm
9 30 lm AFM scan of the
sample surface close to a corner
of the patterned area. The gray
scale corresponds to the local
surface slope with respect to the
(001) plane. The analyzed areas
on planar and patterned surface
are marked in blue and red,
respectively. b Height
distribution of islands grown on
pit-pattern (red bars) and flat
surface (blue). c, d Island aspect
ratio versus volume for islands
in the regions marked in a.Ind
the island volumes have been
rescaled according to x
Ge
6
and
(0.87 9 x
Ge
)
6
for (filled square)
and (open circle), respectively
1074 Nanoscale Res Lett (2009) 4:1073–1077
123
with 1:1 vol. (28% NH
4
OH):(31% H
2
O
2
). NHH is known to
be rather insensitive to the strain over the whole composi-
tion range of SiGe alloys and to be isotropic, i.e., having no
preferential etching direction [15]. Spatially resolved 3D
contours of the Ge content, x
Ge
, within the islands were
obtained by measuring the same surface areas at increasing
etching times [11]. The lateral and vertical resolution in the
determination of x
Ge
is given by the 3D matrix voxels,
which have lateral and vertical side lengths of about 15 and
7 nm. The absolute uncertainty on x
Ge
is about 0.02.
Results and Discussion
From the representative horizontal crosscuts of the stoi-
chiometry profiles, shown in Fig. 2, it is observed that the
Ge content within the islands is far from being uniform
[11, 16–18]. Nevertheless, the lateral composition profiles
of islands grown on pits tend to be more symmetric than for
islands grown on the planar surface. The observed differ-
ences can be correlated with the lateral ordering. In the
patterned field, as opposed to the random nucleation sites,
the area from which individual islands collect adatoms
during growth is almost equal, leading both to a regular dot
arrangement and to an improved chemical homogeneity.
The composition maps of islands grown on the flat surface
(the left side of Fig. 2) show a decay of the Ge content
from the apex to the base of the islands [16, 17]. This Ge
accumulation at the island top is generally ascribed to
chemical and elastic energy minimization [14, 19, 20]. The
average Ge content at different height levels, z, above the
substrate was then derived to highlight quantitative dif-
ferences for the two island ensembles (see Fig. 3a). The Ge
concentration both on flat and patterned substrate reveals a
high chemical contrast at the base of the dot, reaching
Fig. 2 (Color online) Sequence of 1 lm 9 1 lm horizontal crosscuts
at heights (top to bottom panels) z = 8, 22, and 39 nm, with respect to
the Si substrate level, for islands on a flat (left) and patterned (right)
surface area. The gray scale represents the local surface slope, while
the Ge molar fraction is color coded
Fig. 3 a Average Ge content, x
Ge
, for islands marked in Fig. 1a,asa
function of z level with respect to the Si substrate (z = 0 nm).
b Average Ge content of the islands as a function of their height. x
Ge
error bars are of about 0.02
Nanoscale Res Lett (2009) 4:1073–1077 1075
123
about x
Ge
= 0.38 within the first 10 nm above the Si sur-
face (see for a comparison Ref. [11] and references
therein). Nevertheless, the data shown in Fig 3a point out
that for z C 10 nm, the mean lateral Ge concentration
increases monotonically for islands forming randomly on a
flat surface, while it tends to a constant x
Ge
= 0.4 for
islands on the patterned substrate. This result provides an
independent confirmation of those outlined in Ref. [7].
We focus now on the correlation between the morpho-
logical properties of the islands, i.e., island size and shape,
and their average composition. The latter was evaluated by
averaging the Ge content over all the matrix voxels of a
given island. From Fig. 1c it is evident that the islands in
the pits have a larger volume than those on flat substrates,
which is in agreement with previous literature report, e.g.,
Ref. [8], whereas Fig. 4a shows that small islands are Si-
richer than large islands. This is a general trend that does
not depend on substrate geometry. It is worth noting that
for a given volume, islands grown on pits have a slightly
lower x
Ge
as compared to islands grown on the flat surface
(Fig. 4a). On the other hand, for a given island shape or
aspect ratio value, x
Ge
pattern
is systematically larger than
x
Ge
planar
, as shown in Fig. 4b. Albeit counter intuitive, the
results outlined above can be rationalized according to the
following simple model concerning island relaxation. As
follows from basic energy considerations, for coherent
islands with fixed shape and homogeneous composition,
the base length scales as the inverse square of the misfit,
f [21, 22]. Therefore, the island volume V can be written as:
V(f) = V
0
f
-6
, where V
0
is a constant which mainly
depends on the shape of the island. For coherent islands,
f is defined by the relative difference in the lattice
parameters, e, as: f = e & 0.04x
Ge
. By using the average
island values of x
Ge
obtained from the NT-AFM analysis,
volumes can be rescaled according to: V* = V(f) x
Ge
6
.
However, even with this rescaling, the two datasets of r vs.
V* do not overlap, which means that the different average
composition is not able to explain why islands with similar
volumes have different shapes, as reported in Fig. 1c. This
discrepancy can be explained by the different relaxation of
the two sets of islands. In fact, it is known that islands can
relax strain energy more effectively in the pits, due to the
surface curvature and valley filling [23, 24]. To estimate
the enhanced strain relief, d, the normalized island volumes
on the patterned area can be written as: V*
pit
= V*d
6
.A
good overlap of the two normalized volumes versus aspect
ratio datasets is obtained, as shown in Fig. 1d, choosing
d * 0.87. It can be therefore concluded that the strain in
site-controlled islands is reduced by about 10% with
respect to islands grown on the planar surface. According
to this result, the strain, which is different for the two sets
of islands, can be identified as the primary factor that
determines the difference in the composition profiles. Pits
indeed act as preferred nucleation locations for Ge ada-
toms, leading for a fixed aspect ratio to Ge-richer islands,
as shown in Fig. 4b.
A possible, additional explanation for the aforemen-
tioned discrepancy is based on the different Ge profiles of
the islands of the two ensembles as shown in Fig. 3a. Since
the scaling law used in the present discussion is derived for
island with a uniform composition, our simple approach
holds more likely for islands grown on the pit-patterned
surface, because of their more homogeneous Ge distribu-
tion (see Fig. 3a). Therefore, the d value provided here has
to be considered as an upper limit for the relaxation
enhancement, since a realistic non-homogeneous Ge dis-
tribution for the coherent islands on the planar surface
could lead to a more effective elastic energy reduction [20].
Nevertheless, some islands in Fig. 1d still do not follow
the volume rescaling. According to their volumes, those
islands are most probably plastically relaxed. In this case,
the system lowers its total free energy by introducing dis-
locations. Therefore, the misfit in V(f) has to be replaced by
the residual misfit f = e - d, where d is the plastic strain
and the sign has been assigned according to the actual
compressive stress.
Remarkably, the overall average Ge content is
0.361 ± 0.005 for islands grown on the pit-pattern and
0.36 ± 0.01 for islands on the flat surface area. As
expected, despite an equal mean x
Ge
, the standard deviation
is a factor of two larger for the latter case, reflecting the
larger composition fluctuations. Finally, the average Ge
content of the individual islands increases monotonically
with the island height (see Fig. 3b). This behavior can be
rationalized as a result of the island evolution towards
steeper and more relaxed morphologies. We can therefore
compare islands with the same Ge content, e.g., about 0.36.
These islands have the same height, i.e., about 55 nm
Fig. 4 Average Ge content of the islands as a function of their
volume (a), and aspect ratio (b)
1076 Nanoscale Res Lett (2009) 4:1073–1077
123
(Fig. 3b), but different aspect ratio (Fig. 4b). As a conse-
quence, the island base and the volume are larger for
islands grown on a pit-patterned surface. This can again be
explained by the different residual strain of the two island
ensembles.
Conclusions
In conclusion, an AFM-based nanotomography approach
was used to gather in-depth information about the alloying
and relaxation mechanism on both flat and pit-patterned
substrates. The 3D compositional profiles reveal that islands
forming on pit-patterned areas have a more uniform Ge
distribution and are slightly Ge-richer than their counter-
parts forming on flat areas. These periodic Ge-rich island
arrays are therefore appealing candidates for efficient local
stress engineering in next generation Si field effect tran-
sistors [3] for ultra large-scale integration technologies.
Acknowledgements The authors acknowledge financial support by
the EU D-DOTFET project (012150) and DFG (FOR 730).
References
1. D.J. Eaglesham, M. Cerullo, Phys. Rev. Lett. 64, 1943 (1990)
2. J. Stangl, V. Holy
´
, G. Bauer, Rev. Mod. Phys. 76, 725 (2004)
3. O.G. Schmidt, K. Eberl, IEEE Trans. El. Dev. 48, 1175 (2001)
4. O.G. Schmidt (ed.), Lateral Alignment of Epitaxial Quantum
Dots (Springer, Berlin, 2007)
5. J.J. Zhang, M. Stoffel, A. Rastelli , O.G. Schmidt, V. Jovanovic
´
,
L.K. Nanver, G. Bauer, Appl. Phys. Lett. 91, 173115 (2007)
6. Z. Zhong , P. Chen, Z. Jiang, G. Bauer, Appl. Phys. Lett. 93,
043106 (2008)
7. T.U. Schu
¨
lli, G. Vastola, M I. Richard, A. Malachias, G. Re-
naud, F. Uhlı
´
k, F. Montalenti, G. Chen, L. Miglio, F. Scha
¨
ffler, G.
Bauer, Phys. Rev. Lett. 102, 025502 (2009)
8. Z. Zhong, G. Bauer, Appl. Phys. Lett. 84, 1922 (2004)
9. G.S. Kar, S. Kiravittaya, M. Stoffel, O.G. Schmidt, Phys. Rev.
Lett. 93, 246103 (2004)
10. R. Magerle, Phys. Rev. Lett. 85, 2749 (2000)
11. A. Rastelli, M. Stoffel, A. Malachias, T. Merdzhanova, G.
Katsaros, K. Kern, T.H. Metzger, O.G. Schmidt, Nano Lett. 8,
1404 (2008)
12. M. Stoffel, A. Rastelli, T. Merdzhanova, G. Kar, O.G. Schmidt,
Microelectron. J. 37, 1528 (2006)
13. A. Marzegalli, V.A. Zinovyev, F. Montalenti, A. Rastelli, M.
Stoffel, T. Merdzhanova, O.G. Schmidt , L. Miglio, Phys. Rev.
Lett. 99, 235505 (2007)
14. M. Stoffel, A. Rastelli, J. Tersoff, T. Merdzhanova, O.G.
Schmidt, Phys. Rev. B 74, 155326 (2006)
15. M. Stoffel, A. Malachias, T. Merdzhanova, F. Cavallo, G. Isella,
D. Chrastina, H. von Ka
¨
nel, A. Rastelli, O.G. Schmidt, Semicond.
Sci. Technol. 23, 085021 (2008)
16. M. Floyd, Y. Zhang, K.P. Driver, J. Drucker, P.A. Crozier, D.J.
Smith, Appl. Phys. Lett. 82, 1473 (2003)
17. A. Malachias, S. Kycia, G. Medeiros-Ribeiro, R. Magalha
˜
es-
Paniago, T.I. Kamins, R.S. Williams, Phys. Rev. Lett. 91, 176101
(2003)
18. T.U. Schu
¨
lli, M. Stoffel, A. Hesse, J. Stangl , R.T. Lechner, E.
Wintersberger, M. Sztucki, T.H. Metzger, O.G. Schmidt, G.
Bauer, Phys. Rev. B 71, 035326 (2005)
19. N.V. Medhekar, V. Hegadekatte, V.B. Shenoy, Phys. Rev. Lett.
100, 106104 (2008)
20. R. Gatti, F. Uhlı
´
k, F. Montalenti, New. J. Phys. 10, 083039
(2008)
21. W. Dorsch, H.P. Strunk, H. Wawra, G. Wagner, J. Groenen, R.
Carles , Appl. Phys. Lett. 72, 179 (1998)
22. J.A. Floro, E. Chason , L.B. Freund, R.D. Twesten, R.Q. Hwang,
G.A. Lucadamo, Phys. Rev. B 59, 1990 (1999)
23. Z. Zhong, W. Schwinger, F. Scha
¨
ffler, G. Bauer, G. Vastola, F.
Montalenti, L. Miglio, Phys. Rev. Lett. 98, 176102 (2007)
24. H. Hu, H.J. Gao, F. Liu, Phys. Rev. Lett. 101, 216102 (2008)
Nanoscale Res Lett (2009) 4:1073–1077 1077
123