Báo cáo hóa học: "Research Article A First Comparative Study of Oesophageal and Voice Prosthesis Speech Production" docx
Bạn đang xem bản rút gọn của tài liệu. Xem và tải ngay bản đầy đủ của tài liệu tại đây (6.44 MB, 6 trang )
Hindawi Publishing Corporation
EURASIP Journal on Advances in Signal Processing
Volume 2009, Article ID 821304, 6 pages
doi:10.1155/2009/821304
Research Article
A First Comparative Study of Oesophageal and Voice Prosthesis
Speech Production
Massimiliana Carello
1
and Mauro Magnano
2
1
Dipartimento di Meccanica, Politecnico di Torino, Corso Duca degli Abruzzi 24, 10129 Torino, Italy
2
Ospedali Riuniti di Pinerolo, A.S.L. TO3, Via Brigata Cagliari 39, 10064 Pinerolo, Torino, Italy
Correspondence should be addressed to Massimiliana Carello,
Received 31 October 2008; Revised 2 March 2009; Accepted 30 April 2009
Recommended by Juan I. Godino-Llorente
The purpose of this work is to evaluate and to compare the acoustic properties of oesophageal voice and voice prosthesis
speech production. A group of 14 Italian laryngectomized patients were considered: 7 with oesophageal voice and 7 with
tracheoesophageal voice (with phonatory valve). For each patient the spectrogram obtained with the phonation of vowel /a/
(frequency intensity, jitter, shimmer, noise to harmonic ratio) and the maximum phonation time were recorded and analyzed.
For the patients with the valve, the tracheostoma pressure, at the time of phonation, was measured in order to obtain important
information about the “in vivo” pressure necessary to open the phonatory valve to enable speech.
Copyright © 2009 M. Carello and M. Magnano. This is an open access article distributed under the Creative Commons
Attribution License, which permits unrestricted use, distribution, and reproduction in any medium, provided the original work is
properly cited.
1. Introduction
Laryngeal cancer is the second most common upper aero-
digestive cancer, in particular, it causes pain, dysphagia, and
impedes speech, breathing, and social interactions.
The management of advanced cancers often includes
radical surgery, such as a total laryngectomy which involves
the removal of the vocal cords and, as a consequence, the
loss of voice. Total laryngectomy represents an operation
that drastically affects respiratory dynamics and phonation
mechanisms, suppressing the normal verbal communication,
it is disabling and has a detrimental effect on the individual’s
quality of life. In fact, for some laryngectomy patients, the
loss of speech is more important than survival itself.
With the laryngectomy, the patient is deprived of the
vibrating sound source (the vocal folds and laryngeal box)
and the energy source for voice production, as the air stream
from the lungs is no longer connected to the vocal tract.
Consequently, since 1980, different methods for regain-
ing phonation have been developed, the most important are
(1) the use of an electro-larynx, (2) conventional speech
therapy, (3) surgical prosthetic methods [1–3].
The use of an electro-larynx allows the restoration of the
voice by an external sound generator; it is exclusively reserved
for patients who have not benefited from conventional
speech therapy or on whom a tracheoesophageal prosthesis
cannot be applied.
The conventional speech therapy allows the acquisition
of autonomously oesophageal voice (EV) and, therefore, it is
the most commonly used treatment in voice rehabilitation
of laryngectomized patients which requires a sequence of
training sessions to develop the ability to insufflate the
oesophagus by inhaling or injecting air through coordinate
muscle activity of the tongue, cheeks, palate, and pharynx.
The last technique of capturing air is by swallowing air into
the stomach. Voluntary air release or “regurgitation” of small
volumes vibrates the cervical esophageal inlet, hypophar-
ingeal mucosa, and other portions of the upper aerodigestive
tract to produce a “burp-like” sound. Articulation of the lips,
teeth, palate, and tongue produces intelligible speech.
The surgical prosthetic methods (TEP), introduced in
1980 by Weinberg et al. [4], spread rapidly due to the
excellent outcomes that they achieved. In this case a phona-
tory valve is positioned in a specifically made shunt in the
tracheoesophageal wall, and closing the tracheostoma, the
air reaches the mouth (through the cervical esophageal inlet,
hypopharingeal mucosa, and the upper aerodigestive tract)
and the vibration is modulated with a new voice production.
2 EURASIP Journal on Advances in Signal Processing
Table 1: Patient data, vocal, and pressure parameters.
Personal data Vocal parameters Tracheostoma pressure
Age Sex
Tr ac he ost om a
area
Fundamental
frecuancy
Jitter
Jitter
perc.
Shimmer
Shimmer
perc.
NHR
Maximum
phonation
time
Tr ac he ost om a
pressure
Acoustic
pressure/
Tr ac he ost om a
pressure
[cm
2
][Hz]
[ms]
[%] [Pa] [%]
[
−]
[s] [Pa] [
−] ∗10
(−7)
EV1
49 M
1.56 75.188
17.67
13.44 0.00073 0.36
0.832
0.90 — —
EV2
77 M
0.87 153.846
42.67
33.41 0.00019 0.56
3.265
0.77 — —
EV3
62 M
1.37 96.154
33.67
18.01 0.00026 0.43
1.063
0.65 — —
EV4
60 M
1.69 56.497
13.33
24.46 0.00026 0.21
1.575
0.68 — —
EV5
74 M
1.94 69.444
28.33
21.76 0.00005 0.19
1.297
1.63 — —
EV6
71 M
0.69 98.039
22.67
22.39 0.00048 0.83
1.032
0.68 — —
EV7
61 M
0.62 56.818
30.33
25.38 0.00006 0.15
1.146
0.57 — —
TEP1
68 M
1.75 112.360
3.33
3.79 0.00012 0.20
0.834
48.45 4906 1.7077
TEP2
61 F
2.37 102.041
6.00
6.13 0.00005 0.23
0.487
12.18 2960 1.0955
TEP3
76 M
0.68 86.957
18.67
17.06 0.00029 0.51
1.906
7.86 3752 2.0051
TEP4
78 M
1.62 109.890
3.33
3.86 0.00012 0.30
2.892
6.47 5077 1.6604
TEP5
61 M
1.44 60.606
4.67
2.86 0.00001 0.17
0.146
22.39 1790 0.3187
TEP6
76 M
2.21 58.590
13.67
10.99 0.00033 0.36
0.216
4.67 2481 3.9962
TEP7
60 M
1.00 107.527
9.00
10.41 0.00021 0.38
2.776
19.11 5127 3.2538
The resulting speech depends on the expiratory capacity
but the voice quality is very good and resembles the “origi-
nal” voice. This kind of voice is called “tracheoesophageal”
voice. Intelligibility of EV can vary according to several
perceptive factors on the precise definition for which there
is no general agreement. Furthermore, aerodynamic data in
the study of EV physiology and, in particular, correlations
between those data and the perceptive findings have not been
defined as yet.
The sound generator of both oesophageal and tra-
cheoesophageal speech is the mucosa of the pharyngo-
esophageal (PE) segment, that differs from patient to patient,
depending on the shape and stiffness of the scar between
the hypopharynx and oesophagus, the localization of the
carcinoma, different surgical needs and procedures, and
the extent of the remaining esophageal mucosa. Several
investigations of the substitute voice attempted to detect
a correlation between voice quality and morphological or
dynamic properties of the PE segment [5] but sometimes the
method is not very comfortable for the patient.
In this paper, a simple and physiological method of
measurement of voice characteristics is presented, useful,
above all, for oesophageal and tracheoesophageal voices that
are characterised by a strong aperiodicity.
Voice quality is a perceptual phenomenon, and con-
sequently, perceptual evaluations are considered the “gold
standard” of voice quality evaluation. In clinical practice,
perceptual evaluation plays a prominent role in therapy
evaluation, while the acoustic analyses are not usually
routinely performed.
Several studies have described acoustic analysis of
oesophageal and tracheoesophageal voice quality and have
concluded that there is a considerable difference between
the laryngeal voice and the acoustic measures, because these
voices have a high aperiodicity [6–8].
For this reason a commercially available Multi Dimen-
sional Voice Program (MDVP), suitable for a subject not
laryngectomized with laryngeal voice, is not useful to analyze
all the tracheoesophageal voices, where the power vocal
signal in terms of frequency and the amplitude outline is
not regular, with distinguishable peak values and clean sound
[6].
2. Patients
The subjects included 14 Italian laryngectomized patients
(13 men and 1 woman) with ages ranging from 49 to 78
years, with a mean of 66.7 years. Seven of them speak with
oesophageal voice (EV) while seven patients have a Provox
voice prostheses (TEP).
For each patient a picture of the stoma has been taken
to obtain its size (or area). The stoma size ranged from
0.62 cm
2
to 2.21 cm
2
, with a mean of 1.41 cm
2
.
In Tab le 1 are shown the personal data of the patients:
age, sex, and size of the stoma.
3. Methods
3.1. Voice and Tracheostoma Pressure Measurement. The
phonetic specialists have a standard method to evaluate the
voice characteristics, the first is a perceptive evaluation but
the most important is the objective evaluation to measure
the acoustic characteristics of the voice using a computerized
analysis [9–11].
EURASIP Journal on Advances in Signal Processing 3
The oesophageal and the tracheoesophageal voice are
characterized by aperiodic characteristics and important
noise components, so it is very difficult to individuate the
peak values. For this reason the use of a multiparameter
programme MDVP for these kinds of voices does not provide
reliable results, while the programme is very reliable for
laryngeal voices; this is pointed out by different research
groups [6, 8, 11, 12]. In this paper a new different system has
been proposed and used, taking into account the knowledge
of the engineering signal analysis.
For the research shown in this paper a specific experi-
mental setup has been made by a microphone (Bruel and
Kjier, 4133 type, with stabilized supplier 2804 type and
preamplifier type 2669) and a digital oscilloscope with a
specific setup (Tektronik type) that allows recording of a data
sequence.
The measurement and recording of speech signals have
been taken with the patient standing up and a microphone
positioned 20 cm from the mouth at an angle of 45
◦
. In this
condition, the patient pronounced the vowel /a/ with a tone
and sound level considered by himself to correspond to a
usual conversation.
Thespeechsignalwasrecordedfor1secondtohave
it constant. In this way, it is possible to consider a steady
signal, with average value and variance constants, and with
the power spectral analysis it is possible to use the Fourier
transform and the Wiener Kintchine theorems. The use of a
sampling frequency of 10 kHz allows to evaluate the signal up
to a frequency of 5 kHz, according to Nyquist theorem.
The maximum phonation time was measured in the same
conditions but with the patient that pronounces the vowel /a/
as long as possible.
Every test on each individual patient was carried out
three times to verify the repeatability of the measurements,
Ta bl e 1 reports the mean values.
For the patient with tracheoesophageal voice the speech
signal and the pressure at the tracheostoma were recorded
simultaneously.
The pressure was measured with a specifically made
device. A Provox adhesive plaster (usually used for the
stoma filter) positioned on the tracheostoma allows to fix
a small teflon cylinder of suitable diameter. A soft rubber
part is connected to the other extremity of the cylinder;
the patient, using two fingers, closes the rubber part on the
tracheostoma.
A pressure transducer (RS Component 235-5790), posi-
tioned in a pressure measurement point in radial position
on the cylinder, allows a dynamic measurement of the
tracheostoma pressure to be taken by means of a digital
oscilloscope.
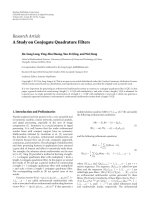
The pressure measurement device is shown in Figures
1(a) and 1(b). In particular, in the case of Figure 1(a) the
patient can breath freely; in the case of Figure 1(b) the device
can be closed by the patient to allow voice production,
in these conditions the pressure and the voice signal are
recorded simultaneously using a digital oscilloscope.
The pressure and voice signals have been treated with
a program (developed in MATLAB) specifically written to
(a) (b)
Figure 1: Device for tracheostoma pressure measurement.
700600500400300200100
Time (ms)
−3
−2
−1
0
1
2
3
×10
−3
Amplitude (W)
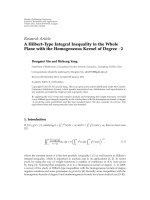
Figure 2: Vocal signal amplitude versus time (EV1).
carry out spectral power analysis and based on a decision-
making tool, to obtain the following:
(i) vocal signal analysis: power spectral density (by
Welch period analysis), time-frequency spectrogram
(or sonogram); fundamental frequency (cepstrum
method); jitter and jitter percentage; shimmer and
shimmer percentage, Noise to Harmonic Ratio
(NHR);
(ii) tracheostoma pressure signal analysis: power spectral
analysis, pressure average value;
(iii) cross-spectral analysis of vocal and pressure signal to
point out the same harmonic components;
(iv) acoustic pressure to tracheostoma pressure ratio
(ratio of the maximum values).
The tracheostoma pressure allows important information
about the “in vivo” pressure necessary to open the phonatory
valve to speech, while the ratio of the acoustic pressure to
the tracheostoma pressure gives the pulmonary effort level
necessary for the patient to produce the voice. In fact it
is possible to note that at equal acoustic pressure, a low
pulmonary effort is necessary for a subject that has a low
tracheostoma pressure.
4 EURASIP Journal on Advances in Signal Processing
45040035030025020015010050
Time (ms)
−8
−6
−4
−2
0
2
4
6
8
×10
−4
Amplitude (W)
Figure 3: Vocal signal amplitude versus time (TEP3).
5000450040003500300025002000150010005000
Frequency (Hz)
0.2
0.4
0.6
0.8
1
1.2
1.4
1.6
1.8
2
×10
−5
Amplitude (W)
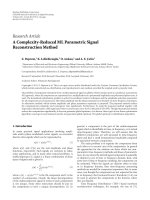
Figure 4: Vocal signal amplitude versus frequency (EV1).
Sometimes EV and TEP voice samples could not be
analysed at all, or only very short parts were analyzable.
Visual inspection of these voice samples showed that the
patients had very low-pitched voices (for this reason the use
of MDVP system is not suitable) or even that there is no
fundamental frequency present at all.
The obtained vocal and tracheostoma pressure parame-
ters are shown in Ta bl e 1.
4. Results and Discussion
Taking into account the data shown in Ta bl e 1 average
value and standard deviation (
±σ) was calculated for the
two groups of voices (EV and TEP). The results are
shown in Tab le 2 ; it is possible to note that the tracheo-
esophageal voices TEP have a lower standard deviation for
the vocal parameters (frequency, jitter, shimmer), in fact the
TEP voices are more repeatable and have better acoustic
5000450040003500300025002000150010005000
Frequency (Hz)
1
2
3
4
5
6
×10
−7
Amplitude (W)
Figure 5: Vocal signal amplitude versus frequency (TEP3).
0.60.50.40.30.20.10
Time (ms)
5000
4500
4000
3500
3000
2500
2000
1500
1000
500
0
Frequency (Hz)
0.1
0.2
0.3
0.4
0.5
0.6
0.7
0.8
0.9
Figure 6: Vocal signal frequency versus time (EV1).
characteristics. The oesophageal voice EV has lower standard
deviation regarding the maximum phonation time but it is
necessary to note that generally the patients with a TEP voice
have longer phonation time and this allows a better way to
communicate and quality of the life.
Each patient’s voice signal (oesophageal EV and tra-
cheoesophageal TEP) has been recorded and treated with the
developed MATLAB program. As an example, the results of
concerning two patients, namely, EV1 and TEP3, are shown
from Figure 2 to Figure 7.
The recorded signal in term of amplitude versus time is
shown in Figures 2 (EV1) and 3 (TEP3).
The spectral power analysis allows to obtain the ampli-
tude as a function of the time or the frequency as a function
of the time.
Figures 4 (EV1) and 5 (TEP3) show the amplitude
versus frequency spectra. It is possible to note that the
esophageal voice EV has one fundamental frequency and
a noise component at high frequency level, while the
tracheoesophageal voice TEP has a frequency peak value and
two noise components.
EURASIP Journal on Advances in Signal Processing 5
Table 2: Average and standard deviation for patient data, vocal, and pressure parameters.
Personal data Vocal parameters Tracheostoma pressure
Age Sex
Tr ac he ost om a
area
Fundamental
frecuancy
Jitter
Jitter
perc.
Shimmer
Shimmer
perc.
NHR
Maximum
phonation
time
Tr ac he ost om a
pressure
Acoustic
pressure/
Tr ac he ost om a
pressure
[cm
2
][Hz]
[ms]
[%] [Pa] [%]
[
−]
[s] [Pa] [
−] ∗10
(−7)
EV
average
64.86 —
1.25 86.569
26.95
22.69 0.00029 0.39
1.459
0.84 ——
EV
standard
deviation
9.72 —
0.52 34.063
9.96
6.24 0.00024 0.24
0.830
0.36 ——
TEP
average
68.57 —
1.58 91.139
8.38
7.87 0.00016 0.31
1.322
17.30 3728 2.0053
TEP
standard
deviation
8.04 —
0.61 23.089
5.84
5.19 0.00012 0.12
1.188
15.23 1358 1.2518
0.40.350.30.250.20.150.10.050
Time (ms)
5000
4500
4000
3500
3000
2500
2000
1500
1000
500
0
Frequency (Hz)
0.1
0.2
0.3
0.4
0.5
0.6
0.7
0.8
0.9
Figure 7: Vocal signal frequency versus time (TEP3).
The frequency spectrum in term of frequency versus time
behaviour is shown in Figures 6 (EV1) and 7 (TEP3).
Similar behaviour was observed for the other patients.
Finally, an overall analysis of the data obtained from the 14
patients was made, pointing out a noise component between
600 Hz and 800 Hz in all cases, with a harmonic component
between 1200 Hz and 1600 Hz. This phenomenon could be
correlated to pseudo-glottis (or larynx-oesophageal tract)
physiological characteristics.
For all the TEP patients the tracheostoma pressure versus
timewasrecordedandthepowerspectralanalysishasbeen
carried out. The results for TEP3 are shown in Figure 8 in
term of pressure versus time and in Figure 9 in term of
amplitude versus frequency.
To investigate the correlation between the pressure and
the voice signals (with TEP subject) the cross-spectrum
based on the Fourier transform was evaluated. The most
important and interesting result pointed out by this analysis
is that the two signals have equal fundamental frequency
and the same harmonic components for each TEP subject
considered. Figure 10 shows the results obtained with the
TEP3.
10009008007006005004003002001000
Time (ms)
1400
1500
1600
1700
1800
1900
2000
2100
2200
2300
Pressure (Pa)
Figure 8: Pressure signal versus time (TEP3).
5000450040003500300025002000150010005000
Frequency (Hz)
1
2
3
4
5
6
×10
5
Amplitude (W)
Figure 9: Pressure signal amplitude versus frequency (TEP3).
6 EURASIP Journal on Advances in Signal Processing
5000450040003500300025002000150010005000
Frequency (Hz)
2
4
6
8
10
12
×10
−4
Amplitude (W)
Figure 10: Pressure and voice signal amplitudes (cross spectrum)
versus frequency (TEP3).
Future steps of this research could be (i) increasing the
number of patients to improve statistically the reliability of
the analysis; (ii) comparing the tracheostoma pressure before
and after the TEP procedure to improve the correlation
between voice frequency and tracheostoma pressure after the
TEP procedure.
References
[1] H. F. Mahieu, Voice and speech rehabilitation following laryn-
gectomy, Doctoral dissertation, Rijksuniversiteit Groningen,
Groningen, The Netherlands, 1988.
[2] E. D. Blom, M. I. Singer, and R. C. Hamaker, Tracheoesophageal
Voice Restoration Following Total Laryngectomy, Singular Pub-
lishing, San Diego, Calif, USA, 1998.
[3] G. Belforte, M. Carello, G. Bongioannini, and M. Magnano,
“Laryngeal prosthetic devices,” in Encyclopedia of Medical
De vices and Instrumentation, J. G. Webster, Ed., vol. 4, pp. 229–
234, John Wiley & Sons, New York, NY, USA, 2nd edition,
2006.
[4] B. Weinberg, Y. Horii, E. Blom, and M. Singer, “Airway
resistance during esophageal phonation,” JournalofSpeechand
Hearing Disorders, vol. 47, no. 2, pp. 194–199, 1982.
[5] M. Schuster, F. Rosanowski, R. Schwarz, U. Eysholdt, and J.
Lohscheller, “Quantitative detection of substitute voice gener-
ator during phonation in patients undergoing laryngectomy,”
Archives of Otolaryngology, vol. 131, no. 11, pp. 945–952, 2005.
[6] C.J.vanAs-Brooks,F.J.Koopmans-vanBeinum,L.C.W.Pols,
and F. J. M. Hilgers, “Acoustic signal typing for evaluation of
voice quality in tracheoesophageal speech,” Journal of Voice,
vol. 20, no. 3, pp. 355–368, 2006.
[7] C. J. van As-Brooks, F. J. M. Hilgers, F. J. Koopmans-van
Beinum, and L. C. W. Pols, “Anatomical and functional
correlates of voice quality in tracheoesophageal speech,”
Journal of Voice, vol. 19, no. 3, pp. 360–372, 2005.
[8] C. J. van As-Brooks, F. J. M. Hilgers, I. M. Verdonck-de Leeuw,
and F. J. Koopmans-van Beinum, “Acoustical analysis and
perceptual evaluation of tracheoesophageal prosthetic voice,”
Journal of Voice, vol. 12, no. 2, pp. 239–248, 1998.
[9] W. De Colle, Voc e & Co mpute r, Omega Edizioni, Italy, 2001.
[10] A. Schindler, A. Canale, A. L. Cavalot, et al., “Intensity and
fundamental frequency control in tracheoesophageal voice,”
Acta Otorhinolaryngologica Italica, vol. 25, no. 4, pp. 240–244,
2005.
[11] C. F. Gervasio, A. L. Cavalot, G. Nazionale, et al., “Evaluation
of various phonatory parameters in laryngectomized patients:
comparison of esophageal and tracheo-esophageal prosthesis
phonation,” Acta Otorhinolaryngologica Italica, vol. 18, no. 2,
pp. 101–106, 1998.
[12] S. Motta, I. Galli, and L. Di Rienzo, “Aerodynamic findings in
esophageal voice,” Archives of Otolaryngology, vol. 127, no. 6,
pp. 700–704, 2001.