báo cáo hóa học:" Research Article Mixed-Signal Architectures for High-Efficiency and Low-Distortion Digital Audio Processing and Power Amplification" doc
Bạn đang xem bản rút gọn của tài liệu. Xem và tải ngay bản đầy đủ của tài liệu tại đây (798.85 KB, 11 trang )
Hindawi Publishing Corporation
EURASIP Journal on Embedded Systems
Volume 2010, Article ID 394070, 11 pages
doi:10.1155/2010/394070
Research Article
Mixed-Signal Architectures for High-Efficiency
and Low-Distortion Digital Audio Processing and
Power Amplification
Sergio Saponara and Pierangelo Terreni
Department of Information Engineering, University of Pisa, via Caruso 16, 56122, Pisa, Italy
Correspondence should be addressed to Sergio Saponara,
Received 9 June 2009; Accepted 4 August 2009
Academic Editor: Paolo D’Abramo
Copyright © 2010 S. Saponara and P. Terreni. This is an open access article distributed under the Creative Commons Attribution
License, which permits unrestricted use, distribution, and reproduction in any medium, provided the original work is properly
cited.
The paper addresses the algorithmic and architectural design of digital input power audio amplifiers. A modelling platform, based
on a meet-in-the-middle approach between top-down and bottom-up design strategies, allows a fast but still accurate exploration
of the mixed-signal design space. Different amplifier architectures are configured and compared to find optimal trade-offsamong
different cost-functions: low distortion, high efficiency, low circuit complexity and low sensitivity to parameter changes. A novel
amplifier architecture is derived; its prototype implements digital processing IP macrocells (oversampler, interpolating filter, PWM
cross-point deriver, noise shaper, multilevel PWM modulator, dead time compensator) on a single low-complexity FPGA while
off-chip components are used only for the power output stage (LC filter and power MOS bridge); no heatsink is required. The
resulting digital input amplifier features a power efficiency higher than 90% and a total harmonic distortion down to 0.13% at
power levels of tens of Watts. Discussions towards the full-silicon integration of the mixed-signal amplifier in embedded devices,
using BCD technology and targeting power levels of few Watts, are also reported.
1. Introduction
Small size, low-cost and high-efficiency audio amplifiers,
integrated as much as possible with digital audio sig-
nal processing tasks in the same embedded device, are
required in several consumer applications: home and car
entertainment, computer/portable multimedia players and,
for low power levels, hearing aids devices. Conventional
linear amplifiers feature low-distortion performance but
have several disadvantages versus market needs [1, 2]: they
are too heavy and energy inefficient and the achievable power
density is limited by the physical size and cost of cooling
hardware and power devices. An extra Digital-to-Analog
Converter (DAC) is needed, before the analog amplifier, for
digital sources: CD, Super Audio CD and DVD supports,
MP3 files, and Digital Audio Broadcasting.
To achieve similar low-distortion performance of linear
amplifiers but with a higher power efficiency, and hence
smaller size and cost, the recent research has been focused
on switching amplifiers. Several class D PWM (Pulse Width
Modulation) topologies or hybrid class A–D or B–D ones
have been proposed in literature [3–6]. However such
topologies are still analog input amplifiers. An alternative
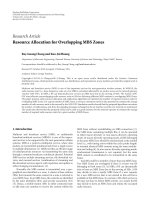
solution is the direct amplification of the digital source based
on the switching architecture at the bottom of Figure 1:in
the digital domain the input PCM (Pulse Code Modulation)
signal is directly converted in a PWM one; the latter is
amplified by an inverter power bridge, switching at hundreds
of kHz, and provided to the speaker after lowpass LC
filtering.
1.1. The State of the Art of Digital Power Audio Amplifiers.
A direct conversion of the input PCM stream to PWM
is not useful: PWM is a nonlinear technique and the
intermodulation between the PWM carrier frequency and
the baseband audio signal leads to poor-quality amplifiers
[7]. To this aim, in academia and industry [8–24], several
techniques have been proposed to improve the basic scheme
2 EURASIP Journal on Embedded Systems
Digital
PCM
DAC
Comp
Class D
Amp
LC
filter
Digital
PCM
PCM to
PWM
Class D
AMP
LC filter
Figure 1: DAC plus class D amplifier versus digital power audio
amplifier.
in Figure 1: new digital audio processing algorithms [12–
15, 17–20, 22–24] or novel feedback schemes [9–11, 21]or
multilevel PWM power bridges [16] have been published to
correct the distortions introduced by the PWM modulation
or by the nonideal behaviour of the power stage. However the
new proposed techniques require extra hardware resources;
the performance gain is paid in terms of increased circuital
complexity and cost. The overall amplifier often requires
multiple chips for the digital part (including digital signal
processor and/or ASIC and/or FPGA), plus ADC and high-
order analog filters for the feedback plus multiple power
transistors and gate drivers for multi level PWM. As a result
high-performance systems require high circuit complexity,
implemented using multiple chips and often multiple-
boards, and are not suitable for consumer applications or
embedded devices. Solutions with lower complexity are
usually obtained at the expense of audio quality reduction.
1.2. Aim and Outline of This Work. This work explores the
design space of digital audio amplifiers to find an optimal
mixing of different analog and digital techniques. The
resulting architecture aims at achieving optimal performance
in terms of low-distortion and high power efficiency while
still allowing a low-cost implementation: all the digital
processing part integrated in a single device, for example,
a low-complexity FPGA, plus off-chip components only for
the power stage, made up of a MOS H-bridge and an LC filter
but without any heat sink.
Most state-of-the-art techniques propose specific opti-
mizations for just a part of the scheme in Figure 1; when
integrating together different known techniques the relevant
hardware overheads add up while the extra gain in perfor-
mance can be negligible. However, the exhaustive design
space exploration of digital power audio amplifiers is not
straightforward since it needs fast but still accurate mod-
els involving the codesign of heterogeneous components:
computation intensive processing algorithms at functional
levelwithhardwarecomponentsatphysicallevel;lowpower
digital and mixed-signal circuits with analog power devices;
silicon integrated circuits with discrete devices. Hereafter
Section 2 presents a platform-based modelling flow and the
cost metrics used to drive the design space analysis. The
models used to find optimal trade-offs between complexity,
power efficiency, distortion and sensitivity are presented
in Section 3 together with architectural comparison results.
Section 4 shows the prototyping of the selected architecture
targeting power levels of tens of Watts. Section 5 compares
the obtained results versus the state of the art and discusses
the extension of the work to fully integrated amplifiers
for power levels of few Watts. Conclusions are drawn in
Section 6.
2. Platform-Based Design Flow and Metrics
2.1. Design Metrics Definition. The definition of the multiple
cost metrics to be optimized is essential to drive the
design space exploration and the correct comparison of
different architectures. The design metrics are the audio
signal distortion, the power efficiency, the circuit complexity
and the architecture sensitivity to parameter changes. The
input signals are PCM samples with a bit size n from 16 to
24 and a sample frequency F
IN
between 44 kS/s and 96 kS/s
(the lower values for frequency and bit-size are typical of
audio CD while the higher values are used in audio DVD).
The target output power, Pout, amounts to tens of Watts
with power efficiency levels up to 90%. Reported data in
this paper refer to the example case of max Pout of 70 Wrms
(or 35 Wrms) delivered to a 4 Ω (or 8 Ω) speaker. The total
harmonic distortion (THD) considered for High-Fidelity
(Hi-Fi) is a level lower than 0.2%, the optimal target is
0.1%. As discussed in [1] there are high-end products for
professional applications, using linear amplifiers, with THD
figures below 0.001%; however the subjective sensitivity of
the hearing human system to THD levels below 0.3% is
often negligible. Most Hi-Fi amplifiers, for example, Sony
STR-DE445 [13],forconsumerhomeorcarmarketshave
a THD of 0.2%. The considered frequency response in this
paper is 20 Hz–20 kHz, although THD optimizations focus
on the range 500 Hz to 2 kHz where the hearing human
system is mainly sensible and very often music signals are
below 16-17 kHz [1]. The target circuit complexity for the
digital processing circuitry amounts to tens of equivalent
ASIC gates, a value that can be fitted in a single low-cost
FPGA leaving space to integrate other audio processing tasks
thus realizing a complete audio acquisition/playing system in
a single embedded device.
2.2. Platform-Based Design Flow. To allow a fast but still
accurate design space exploration we followed a meet-in-
the-middle approach between bottom-up and top-down
strategies [25]. A configurable modelling platform has been
built starting from libraries of analog and digital building
block components. A library of accurate spice models has
been derived bottom-up for the hardware components
whose nonideal characteristics and nonlinearity affect the
behaviour of the power audio amplifier: power MOS, power
supply, analog filters, OpAmp and comparators optionally
used in the feedback loop. As example, we have created
Spice models for the power MOS in [26], used also in the
prototyping phase; such models consider all key electrical
EURASIP Journal on Embedded Systems 3
nbit
F
IN
Digital
Over
sampling
Cross point
deriver
Noise
shaper
Multi
Level
PWM
Dead
time
inseration
PWM
correction
Gate
driver
and
power
bridge
LC
filter
Digital audio signal processing
nbit
MF
IN
nbit
MF
IN
Pbit
MF
IN
PWM wave
Amplifed
PWM wave
Feedback
Figure 2: Modelling platform for digital input power audio amplifier.
Table 1: Interpolating filter mask specifications.
Mas type Pass-band Stop-band Pass-band ripple Stop-band attenuation
10.45F
IN
0.55 F
IN
<0.1 dB >50 dB
20.4F
IN
0.6 F
IN
<0.02 dB >60 dB
parameters [27] and their dependence on input driving sig-
nal (V
GS
) and output delivered power: MOS transfer curves,
drain source breakdown voltage BV
DS
, R
DS
on resistance,
gate charge Q
G
, body diode reverse recovery charge Q
rr
,
internal gate resistance R
G
, MOS rise and fall times T
r
and T
f
and switching frequency F
sw
, transistor packaging
and thermal characteristics. The Spice models have been
integrated with parametric and fixed-point Simulink models
for the signal processing algorithms proposed to enhance
the basic scheme in Figure 1, see details in Section 3.The
resulting Spice/Simulink environment is then used top-
down to build multiple architectures (proper configuring
and combining the building block models) and to allow their
fast but still accurate comparison. The considered design
metrics are those in Section 2.1. This analysis allows a first
selection of the most promising architectures; for them the
comparison is further refined in a second step using HDL
models for the digital audio algorithms.
Synthesized on different technologies (standard-cells
CMOS libraries or SRAM-based FPGAs) the HDL models
permit the evaluation of the gate complexity and power con-
sumption of the digital circuitry. The selected architectures
are finally prototyped, and the real performances measured,
using FPGA technology plus a discrete power output stage.
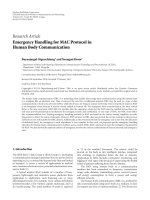
3. Mixed-Signal Architectural Exploration
This section presents the modelling platform which includes
the following building blocks, see Figure 2:anoversampler,
a cross point estimator for natural PWM, a sigma-delta
noise shaper, a multilevel PWM generator, a dead time
insertion unit, a power bridge, an LC filtering stage, a
feedback loop with PWM signal compensation. To each
building block parametric functional and cost models have
been associated. For some blocks multiple algorithms are
implemented. By combining the different building blocks
and configuring their parameters, different possible archi-
tectures have been obtained, simulated and compared. The
following subsections detail the architectures and function-
alities implemented in each block of Figure 2, the relevant
parameters, and the results obtained from the comparison
of different configurations. The most suited choices for
block combination and parameter configuration are also
highlighted.
3.1. Oversampler. To reduce the output THD an oversampler
is added before the PCM to PWM conversion in the digital
domain, see Figure 2. Oversampling by a parametric factor M
is realized first inserting M-1 zeros after each original sample
(zero padding); the data stream is then processed with an
interpolating filter to remove high frequency spurious rep-
etitions of the baseband signal. The higher the oversampling
factor M is, the higher (
↑ M) the PWM carrier frequency is
and hence the transition bandwidth for the LC output filter
used to remove intermodulation distortion. Thus, a high
over-sampling factor M simplifies the design of the LC analog
filter at the expense of an increased complexity for the digital
interpolating filter.
During simulations to find the most suited sizing for the
factor M and for the oversampling filter structure, the masks
in Ta bl e 1 have been used to specify the filter magnitude
response. Mask 1 is known in literature [28, 29] while mask 2
is a new proposal of this work. Compared to mask 1, mask 2
features more stringent requirements in terms of pass-band
ripple and stop-band attenuation (needed to meet a target
THD < 0.2%) but allows for a larger transition band; indeed
music signals rarely exceed the 17 kHz imposed by a pass-
band of 0.4 F
IN
and hence the pass-band 0.45 F
IN
in mask 1
is often excessive.
Once specified the magnitude response of the filter it is
important to define its architectural implementation (FIR or
IIR, windowing type, direct or cascade multistage structure,
parallel or iterative implementation of the multiply and
accumulate-MAC- unit, data bit width), since its hardware
cost can represent the main bottleneck of the whole audio
system [28–32].
For the audio interpolating filter an FIR approach has to
be preferred to an IIR for its linear phase response. However
to implement the masks in Ta bl e 1 with an oversampling
factor M
= 8 a direct implementation of an FIR type
needs a number of taps, that is, a filter order Z,ofsome
hundreds as reported in Ta bl e 2. Equiripple and Kaiser FIR
4 EURASIP Journal on Embedded Systems
Table 2: FIR and IIR order for the interpolating filter, oversam-
pling x8.
FIR IIR
Equiripple Kaiser Butt. Cheb. Elliptic
Mask 1 193 233 38 13 7
Mask 2 129 146 24 11 7
types are considered in Tab le 2 ; analysis carried out using
Gaussian, Hamming and Hanning FIR windows lead to
similar results of the Kaiser FIR type. Such high filter orders
entail a high computational complexity which amounts to
roughly Z
·M MAC operations per sample. On the contrary
using an IIR structure the same magnitude response can
be obtained with a much lower filter order: see Ta bl e 2
which considers Butterworth, Chebychev and elliptic IIR
filters.
The filter computational burden further increases when
considering oversampling factors M much higher than 8.
As example Ta bl e 3 reports the PWM carrier frequency
F
C
= M · F
IN
, the filter order and the MAC operations
needed for Equiripple and Kaiser FIR filters when varying
the oversampling factor from 8 to 128 with CD-quality F
IN
=
44.1kS/s.
From Tab le 3 it is clear that (i) the computational cost
of a direct FIR implementation amounts to tens of millions
MAC/s for M
= 8 and becomes prohibitive, in the range
of tens of Giga MAC/s, when M grows up to 128; (ii)
considering off-chip power output bridges (see Section 3.6)
with typical PWM frequencies within 1 MHz, oversampling
factors M higher than 8 or 16 should be avoided.
To reduce the computational cost of FIR filters while
keeping the advantages of their better phase response versus
IIR structures, the following solutions can be adopted
[29].
(1) Polyphase filter implementation: in the oversampling
unit M-1 samples out of M are zeros (due to zero padding)
and hence a polyphase structure reduces the required MAC
operations for the interpolating filter by a factor M.
(2) Multistage cascade realization: the oversampling unit
can be realized through a cascade of S multiple stages where
the ith stage realizes an oversampling by a factor Mi (with
M1
···Mi···MS = M)withafilterofreducedorderZ
i
Z.
Ta bl e 4 shows the overall MAC computational cost,
considering polyphase filter implementations, of different
possible partitioning of the whole oversampling unit in
multiple cascaded stages. The analysis in Table 4 considers
an oversampling factor M
= 8or16andF
IN
= 44.1kS/s.In
case of DVD-audio with F
IN
= 96 kS/s, MAC computations
and PWM frequency in Tables 3 and 4 are doubled.
Comparing the results of Tables 3 and 4 it is clear that,
exploiting the multistage decomposition and the poly-phase
techniques, the filter complexity is reduced to few millions of
MAC/s.
The computational burden in Tab le 4 is roughly the same
for the two mask types; in the rest of the work mask 2 is
x[n]
n
+
+
Σ
Quantizer
+
−
Σ
H
(z)
erq[n]
y[n]
= x[n]+ ens[n]
p
Figure 3: Noise shaping circuit (n bits input, p bits output).
used since it ensures a lower pass-band ripple. Using the
Equiripple filter type a computational saving of roughly 30%
is achieved versus the Kaiser type.
By adopting an oversampling factor M
= 16, 4-stage
polyphase FIR filter of Equiripple type with filter mask 2, the
required complexity can be sustained for both CD-quality
and DVD-quality inputs realizing in hardware a single MAC
unit with 1 MAC/cycle capability and with a clock frequency
below 10 MHz. The use of higher oversampling factors is
still limited by the switching frequency of the power output
bridge (see Section 3.6).
Finally, the bit-true arithmetic of the MAC hardware unit
has been determined: using a 12-bit fixed-point data width
the circuit complexity is greatly reduced versus a floating—
point arithmetic implementation while the reduction of
audio reproduction quality is negligible.
3.2. Noise Shaper. Converting the n-bit oversampled PCM
signal to PWM leads to a minimum impulse time T
min
=
1/(F
C
· 2
n
) s, for example, roughly 0.25 nanoseconds con-
sidering M
= 16 and the 44.1 kS/s 16-bit PCM signal
of audio CDs. Such values are too low for commercial
power transistors [26, 27] with rise and fall times, T
r
and
T
f
, of tens of nanoseconds. To reduce such requirement
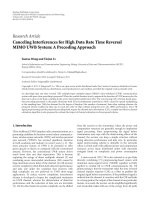
while keeping unaltered source audio quality, a noise shaper
is used. Its architecture is shown in Figure 3:itreduces
the used bits from n to p, while the added quantization
noise can be spread outside the audio band using a Kth
order FIR shaping filter. In our model the noise shaper
is parametric in terms of output bit width p and filter
order K.AnhighvalueforK leads to improved SNR
performances but also to an increased circuit complexity and
to the risk of loop instability. Our analysis proves that stable
loops and good trade-offs between audio performance and
circuit complexity can be achieved using p between 4 and
8 bits and noise shapers with an FIR filter up to 5th order.
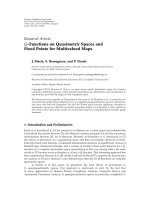
Figure 4 reports the magnitude response of the selected
noise shaping filter for the prototyping phase described in
Section 4. The noise shaper transfer function NTF is NTF
=
ens(z)/erq(z) = H(z) − 1, being H(z) = 1 − (1 −1/z)
5
the
shaping filter response.
The most suited values for M and p depend on the time
response of the used power MOS; the minimum impulse
time T
min
= 1/(M · F
IN
· 2
p
) should be comparable to
the sum of T
r
and T
f
. As example for CD-audio signals,
using M
= 16, p = 7leadstoaT
min
of 11 nanoseconds
compatible with the timing of the selected power MOS
devices [26].
EURASIP Journal on Embedded Systems 5
Table 3: Interpolating filter complexity and PWM frequency versus M.
M Mas type Equiripple Kaiser F
C
order 10
6
·MAC/sorder10
6
·MAC/skHz
8 1 193 68.1 233 82.2
352.8
8 2 129 45.5 146 51.5
16 1 386 272.4 469 330.9
705.6
16 2 257 181.3 291 205.3
32 1 772 1089 938 1324
1411.2
32 2 515 726,8 581 819,9
64 1 1544 4358 1875 5292
2822.4
64 2 1029 2904 1161 3277
128 1 3087 17425 3749 21162
5644.8
128 2 2057 11611 2321 13102
Table 4: Interpolating filter complexity, polyphase, and multistage units.
Mask type Filter type Polyphase cost 10
6
·MAC/s Filter order, ith stage
i = 1 i = 2 i = 3 i = 4
M = 8, S = 3stagesx2 −x2 −x2
1 Equiripple 3.26 48 7 3 —
2 Equiripple 3.26 32 11 5 —
1Kaiser 5.07 59128—
2Kaiser 4.72 371510—
M = 16, S = 4stagesx2 −x2 −x2 −x2
1 Equiripple 4.32 48 7 3 3
2 Equiripple 4.32 32 11 5 3
1Kaiser 7.54 591287
2Kaiser 7.89 3715109
M = 16, S = 3stagesx2 −x2 −x4
1 Equiripple 4.67 48 7 11 —
2 Equiripple 5.20 32 11 16 —
1Kaiser 6.48 591216—
2Kaiser 6.48 371520—
3.3. Cross Point Estimator for NPWM. The scheme with
oversampling plus noise shaping implements the Uniform
sampled PWM (UPWM). To further reduce the THD a
Natural PWM (NPWM) modulation can be realized. For
NPWM, see Figures 2 and 5, a cross-point deriver is added
after the oversampling unit to estimate the intersection point
between the sawtooth carrier and the original modulating
signal as in analog PWM. In our mixed-signal model we
have implemented four cross point estimators with different
performance-complexity trade-offs. Two high-performance
algorithms to estimate the NPWM cross point have been
derived from [22], based on the iterative application of a
Newton-Rapson method, and from [13], based on a 4-point
Lagrange interpolator. Our simulations prove that these cross
point estimators can reduce the THD down to 0.02% but
at the expense of high computational cost. Hundreds of
millions of MAC operations per second are required for CD
inputs and hence an extra DSP processor has to be dedicated
to the cross-point estimation task.
Simplified 2-point estimators for NPWM, using linear
interpolation (LI) or delta compensation (ΔC), allow a single
chip implementation of the whole signal processing part.
Here the crossing-point is estimated using the first-order for-
mulas reported in Figure 5 requiring just 1 multiply/sample
for ΔC and 1 division/sample for LI. Differently from [14,
15],whereLIispreferredtoΔCincaseofmicropower
speech amplifiers not using oversampling, our simulations
prove that the THD reduction using NPWM-LI or -ΔCis
the same: a factor of 2 lower than UPWM. Thus, the use
of ΔCispreferredsinceitislesscomplexthanLIrequiring
the computation of a multiplication/sample instead of a
division/sample.
6 EURASIP Journal on Embedded Systems
−5
0
5
10
15
20
25
30
Magnitude (dB)
00.02 0.04 0.06 0.08 0.10.12 0.14 0.16 0.18
Frequency (MHz)
5th order shaping FIR filter
Figure 4: Noise shaping filter frequency response.
3.4. Multilevel PWM. A classic PWM has L = 2levelsbut
also L
= 3 levels PWM and L>3 PWM techniques,
up to 9 in [16], can be implemented. In 2-state PWM the
signal is switching between maximum and minimum supply
voltage values, the two states V
+
and V
−
. Even for low-level
signals binary modulation continuously provides energy to
the LC filter and to the load. If the modulating input is
null the PWM wave is still switching with a 50% duty cycle.
The signal provided to the load is null but switching losses
are paid thus reducing power efficiency. The 3-state PWM
signal switches between V
+
and 0 when the input signal is
positive, otherwise between V
−
and 0. In case of null input
there is no switching activity and hence switching losses are
reduced. The 3-state PWM modulator reduces by a factor 2
the voltage swing supported by the power MOS transistors
allowing also the reduction of electromagnetic interference
(EMI) and a better behaviour of the power devices. By
further increasing the number of levels L the EMI and the
switching losses can be further reduced. However while 2 and
3 levels PWM can be implemented with a single power MOS
bridge, a PWM with levels L>3 require multiple power
bridges, with matched behaviour. This increases remarkably
the amplifier complexity and cost. Our analysis proves that
for L>3 the complexity increase is not justified by a
performance gain which is limited if compared to ternary
PWM.
While the power output stage can be the same for 2
and 3 levels PWM, the digital circuitry is different. To
generate a 2-state PWM digital wave each p-bit noise shaped
and oversampled sample is compared to a digital sawtooth
waveform. The 3-state PWM modulator is realized using two
2-state PWM modulators, one for positive input samples
and the other for negative samples: after controlling the
sign of each sample only one of the two 2-state modulators
is enabled. Although 3-state PWM modulation doubles
the cost of the 2-state one the complexity of the whole
system is comparable. Indeed, as shown in Section 4, the
overall digital circuitry complexity is dominated by the noise
shaping and oversampling filters which are common to
3- and 2-state PWM. Summarizing 3 levels PWM is the
best trade-off between performance and circuit complex-
ity.
3.5. Dead Time Inser tion. Before driving the power stage,
proper guard intervals have to be inserted at the beginning
and at the end of each PWM word to take into account
the switching delay time of the selected power MOS devices.
The minimal time resolution of the PWM wave is T
min
=
1/(M · F
IN
· 2
p
), determined by the oversampling and noise
shaping choices, which can be smaller than the switching
transition time of typical power MOS. As example the
sizing in Section 3.2 leads to a T
min
of 11 nanoseconds
smaller than the 20 nanoseconds switching delay of the
selected MOS devices [26]. If the time guard intervals are
not inserted, PWM words with duty cycles of few % or
near 100%, that is, with high or low time intervals of
tens of nanoseconds, cannot be correctly managed by the
power stage and distortions will arise. Moreover, since the
switching times of P- and N- MOS are not the same, for
each transition of the PWM signal there is the risk of a
short circuit between the voltage supplies (a MOS is already
on while the other is not completely off). To avoid these
power wasting phenomena extra dead time intervals have
to be inserted when the PWM wave is switching. On the
other hand the higher the inserted time guard and dead
time intervals, the higher the reduction of the amplifier
dynamic range. An optimal sizing of the time intervals to
be inserted can be found simulating in the Simulink/Spice
environment the whole amplifier including accurate models
of the power MOS time response. Figure 6 shows the THD
reduction factor, that is, the ratio between the THD obtained
when inserting different guard intervals tg versus the THD
obtained without any time guard. In Figure 6 the THD is
reduceduptoafactor4usingatg of 30 nanoseconds (curve
“typical”). The example architecture considered in Figure 6
is that with oversampling and noise shaping sized as in
Section 3.2 plus ternary PWM, power stage of Section 3.6,
no feedback loop. The optimal value for tg in Figure 6
is derived from architecture simulations; a mathematical
formula in closed form is not available. When considering
PVT (process, voltage and temperature) variations of the
implementing hardware devices (e.g., the FPGA and the
power components of the prototype in Section 4) the THD
reduction curve varies; see as example in Figure 6 the curves
reported with dashed lines corresponding to the “min” and
“max” corner cases. Using the tg value calculated in nominal
conditions (30 nanoseconds in our case, see “typ” curve in
Figure 6) a suboptimal, but still noticeable, THD improving
factor is obtained versus the case with no time guard
insertion. In Figure 6 with tg
= 30 nanoseconds the THD
reduction versus the case without any time guard is from
0.25 to 0.55 depending on the PVT conditions. Moreover,
as discussed in Section 3.5, the use of a proper feedback
scheme can reduce the architecture sensitivity to parameters
variation.
3.6. Output Power Stage. Figure 7 reports the circuit
schematic of the full bridge power stage, using commer-
cial power MOS from [26]. A complementary N-/P-MOS
solution is adopted. A level-shifting circuitry is used for
high-side gate driving. Discrete power MOS are available
EURASIP Journal on Embedded Systems 7
1
SLI
SΔC
S1
0
S2
NPWM
UPWM
ΔC
LI
t
p
T
t
p
= pulse width;
T
= sampling period;
S1
= past uniform sampled point
S2
= current uniform sampled point
SLI
= LI estimated point
SΔC
= ΔC estimated point
SΔC
= S1+
(S2
−S1) ×(S2 −S1)
2
SLI
=
S1
1+S1 −S2
Figure 5: Example pulse width in UPWM, NPWM, ΔC- and LI- NPWM.
0
0.25
0.5
0.75
1
1.25
1.5
THD reduction factor
0 30 60 90 120
tg (ns)
Typ
Min
Max
Figure 6: THD reduction versus inserted time guard tg.
with associated gate driver buffers (represented by B1,
B2, B3, B4 in Figure 7), allowing the connection of the
output power stage to the PWM output of a low-power
digital circuit, such as an FPGA. For the target power
levels of this work the supply voltage Vdd in Figure 7 is
sized at 25 V. The LC filter in Figure 7 is a differential
4th-order Butterworth with 20 kHz cutoff.Inourmodel
we compared several LC filtering stages, with different
filter order and considering Butterworth, Chebychev and
Elliptic types. Figure 8 reports the THD achieved using
Butterworth, Chebychev (0.5 dB pass-band ripple) and Ellip-
tic (0.1 dB pass-band ripple) analog filters with a cutoff
frequency of 20 kHz and considering different filter orders.
From Figure 8 it can be noted that the performances of
the filters are similar (elliptic filters are not defined for
orders lower than 3). Butterworth type is preferred to
avoid ripple in the pass-band. After the 4th order the
THD reduction obtained increasing the filter complexity is
minor.
3.7. Feedback Topologies. As far as feedback topology is
concerned different schemes have been modelled. One
solution is an open loop amplifier avoiding the problem of
how to reinsert the power output signal in the low-power
digital processing chain. This solution is widely adopted
in literature, for example, in [13, 19]. Our simulations
prove that an open loop scheme adopting oversampling,
noise shaping, ΔC cross point estimation, 3-level PWM
and dead time compensation (this scheme is nicknamed
A1 in Figures 9 and 10) can be properly configured taking
into account the real characteristics of the power stage.
This open-loop amplifier leads to optimal THD and power
efficiency results, see Figures 9 and 10, comparable to those
obtained with closed-loop feedback amplifiers but avoiding
extra hardware components. However if a circuit parameter
changes (e.g., the PVT variations discussed in Section 3.4 and
Figure 6) versus the reference value used for configuration
or the supply voltage is affected by ripple there is not a
compensating mechanism. Indeed, for open loop amplifiers
it is mandatory the use of regulated supply voltages [19].
To reduce the amplifier sensitivity a feedback loop can be
added to the architecture configuration A1. As example, in
the architecture nicknamed A2 in Figures 9 and 10, the signal
generated by the digital PWM modulator is compared to
a scaled version of the output amplified PWM wave. Their
difference Verr is sent to a lowpass analog controller, with
transfer function C(s), extracting the DC component of the
error. In our model we considered and simulated for C(s)
an active filter (OpAmp plus RC network) with parametric
cutoff frequency and filter order. The generated DC error
level is then used in the PWM correction unit of Figure 2
to properly insert time delays in the PWM modulator
thus driving the power MOS stage with a corrected PWM
signal. Note that such approach is similar to some feedback
algorithms proposed in literature: for example, in [9]C(s)
is realized as a simple 1st order integrator while in [11]
a more performing algorithm called PEDEC (Pulse Edge
Delay Error Control) is used for PWM correction, starting
from the generated DC error level. The results in Figures 9
8 EURASIP Journal on Embedded Systems
Dx
B1
B2
Rx
M1
Cx
M2
L4 L2
C3 C1
Speaker
V
DD
L2
C1
L4
C3
Rx
M3
Cx
M4
Dx
B3
B4
0
Figure 7: Full bridge power stage schematic.
0.05
0.10
0.15
0.20
THD (%)
2345
Anlog low pass filter order
Butterw
Cheby 0.5
Elliptic
Figure 8: THD reduction for different analog LC filter types.
and 10 for the amplifier nicknamed A2 refer to a feedback
configuration with a 3rd order lowpass C(s) filter and using
PEDEC as compensating technique. This approach provides
good results but is not useful for a low-complexity and low-
cost realization since it requires an extra analog feedback
network.
With respect to that adopted in A2, more complex mixed-
signal feedback correction schemes have been proposed in
literature [10, 18]. In these schemes the output PWM power
signal, after attenuation and filtering, is converted in the
digital domain through extra ADCs: 7-bit flash ADC in [10]
and 10-bit SAR ADC in [18]. In the digital domain similar
operations to those of A2 are carried out. These feedback
schemes using ADC and operating in the digital domain
have been also modelled. The achievable THD and sensitivity
performances are slightly better than those of A2 while the
hardware overhead is much higher: an attenuator, a filter and
an ADC are required in the analog domain plus a digital
correcting unit in the digital one. Being too complex the
feedbacks schemes with ADCs are not considered in the
comparison of Figures 9 and 10.
A simpler but effective feedback correction technique
to reduce the amplifier sensitivity to parameter changes is
derived from [21]: the sign of the output current provided
50
60
70
80
90
100
Efficiency (%)
010203040506070
Pout (Wrms)
A1
A2
A3
Figure 9: Feedback type comparison, power efficiency versus Pout.
0
0.2
0.4
0.6
0.8
1
THD (%)
0 10203040506070
Pout (Wrms)
A1
A2
A3
Figure 10: Feedback type comparison, % THD (at 1 kHz) versus
Pout.
to the load is used as 1-bit control to check periodically
which output transistor is on and to change consequently
the inserted time-guard value. In [21] this technique has
been proposed for the control of a 2-state PWM power-
bridge. In this work this approach has been redesigned to
be integrated with oversampling, noise shaping, ΔCcross
point estimation and 3-level PWM creating a new amplifier
scheme: A3, 1-bit feedback extension of the open loop A1. In
our implementation we selected the value of 10 nanoseconds
as resolution of correction for the PWM waveform.
With reference to max 70 Wrms delivered to a 4 Ω
speaker, Figures 9 and 10 compare the amplifier schemes
EURASIP Journal on Embedded Systems 9
A1, A2 and A3 in terms of power efficiency and THD. The
maximum power efficiency, up to roughly 95% in Figure 9,
is achieved by the open loop scheme A1. With such high-
efficiency each power MOS of the full bridge is dissipating
less than 1 W avoiding extra cooling hardware. These results
outperform classic DAC plus analog amplifier solutions: as
example the hybrid analog scheme in [5] has a maximum
power efficiency below 77%. The schemes with feedback
topologies, A2 and A3, achieve similar efficiency, higher
than 90%, only for power levels higher than 25–30 Wrms.
Concerning THD, the lower distortion is achieved around
40–50 Wrms. The minimum THD is below the target of
0.2%; the use of feedback schemes allows reaching the target
THD on a wider frequency range versus the open loop A1
scheme. Between A2 and A3 amplifiers the latter is preferred
since it improves the THD and sensitivity performance of
A1 but with minimal complexity overhead and minimal
efficiency losses.
4. Prototyped Digital Audio Amplifier
From the design space exploration carried out in Section 3
the amplifier architecture, summarized hereafter, resulted
as an optimal trade-off between circuit complexity, power
efficiency, output distortion and low sensitivity to parameter
changes. The digital part includes: an oversampler by a
factor M
= 16 using an Equiripple 4-stage polyphase FIR
interpolating filter, a cross point estimator based on ΔC
technique realizing a NPWM scheme, a noise shaper with
p
= 7 output bits and a 5th-order noise shaping filter, 3-
level PWM generation, correction of PWM words through
the insertion of time guard intervals also as a function of a
1-bit signal feedback.
The digital processing part, implemented in HDL, has
been synthesized in different CMOS standard-cells technolo-
gies (90 nm 1 V supply voltage and 180 nm 1.8 V supply
voltage) resulting in a digital complexity of 15.2 Kgates,
mainly due to the noise shaping and interpolating filters.
The low circuit complexity allows the fitting of the digital
circuitry on several low-cost SRAM-based FPGA devices.
As example the processing part of the amplifier occupies
90% of a Xilinx Virtex XCV100 or 58% of a Xilinx
Spartan3 200. Such devices are available for large volume
production at a cost of few dollars. Hence the low circuit
complexity of the proposed architecture allows for a low-
cost implementation. The power consumption for the above
cited implementations is in the order of few hundreds of mW,
as example 100 mW when integrating the amplifier in the
XCV100 and playing 44.1 kS/s CD-quality audio signals.
The output stage is a full bridge made up of N-
/P- MOS devices from [26]plusadifferential 4th-order
LC Butterworth filter. Table 5 summarizes the measured
results on the amplifier prototype. The THD value at 1 kHz
refers to a 16-bit 44.1 kS/s CD-quality input signal and is
evaluated using an Audio Precision test setup. The high
power efficiency achieved permits an output power up to
70 Wrms without using extra cooling hardware. The results
in Ta b le 5 (Pmaxof70Wrms,THDof0.13%andefficiency
0
0.2
0.4
0.6
0.8
1
THD (%)
0 10203040506070
Pout (Wrms)
Open loop 4 Ohm
1b feedback 4 Ohm
Open loop 8 Ohm
1b feedback 8 Ohm
Figure 11: Architecture sensitivity example, % THD in case of load
change.
Table 5: Summary of amplifier characteristics.
Design metric Value Test conditions
Efficiency 94% at 45 Wrms
16-bit 44.1 kS/s signal, 1 kHz tone
THD 0.13% at 45 Wrms
Pmax 70 Wrms 4 Ω load
of 94% at 45 Wrms) confirm the performance estimation
made by simulations during the design phase in Sections 2
and 3, particularly in Figures 9 and 10 (Pmax of 70 Wrms,
THD below 2% and efficiency up to 95% in the range 40–
50 Wrms).
The prototype allowed us also to assess the performance
improvement of the 1-bit compensating loop scheme. The
sensitivity of the amplifier to parameter changes is an
important feature against temperature variations, devices
tolerances, power supply ripple. As example, Figure 11 shows
how the THD degrades when the system configuration is
optimised for 4 Ω speaker and then the load is changed with
an 8 Ω speaker. Both the cases with 1-bit feedback scheme
(1b feedback) and without (open loop) are considered. From
Figure 11 it is worth noting how the THD performance
degradation due to parameter change is lower in the
amplifier with feedback.
5. Comparison to the State of the Art and
Future Work
5.1. Comparison to the State of the Art. When compared
to the state of the art of digital input power amplifiers
our prototype stands for its low-complexity, while keeping
high power efficiency and low THD levels. The distortion
levels, THD below 0.2% at 1 kHz in the power range 35–
60 Wrms with a minimum of 0.13% at 45 Wrms (see A3 in
Figure 10), are suitable for audio Hi-Fi applications. Other
worksinliteratureachievelowerTHDvalues,asexample
in [13] the THD is 0.02% for similar power levels of 50 W,
but at the expense of a lower efficiency and an increased
complexity. The power efficiency is 80% in [13] while in
our work is higher than 90%. The digital processing tasks
in [13] require the use of multiple boards (1 DSP board for
10 EURASIP Journal on Embedded Systems
the digital audio processing plus 1 FPGA board for PWM
processing) while our architecture just requires 1 low-cost
FPGA having a bounded circuit complexity of 15 Kgates.
The multiple boards digital amplifier in [13] features also
a configuration with 90% power efficiency but with a THD
of 0.2%. In [16] with a 9 level PWM inverter the achieved
performances of 0.25% THD and 80% efficiency are worse
than our results. This confirms our analysis in Section 3.4
that 3-level PWM is the optimal choice for the output stage.
Compact solutions using a single chip for the digital part,
as in our work, and without heatsink have been proposed
in [9, 19, 23, 31, 32]. However [19] is missing the feedback
scheme needed, as proved in Section 4, against parameter
changes; in [9] the efficiency levels are lower than those
achieved by our scheme. The FPGA-based audio amplifier
in [23] is missing feedback and NPWM techniques; it has
apowerefficiency of 80% and a THD of 1% both worse
than our achieved results. In [31, 32] only the interpolation
filter is implemented occupying a whole Spartan FPGA. With
respect to our previous conference paper [20], where only
UPWM is implemented and a lower oversampling factor
and a less-performance FIR interpolating filter are used, the
audio processing system in this work has been improved
including the digital techniques for NPWM, more accurate
models for all the analog components, a more performing
interpolating filter. The prototyped architecture in this work
versus [20] achieves a much better THD value, predicted
by the simulations and confirmed by measures on the
prototype. Finally in some works [10, 17, 24], the shown
results refer to simulations or prototypes only of the low-
power PWM generator without including a real prototyped
power stage. As discussed in this work, and widely proved in
literature, the nonideal behaviour of the power stage is a key
issue in power audio amplifiers.
5.2. Future Work. The proposed platform-based approach
has been used also to define the optimal architecture of
digital power audio amplifiers using other complementary
power MOS devices, such as the IR530 and IR9530. The
achieved results with these MOS devices prove that, targeting
apowerlevelof45Wrmsonan8Ω load, optimal distortion
performances below 0.2% can be reached in the range 17–
35 Wrms with a power efficiency higher than 90%. The
resulting architecture is similar to that discussed in Section 4
with the exception of the tuning of some parameters
specifically optimized for the characteristics of the new
power devices.
As work extension we are applying the same method-
ology to the design of a fully integrated digital input
audio amplifier targeting maximum power levels of 1-2 W.
Such amplifiers of few Watts are needed for battery-power
terminals with audio playing capability [33, 34]. The design
of the amplifier is carried out using an architecture similar
to that in Section 4 fittedonaBCD0.35μm technology
providing CMOS transistors for the digital part and DMOS
transistors for the analog power part. The only off-chip
circuit is the LC lowpass filter. Postlayout characterization
proves that the digital amplifier can be integrated in less
than 2 mm
2
. The integrated power stage is an inverter with
NDMOS sized with W
= 22 mm and L = 6μm supporting,
with low R
DS
on of few mΩ, output currents of 0.14 A on
output load of 100 Ω.
6. Conclusions
The design of digital audio power amplifiers is presented
in the paper. A modelling platform has been built to
allow a fast but still accurate exploration of the mixed-
signal design space which involves the codesign of (i)
audio processing algorithms with physical characteristics
of hardware components and of (ii) low-power integrated
digital circuits with analog power devices. Different amplifier
architectures have been modelled, simulated and compared
to find optimal trade-offs among different cost-functions:
low-distortion, high power efficiency, low circuit complexity
and low sensitivity to parameter changes. The selected
amplifier architecture has been prototyped, for power levels
of tens of Watts, implementing the digital processing part
on a single low-complexity FPGA while off-chip components
are used for the power output stage, no heatsink is required.
The resulting digital amplifier, compared with the state of
the art, features a low circuit complexity while keeping good
power efficiency, higher than 90%, and low-distortion levels,
down to 0.13%. As future extension the realization of a fully
integrated digital amplifier in BCD technology is presented
for power levels of few Watts.
Acknowledgment
The work has been partially supported by the SHAPES FP6
EU project.
References
[1] D. Self, Audio Power Amplifier Design Handbook,Newnes,
Oxford, UK, 4th edition, 2006.
[2] S. Saponara, “Current-feedback architecture for high-slew-
rate and low-THD high-end audio amplifier,” Electronics
Letters, vol. 44, no. 25, pp. 1433–1434, 2008.
[3] G. Walker, “A class B switch-mode assisted linear amplifier,”
IEEE Transactions on Power Electronics, vol. 18, no. 6, pp. 1278–
1285, 2003.
[4] A.E.Ginart,R.M.Bass,W.M.LeachJr.,andT.G.Habetler,
“Analysis of the class AD audio amplifier including hysteresis
effects,” IEEE Transactions on Power Electronics, vol. 18, no. 2,
pp. 679–685, 2003.
[5] S. Saponara and P. Terreni, “Switching-based topologies for
high-efficiency audio amplifiers,” in Proceedings of the Interna-
tional Symposium on Signals, Circuits and Systems (ISSCS ’05),
vol. 1, pp. 283–286, 2005.
[6] S. Poulsen and M. Andersen, “Hysteresis controller with
constant switching frequency,” IEEE Transactions on Consumer
Electronics, vol. 51, no. 2, pp. 688–693, 2005.
[7] R. E. Hiorns and M. B. Sandler, “Power digital to analogue
conversion using pulse width modulation and digital signal
processing,” IEE Proceedings G, vol. 140, no. 5, pp. 329–338,
1993.
EURASIP Journal on Embedded Systems 11
[8] E. Botti, A. Grosso, C. Meroni, and F. Stefani, “Digital input
audio power amplifiers in 0.6-μm BCD technology: two
examples,” in Proceedings of the IEEE International Symposium
on Power Semiconductor Devices & ICs (ISPSD ’04), vol. 16, pp.
93–96, Kitakyushu, Japan, 2004.
[9] A. Grosso, E. Botti, F. Stefani, and M. Ghioni, “A 250 W audio
amplifier with straightforward digital input-PWM output,”
in Proceedings of the European Solid-State Circuits Conference
(ESSCIRC ’05), pp. 225–228, 2002.
[10] P. Midya, B. Roeckner, and S. Bergstedt, “Digital correction
of PWM switching amplifiers,” IEEE Power Electronics Letters,
vol. 2, no. 2, pp. 68–72, 2004.
[11] K. Nielsen, “PEDEC—a novel pulse referenced control
method for high quality digital PWM switching power ampli-
fication,” in Proceedings of IEEE Power Electronics Specialist
Conference (PESC ’95), pp. 200–208, 1998.
[12] S. Saponara, L. Fanucci, and P. Terreni, “Oversampled and
noise-shaped pulse-width modulator for high-fidelity digital
audio amplifier,” in Proceedings of the IEEE International
Conference on Electronics, Circuits, and Systems (ICECS ’06),
pp. 830–833, Nice, France, 2006.
[13] C. Pascual, Z. Song, P. T. Krein, D. V. Sarwate, P. Midya,
and W. B. J. Roeckner, “High-fidelity PWM inverter for
digital audio amplification: spectral analysis, real-time DSP
implementation, and results,” IEEE Transactions on Power
Electronics, vol. 18, no. 1, pp. 473–485, 2003.
[14] B H. Gwee, J. S. Chang, and V. Adrian, “A micropower low-
distortion digital class-D amplifier based on an algorithmic
pulse width modulator,” IEEE Transactions on Circuits and
Systems I, vol. 52, no. 9, pp. 934–949, 2005.
[15] B. Gwee, “Micropower low-distortion digital pulse width
modulator for a digital class D amplifier,” IEEE Transactions
on Circuits and Systems II, vol. 49, no. 5, pp. 1–13, 2002.
[16] V. M. E. Antunes, J. F. Silva, and V. Fern
˜
ao-Pires, “Experimen-
tal evaluation of a digital multi-level audio power amplifier,”
in Proceedings of the IEEE Annual Power Electronics Specialists
Conference (PESC ’04), vol. 2, pp. 1175–1179, 2004.
[17] N. Vlassopoulos, D. Reisis, G. Lentaris, et al., “An approach for
efficient design of digital amplifiers,” in Proceedings of the IEEE
International Symposium on Circuits and Systems (ISCAS ’06),
pp. 5531–5534, 2006.
[18] Spectrum Design Solutions Inc., “Digital audio solutions
application brief,” 2006.
[19] Apogee, “Direct digital amplification (DDX) white paper,”
2002.
[20] S. Saponara and P. Terreni, “Mixed-signal design of a digital
input power amplifier for automotive audio applications,” in
Proceedings of the Conference on Design, Automation and Test
in Europe (DATE ’06), vol. 2, pp. 212–216, 2006.
[21] S G. Jeong and M H. Park, “The analysis and compensation
of dead time effects in PWM inverters,” IEEE Transactions on
Industrial Electronics, vol. 38, no. 2, pp. 108–114, 1991.
[22] J. M. Goldberg and M. B. Sandler, “Pseudo-natural pulse
width modulation for high accuracy digital-to-analogue con-
version,” Electronics Letters, vol. 27, no. 16, pp. 1491–1492,
1991.
[23]Y H.Liu,J H.Teng,andC H.Hsieh,“Designandimple-
mentation of a fully-digital, high-efficiency class-D amplifier
system,” in Proceedings of the IEEE Region 10th Annual
International Conference (TENCON ’07), pp. 1–4, Taipei,
Taiwan, 2007.
[24] A. Yoneya, “Pulse width and position modulation for fully dig-
ital audio amplifier,” in Proceedings of the IEEE International
Symposium on Circuits and Systems (ISCAS ’08), pp. 1692–
1695, Seattle, Wash, USA, 2008.
[25] S. Saponara, P. Nuzzo, C. Nani, G. van der Plas, and L. Fanucci,
“Architectural exploration and design of time-interleaved SAR
arrays for low-power and high speed A/D converters,” IEICE
Transactions on Electronics, vol. E-92C, pp. 843–851, 2009.
[26] Infineon Technologies, “Data sheet BSO200N03S, Optimos 2
Power-Transistor,” rev 1.6, 2008.
[27] J. Cerezo, “Class D audio amplifier performance relationship
to MOSFET parameters,” International Rectifier AN 1070,
2005.
[28] Philips, “Data sheet UDA1320ATS,” January 2000.
[29] D. Turek, Design of efficient digital interpolation filters for
integer upsampling, M.S. thesis, MIT, Boston, Mass, USA,
2004.
[30]N.BenameurandM.Loulou,“Designofefficient digital
interpolation filters and sigma-delta modulator for audio
DAC,” in Proceedings of the IEEE 4th International Conference
on Design & Technology of Integrated Systems in Nanoscal Era,
(DTIS ’09), pp. 1–7, 2008.
[31] P. Jacobsohn and D. Palmer, “Audio sample rate conversion in
FPGAs,” Xcell Journal, pp. 50–54, 2007.
[32] X. Huang, Y. Han, and L. Chen, “The design and FPGA ver-
ification of a general structure, area-optimized interpolation
filter used in sigma-delta DAC,” in Proceedings of the IEEE
International Conference on Solid-State and Integrated-Circuit
Technology (ICSICT ’06), pp. 2111–2113, Shanghai, China,
October 2006.
[33] R. Becker and W. H. Groeneweg, “An audio amplifier pro-
viding up to 1 Watt in standard digital 90-nm CMOS,” IEEE
Journal of Solid-State Circuits, vol. 41, no. 7, pp. 1648–1653,
2006.
[34] J Y. Ryoo and G H. Cho, “A single chip l W CMOS
audio power amplifier with pseudo buffer analog and class
D switching mixed mode for mobile application,” IEICE
Transactions on Electronics, vol. E-88C, no. 9, pp. 1886–1892,
2005.