báo cáo hóa học:" Research Article Pitch- and Formant-Based Order Adaptation of the Fractional Fourier Transform and Its Application to Speech Recognition" pptx
Bạn đang xem bản rút gọn của tài liệu. Xem và tải ngay bản đầy đủ của tài liệu tại đây (8.92 MB, 14 trang )
Hindawi Publishing Corporation
EURASIP Journal on Audio, Speech, and Music Processing
Volume 2009, Article ID 304579, 14 pages
doi:10.1155/2009/304579
Research Article
Pitch- and Formant-Based Order Adaptation of the Fractional
Fourier Transform and Its Application to Speech Recognition
Hui Yin,
1, 2
Climent Nadeu,
1
and Volker Hohmann
1, 3
1
TALP Research Center, Universitat Polit
`
ecnica de Catalunya, 08034 Barcelona, Spain
2
Department of Electronic Engineering, Beijing Institute of Technology, Beijing 100081, China
3
Medizinische Physik, Universit
¨
at Oldenburg, 26111 Oldenburg, Germany
Correspondence should be addressed to Hui Yin,
Received 27 March 2009; Revised 6 August 2009; Accepted 21 November 2009
Recommended by Mark Clements
Fractional Fourier transform (FrFT) has been proposed to improve the time-frequency resolution in signal analysis and processing.
However, selecting the FrFT transform order for the proper analysis of multicomponent signals like speech is still debated. In this
work, we investigated several order adaptation methods. Firstly, FFT- and FrFT- based spectrograms of an artificially-generated
vowel are compared to demonstrate the methods. Secondly, an acoustic feature set combining MFCC and FrFT is proposed,
and the transform orders for the FrFT are adaptively set according to various methods based on pitch and formants. A tonal
vowel discrimination test is designed to compare the performance of these methods using the feature set. The results show that
the FrFT-MFCC yields a better discriminability of tones and also of vowels, especially by using multitransform-order methods.
Thirdly, speech recognition experiments were conducted on the clean intervocalic English consonants provided by the Consonant
Challenge. Experimental results show that the proposed features with different order adaptation methods can obtain slightly higher
recognition rates compared to the reference MFCC-based recognizer.
Copyright © 2009 Hui Yin et al. This is an open access article distributed under the Creative Commons Attribution License, which
permits unrestricted use, distribution, and reproduction in any medium, provided the original work is properly cited.
1. Introduction
Traditional speech processing methods generally treat speech
as short-time stationary, that is, process speech in 20
∼
30-milliseconds frames. In practice, however, intonation
and coarticulation introduce combined spectrotemporal
fluctuations to speech even for the typical frame sizes used in
the front-end analysis. Modeling speech signals as frequency
modulation signals therefore might accord better with speech
characteristics from both production and perception views.
From the speech production view, traditional linear
source-filter theory lacks the ability to explain the fine
structure of speech in a pitch period. In the 1980s, Teager
experimentally discovered that vortices could be the sec-
ondary source to excite the channel and produce the speech
signal. Therefore, speech should be composed of the plane-
wave-based linear part and the vortices-based nonlinear part
[1]. According to such theory, Maragos et al. proposed an
AM-FM modulation model for speech analysis, synthesis
and coding. The AM-FM model represents the speech signal
as the sum of formant resonance signals each of which
contains amplitude and frequency modulation [2]. From the
perception view, neurophysiological studies show that the
auditory system of mammals is sensitive to FM-modulated
(chirpy) sounds. Experiments in ferrets showed that the
receptive fields found in primary auditory cortex have, as
their counterparts in the visual cortex, Gabor-like shapes and
respond to modulations in the time-frequency domain [3].
This fact underpins the notion of the high sensitivity of the
human hearing system to nonstationary acoustic events with
changing pitch (police and ambulance siren). In acoustic
signal processing this effect is called auditory attention [4].
Recently, a number of works related to AM-FM modeling
of speech as well as its applications to speech analysis and
recognition recently have been reported [5–13].
A simple but very effective analysis tool is the spectro-
gram based on the short-time Fourier transform (STFT),
which considers signals as short-time stationary signals. For
sound signals, especially human speech signals, it gained
very good results and thus has been very widely used, but
2 EURASIP Journal on Audio, Speech, and Music Processing
a compromise of the window length has always to be made to
satisfy the requirements of time and frequency resolution. To
solve this problem, many time-frequency analysis methods
have been introduced, such as the wavelet transform, the
Wigner-Ville distribution, the Radon-Wigner transform, and
the Fractional Fourier transform.
Fractional Fourier transform, as a new time-frequency
analysis tool, is attracting more and more attention in signal
processing literature. In 1980, Namias first introduced the
mathematical definition of the FrFT [14]. Later Almeida
analyzed the relationship between the FrFT and the Wigner-
Ville Distribution (WVD) and interpreted it as a rotation
operator in the time-frequency plane [15]. Since FrFT can
be considered as a decomposition of the signal in terms of
chirps, FrFT is especially suitable for the processing of chirp-
like signals [16]. Several approaches to modeling speech or
audio signals as chirp-like signals have been studied [17–19].
In [20], chirped autocorrelations and the fractional Fourier
transform are used to estimate the features which can char-
acterize a measured marine-mammal vocalization. In [21],
sinewave analysis and synthesis is done based on the Fan-
Chirp transform [22]. Because the Fan-Chirp transform can
provide a set of FM-sinewave basis functions consistent with
harmonic FM, the developed sinewave analysis/synthesis
system can obtain more accurate sinewave frequencies and
phases, thus creating more accurate frequency tracks than
that derived from the short-time Fourier transform, espe-
cially for high-frequency regions of large-bandwidth analysis.
The segmental signal-to-noise ratio with synthesis was also
improved with that technique. There are also some papers on
chirp-sensitive artificial auditory cortical model [23, 24]. For
example, [23] uses a combination of several (at least three)
Harmonic-Chirp transform instances which project the
time-frequency energy on different views. The mechanism
shows biological parallels such as intrinsic chirp sensitivity
and response to the logarithm of the stimulus energy
and was validated with several mammal sounds including
human speech. Research on the application of FrFT or
similar transforms to speech signal processing mainly focuses
on speech analysis [23, 25–28], pitch estimation [4, 29],
speech enhancement [30, 31], speech recognition [32],
speaker recognition [33], and speech separation [34]. These
methods basically can give higher time-frequency resolution
than the traditional FFT-based method, a more accurate
pitch estimate, and have shown to be beneficial for speech
enhancement, speech recognition, speaker recognition, and
monaural speech separation.
When applying the FrFT, the determination of the
optimal FrFT transform order is a crucial issue. The order is a
free parameter that is directly related with the chirp rate, that
is, the temporal derivative of the instantaneous frequency
oftheFrFTbasisfunction.Thereisstillnoeffective way to
calculate the order optimally, that is, in a way that the chirp
rates of the basis functions and of the signal match. The
step search method [16] is simple, but a compromise has
to be made between the computational complexity and the
accuracy. The method based on the location of minimum
second-order moments of the signal’s FrFT also has its
limitations [35, 36]. The Wigner-Hough transform based
method in [37] needs to calculate the integrations along all
the lines in the time-frequency plane; so the computation
time is rather extensive. In [16], a quasi-Newton method is
used to simplify the peak detection in the fractional Fourier
domains. In [38], the order is estimated by calculating the
ambiguity function of the signal. This method decreases the
computation time because it detects the chirp rate by only
integrating along all the lines which pass through the origin.
All those existing order estimation methods were not
proposed for speech signals; so they do not consider or take
advantage of the special characteristics of speech. In this
work, we show that the representation of the time-varying
properties of speech may benefit from using the values of
pitch and formants to set the order of the FrFT. Different
order adaptation methods based on pitch and formants are
investigated by using the FFT- and FrFT- based spectrograms
of an artificially generated vowel. In order to compare
the performance of these order adaptation methods, tone
classification experiments are conducted on a small set of
Mandarin vowels, where the classes correspond to the four
basic types of tones. The discrimination ability is measured
using acoustic features based on the combination of MFCC
and FrFT for the different order adaptation methods. Finally,
these methods are further assessed using speech recognition
experiments which are conducted on intervocalic English
consonants.
The rest of the paper is organized as follows. In
Section 2, the AM-FM model of speech is described, and the
motivation of the proposed method is given. In Section 3
,
the definition and some basic properties of the FrFT are
briefly introduced. In Section 4,different order adaptation
methods are described and illustrated using FFT- and FrFT-
based spectrograms of an artificially generated vowel. In
Section 5, a tonal vowel discrimination test is designed, and
the results are given and analyzed. Section 6 presents the
ASR experimental results and discussion. Conclusions and
suggestions for future work are given in Section 7.
2. The AM-FM Model of Speech
A speech production model generally contains three com-
ponents: an excitation source, a vocal tract model and a
radiation model. In speech processing, pitch is tradition-
ally considered as constant within a frame, so for voiced
speech, the excitation signal is produced by a periodic pulse
generator. Practically, in particular for tonal languages, the
pitch value is changing even within a frame. Considering
the fluctuation of pitch and the harmonic structure, voiced
speech can be modeled as an AM-FM signal. The AM-FM
model proposed in [2] represents the speech signal as the
sum of several formant resonance signals, each of which is an
AM-FM signal. Herewith, we use an expression which tries
to model the speech as a sum of the AM-FM harmonics:
x
(
t
)
=
∞
n=1
a
n
(
t
)
cos
n
ω
0
t +
t
0
q
(
τ
)
dτ
+ θ
n
,
(1)
where a
n
(t) is the time-varying amplitude signal, ω
0
is
the fundamental (angular) frequency or pitch, θ
n
is the
EURASIP Journal on Audio, Speech, and Music Processing 3
initial phase, n is the index of the harmonics, and q(t)is
the frequency modulation function. Making the reasonable
simplification that the frequency is changing linearly within
the frame, that is,
q
(
t
)
= kt,
(2)
where k is the chirp rate of the pitch (referred to as pitch rate
in the rest of the paper), and its unit is Rad/s
2
. We can obtain:
x
(
t
)
=
∞
n=1
a
n
(
t
)
cos
⎛
⎜
⎜
⎜
⎜
⎝
n
ω
0
t +
1
2
kt
2
+ θ
n
ϕ
n
(
t
)
⎞
⎟
⎟
⎟
⎟
⎠
.
(3)
The chirp rate of the nth harmonic is the second derivative
of the phase function:
d
2
ϕ
n
(
t
)
dt
2
= q
n
= nk,
(4)
which means that the chirp rate of the nth harmonic is n
times the pitch rate.
3. Definition of the Fractional Fourier
Transform
The FrFT of signal x(t) is represented as [16]
X
α
(
u
)
= F
p
[
x
(
t
)
]
=
∞
−∞
x
(
t
)
K
α
(
t, u
)
dt,
(5)
where p is a real number which is called the order of the FrFT,
α
= pπ/2 is the transform angle, F
p
[·] denotes the FrFT
operator, and K
α
(t, u) is the kernel of the FrFT:
K
α
(
t, u
)
=
⎧
⎪
⎪
⎪
⎪
⎪
⎪
⎪
⎪
⎪
⎪
⎨
⎪
⎪
⎪
⎪
⎪
⎪
⎪
⎪
⎪
⎪
⎩
1 − jcotα
2π
,
×exp
j
t
2
+ u
2
2
cotα
− jutcscα
, α
/
=nπ,
δ
(
t
−u
)
, α = 2nπ,
δ
(
t + u
)
, α
=
(
2n
±1
)
π.
(6)
The kernel has the following properties:
K
−α
(
t, u
)
= K
∗
α
(
t, u
)
,
∞
−∞
K
α
(
t, u
)
K
∗
α
(
t, u
)
dt
= δ
(
u − u
)
.
(7)
Hence, the inverse FrFT is
x
(
t
)
= F
−p
[
X
α
(
u
)
]
=
∞
−∞
X
α
(
u
)
K
−α
(
t, u
)
du. (8)
Equation (8) indicates that the signal x(t) can be interpreted
as a decomposition to a basis formed by the orthonormal
Linear Frequency Modulated (LFM) functions (6) in the u
domain. This means that an LFM signal with a chirp rate
corresponding to the transform order p can be transformed
into an impulse in a certain fractional domain. For instance,
it can be seen from the kernel function form in (6) that for
the nth harmonic with chirp rate nk (see (3)and(4)), when
the transform angle satisfies the equation: tan(α+π/2)
= nk,
this harmonic can ideally be transformed into an impulse.
Therefore, the FrFT has excellent localization performance
for LFM signals.
4. Order Adaptation Methods
Three types of order adaptation methods based on the
pitch and formants have been investigated and will be
demonstrated in this section by applying them to an
artificially-generated vowel [i:] with time-varying pitch. The
excitation of the vowel is a pulse train with linearly decreasing
frequency from 450 Hz to 100 Hz, and the formants of
the vowel are 384Hz, 2800 Hz, and 3440 Hz, which are
extracted from a real female vowel. The sampling rate is
8000 Hz, and the total duration of the signal is 1.5 secondes.
Short-time analysis with FFT and FrFT was done with a
Hamming window of length 640 samples, and a window
shift of 20 samples( long duration windows were used to
better visualize the methods. For the discrimination and
recognition experiments, however, window lengths typical
for speech processing were used).
4.1. Multiple of Pitch Rate. Since the chirp rates for different
harmonics are different, the FrFT is emphasizing the Nth
harmonic when setting the transform order according to
N times the pitch rate k. The transform angle is then
determined by
α
= acot
(
−k
∗
N
)
.
(9)
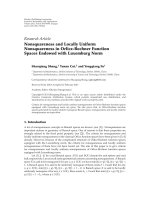
Ta ke N
= 5 as an example. Figures 1 and 2 show the FFT-
based and FrFT-based spectrograms of the vowel with and
without inclusion of formants, respectively.
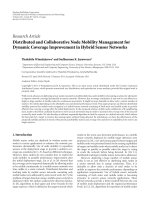
Figure 1 shows that the Nth harmonic and its neighbors
will be emphasized by the FrFT analysis; that is, the line
representing the Nth harmonic becomes thinner than in the
FFT-based spectrogram. From Figures 1 and 2, it can also be
seen that the representation of those harmonics whose chirp
rates are not close to N times the pitch rate will be smeared.
This also holds true for the formants, because the frequency
variations of the formants are generally smaller than those
of the harmonics; that is, the chirp rates of the formants are
generally much smaller than N times the pitch rate when N
gets large, for example, N
= 5.
4.2. Pitch and Formants. The subband energies that are
usually employed to compute the speech recognition fea-
tures, for example, in the widely used mel-frequency cepstral
coefficients (MFCCs), are a representation of the envelope,
that is, the formant structure, of voiced speech. There-
fore, the aim of the mel-scale subband integration (and,
additionally, the truncation of the sequence of cepstral
4 EURASIP Journal on Audio, Speech, and Music Processing
Time (ms)
0 200 400 600 800 1000 1200 1400
Frequency (Hz)
500
1000
1500
2000
2500
3000
3500
4000
FFT spectrogram
(a)
Time (ms)
0 200 400 600 800 1000 1200 1400
Frequency (Hz)
500
1000
1500
2000
2500
3000
3500
4000
FrFT spectrogram: 5 times of pitch rate
(b)
Figure 1: FFT-based (a) and FrFT-based (b) spectrograms of the artificial vowel (without formants). FrFT transform order was set to
enhance the 5th harmonic.
Time (ms)
0 200 400 600 800 1000 1200 1400
Frequency (Hz)
500
1000
1500
2000
2500
3000
3500
4000
FFT spectrogram
(a)
Time (ms)
0 200 400 600 800 1000 1200 1400
Frequency (Hz)
500
1000
1500
2000
2500
3000
3500
4000
FrFT spectrogram: 5 times of pitch rate
(b)
Figure 2: As in Figure 1, but with formants included.
coefficients in the MFCC representation) is to make the
harmonic structure disappear in order to have a pitch-free
envelope representation. Nevertheless, the FFT-based spec-
tral harmonics are an intermediate step in the computation
of the envelope, so a more precise representation of the
harmonics in relevant regions of the spectral envelope may
help to get more accurate formant estimates and also more
discriminative speech features. This is the motivation for the
order adaptation method based on pitch and formants that
is introduced in the following.
As in (9), the transform angle is determined by M times
of the pitch rate k:
α
= acot
(
−k
∗
M
)
. (10)
M will be computed from the frequency of a formant and the
pitch frequency as
M
= f
formant
/f
pitch
. (11)
Here, M is different for different analysis frames if either
pitch or formant frequency or both vary with time.
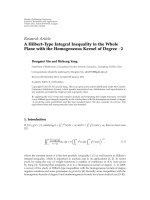
Figure 3 shows the FrFT- based spectrograms of the
artificial vowel using the pitch as well as the first (app.
400 Hz Figure 3(a)) and the second formant (app. 2.8 kHz
Figure 3(b)). We can see from Figure 3 that the spectral
lines of harmonics are thinnest when going through the
corresponding formants that were selected for the order
determination. As the formants are smeared to certain
EURASIP Journal on Audio, Speech, and Music Processing 5
Time (ms)
0 200 400 600 800 1000 1200 1400
Frequency (Hz)
500
1000
1500
2000
2500
3000
3500
4000
FrFT spectrogram: the first formant and pitch
(a)
Time (ms)
0 200 400 600 800 1000 1200 1400
Frequency (Hz)
500
1000
1500
2000
2500
3000
3500
4000
FrFT spectrogram: the second formant and pitch
(b)
Figure 3: FrFT-based spectrograms of the artificial vowel. The orders are determined by the pitch and the first formant (a) or the second
formant (b).
Time (ms)
0 200 400 600 800 1000 1200 1400
Frequency (Hz)
500
1000
1500
2000
2500
3000
3500
4000
FFT spectrogram
(a)
Time (ms)
0 200 400 600 800 1000 1200 1400
Frequency (Hz)
500
1000
1500
2000
2500
3000
3500
4000
Multi-order: N
= 1:10
(b)
Figure 4: FFT-based (a) and FrFT-based ((b); multiorder multiplication, N = 1, 2, , 10) spectrograms of the vowel.
extent, it needs to be investigated whether the better repre-
sentation of the harmonics in the vicinity of the formants
outweighs the smearing of the formants.
4.3. Multiorder Multiplication. Since different optimal orders
are needed for different harmonics, we can calculate the FrFT
with the orders corresponding to N
1
, N
2
, N
3
times of the
pitch rate and multiply them together. Multiplication of the
FrFT spectrograms is a somewhat heuristic approach and can
be regarded as being similar to a logical “and” operation. By
this, the transform with the order best suited for tracking a
specific feature will “win” in the final representation. This
method can obtain a compromise among several harmonics,
that is, the harmonics selected in the formant regions will be
enhanced and the smearing of the formants will be limited.
Figure 4 shows the FrFT spectrogram using this method for
a multiplication of FrFT orders from 1 to 10.
Finally, multiorder multiplication was applied to the
three FrFT spectrograms that target the first three formants
according to the technique described in Section 4.2.The
resulting multiplied FrFT spectrogram is shown in Figure 5.
In this case, formant smearing is limited, while still enhanc-
ing the harmonics going through the formant resonances.
5. Tonal Vowel Discrimination Test
In tonal languages as Mandarin, the time evolution of pitch
inside a syllable (the tone) is relevant for the meaning.
6 EURASIP Journal on Audio, Speech, and Music Processing
Time (ms)
0 200 400 600 800 1000 1200 1400
Frequency (Hz)
500
1000
1500
2000
2500
3000
3500
4000
FFT spectrogram
(a)
Time (ms)
0 200 400 600 800 1000 1200 1400
Frequency (Hz)
500
1000
1500
2000
2500
3000
3500
4000
Pitch + three formants
(b)
Figure 5: FFT-based (a) and FrFT-based spectrogram (b) with multiorder multiplication. The orders M1, M2andM3(see(11)) are equal
to the ratios between the three formant frequencies and the pitch frequency, respectively.
Consequently, there are relatively fast changes of pitch which
are usual and informative. In Mandarin, there are four
basic lexical tones and a neutral tone. The number of tonal
syllables is about 1,300, and it is reduced to about 410
when tone discriminations are discarded [39]. Fundamental
frequency or pitch is the major acoustic feature to distinguish
the four basic tones.
Since the proposed FrFT order adaptation methods may
show a more accurate representation of the time-varying
characteristics of the harmonics than the Fourier transform,
we tested their performance in a tonal vowel discrimination
experiment.
5.1. Experiment Design. We recorded the five Mandarin
vowels [a], [i](yi), [u](wu), [e], and [o](wo) with four tones:
the flat tone (tone 1), the rising tone (tone 2), the falling
and rising tone (tone 3), and the falling tone (tone 4).
Each tone of each vowel from a female voice is recorded
five times. The utterances are sampled at 8 kHz, with a 16-
bit quantization. We use 16-dimensional standard MFCC
features as the baseline. The features based on the FrFT are
computed with the same processing used for the MFCCs,
but substituting the Fourier transform by the FrFT (we
will refer to them as FrFT-MFCC) [40]. The performance
of FrFT-MFCC using different order adaptation methods
is compared with the baseline. Speech signals are analyzed
using a frame length of 25 milliseconds and a frame shift of
10 milliseconds.
Because the recorded utterances have variable lengths,
we use Dynamic Time Warping (DTW) to calculate the
distances between all the utterances for the individual vowels.
Thus, five 20
× 20 distance matrices are obtained (4 tones, 5
times). The discriminative ability of features can be analyzed
using the Fisher score, which is defined as the ratio between
the between-class variance and the within-class variance.
Here, we take the distances calculated by DTW to compute
a similar score (that will also be referred to as Fisher Score):
F
=
1/N
1
5
m
=1
5
n
=1
4
i
=1
4
j
/
=i,j=1
dist
v
m
i
, v
n
j
1/N
2
5
m=1
5
n=1
4
i=1
dist
v
m
i
, v
n
i
. (12)
v
m
i
represents the token m of a vowel with tone i. N
1
and
N
2
are the total numbers of the between-class and within-
class tokens, respectively. dist(
·) represents the Euclidean
Distance after pattern matching using DTW. By this analysis,
the discriminability across different tones of the same vowel
is assessed. The discrimination among different vowels is also
assessed here for comparison.
5.2. Pitch Rate and Formant Calculation. The speech signal
is processed in overlapping frames. Each frame is further
divided into several nonoverlapping subframes. A pitch value
is determined for each subframe. These pitch values are
obtained using a robust pitch tracking algorithm described
in [41]. In order to get the pitch rate of a given frame, we first
calculate the median value of the subframe pitch values for
the frame to set a threshold: if any subframe pitch value is
larger than twice this threshold, it is divided by 2; if any pitch
value is smaller than half the threshold, it is multiplied by
2. By this, octave confusions are largely eliminated. Then, a
straight line was fitted to all the corrected pitch values in this
frame. The pitch rate is taken as the slope of this fitted line.
For unvoiced speech, the transform order will be 1 because
no pitch is detected.
The formants are determined as the frequencies of the
LPC-based spectral peaks. The order of the LPC analysis is set
to be twice the number of formants (or twice the number of
formants plus two, and then the required formants are taken)
used in the multiorder FrFT analysis. Note that when the
number of formants used for the multiorder analysis exceeds
4, the derived spectral peaks may not represent real formants.
EURASIP Journal on Audio, Speech, and Music Processing 7
Consonants
b ch d dh dj f g h k l m n ng p r s sh t th v w y z zh
Error rates (%)
0
10
20
30
40
50
60
MFCC
(a)
Consonants
b ch d dh dj f g h k l m n ng p r s sh t th v w y z zh
Error rates drop (%)
−6
−4
−2
0
2
4
6
8
FrFT-MFCC: N
= 1
(b)
Consonants
b ch d dh dj f g h k l m n ng p r s sh t th v w y z zh
Error rates drop (%)
−4
−2
0
2
4
6
8
FrFT-MFCC: N
= 2
(c)
Consonants
b ch d dh dj f g h k l m n ng p r s sh t th v w y z zh
Error rates drop (%)
−8
−6
−4
−2
0
2
4
6
8
10
FrFT-MFCC: N
= 3
(d)
Consonants
b ch d dh dj f g h k l m n ng p r s sh t th v w y z zh
Error rates drop (%)
−6
−4
−2
0
2
4
6
8
FrFT-MFCC: N
= 5
(e)
Consonants
b ch d dh dj f g h k l m n ng p r s sh t th v w y z zh
Error rates drop (%)
−10
−5
0
5
10
15
FrFT-MFCC: pitch + MP
(f)
Consonants
b ch d dh dj f g h k l m n ng p r s sh t th v w y z zh
Error rates drop (%)
−6
−4
−2
0
2
4
6
8
10
12
FrFT-MFCC: pitch + 2MP
(g)
Consonants
b ch d dh dj f g h k l m n ng p r s sh t th v w y z zh
Error rates drop (%)
−6
−4
−2
0
2
4
6
8
10
FrFT-MFCC: pitch + 3MP
(h)
Consonants
b ch d dh dj f g h k l m n ng p r s sh t th v w y z zh
Error rates drop (%)
−6
−4
−2
0
2
4
6
8
FrFT-MFCC: pitch + 5MP
(i)
Consonants
b ch d dh dj f g h k l m n ng p r s sh t th v w y z zh
Error rates drop (%)
−8
−6
−4
−2
0
2
4
6
8
FrFT-MFCC: N
= 1, 2
(j)
Figure 6: Continued.
8 EURASIP Journal on Audio, Speech, and Music Processing
Consonants
b ch d dh dj f g h k l m n ng p r s sh t th v w y z zh
Error rates drop (%)
−6
−4
−2
0
2
4
6
FrFT-MFCC: N
= 1, 2, 3
(k)
Consonants
b ch d dh dj f g h k l m n ng p r s sh t th v w y z zh
Error rates drop (%)
−6
−4
−2
0
2
4
6
8
10
FrFT-MFCC: N
= 1, 2, ,5
(l)
Consonants
b ch d dh dj f g h k l m n ng p r s sh t th v w y z zh
Error rates drop (%)
−12
−10
−8
−6
−4
−2
0
2
4
6
FrFT-MFCC: N
= 1, 2, ,10
(m)
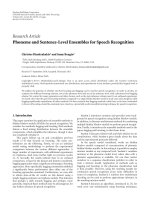
Figure 6: Consonant-specific results from the consonant recognition experiments: (a) consonant error rates using MFCC. (b)∼(m) are the
absolute error rate drop for each consonant (%), and they are corresponding to column 3 to column 14 in Tab l e 8 ,respectively.
Table 1: Fisher scores for tone discrimination using MFCC
separately for every vowel, and the average value across all vowels.
aieouAverage
MFCC 2.77 3.94 5.28 4.59 5.56 4.43
Table 2: Fisher scores for tone discrimination using FrFT-MFCC.
Orders are set according to N times of pitch rate.
aieouAverage
N = 1 2.63 4.48 6.24 4.90 6.61 4.97
N
= 2 2.58 4.15 6.07 4.78 6.48 4.81
N
= 3 2.55 3.95 5.90 4.68 6.38 4.69
N
= 5 2.49 3.71 5.61 4.52 6.19 4.5
Therefore, the general term “main peaks” (MP) will be used
in the following to denote the derived maxima of the LPC
spectrum.
5.3. Experimental Results. The Fisher scores for tone discrim-
ination for the different vowels using the various methods
are given in Tables 1 to 4. For comparison, the Fisher
scores for vowel discrimination are given inTables 9 to 12.
The experimental results show that FrFT analysis increases
the tone discriminability for most of the order selection
methods proposed here. An increase of the Fisher score by
one means that the across-class distance is increased by a
value that corresponds to the within-class variance, that is,
denotes a significant change.
We can see from the Fisher scores following.
The average Fisher score over all vowels using MFCC
is 4.43. This indicates that MFCC already has a good
discriminability for different tones, but the FrFT-MFCC
can get even better results, especially for the multiorder
multiplication method with N
= 1, 2, , 5, which obtains
a relative improvement of 43%. For comparison, the Fisher
score for the discrimination of different vowels of the
same tone is 12.20 on average across tones. This indicates
that the discrimination of tones is more difficult than
the discrimination of vowels, as expected, and that the
improvement of tone-discrimination by using the FrFT
might provide a large benefit for speech analysis and
recognition applications. Furthermore, the FrFT-methods
also improve the vowel discrimination slightly (Fisher score
increased by one, which denotes a similar absolute change,
but a smaller relative change than for the tone discrimina-
tion).
When using a single value of N for the multiple of pitch
rate method, the increases of the scores are moderate. Just
as stated before, the formants may be dispersed when N
gets larger, because the chirp rate of formants is not close to
that value. There is always an optimal value of N. Generally
N from 1 to 3 can obtain a good compromise between
tracking the dynamic speech harmonics and preserving the
concentration of the formants.
The pitch + “formants” method can obtain significantly
better results than the method only based on the pitch.
Different vowels have their different optimal numbers of
formants, for example, for [u], even using 10 formants its
maximum is still not achieved, but for [i], the maximum is
achieved using one main formant, and for [o], two formants.
EURASIP Journal on Audio, Speech, and Music Processing 9
Table 3: Fisher scores for tone discrimination using FrFT-MFCC. Orders are set according to pitch and “formants.” MP denotes the main
peaks of the LPC spectrum, and Pitch + xMP refers to the technique presented in Section 4.2. when x>1, the transforms are multiplied as
explained in Section 4.3 (Figure 5(b)).
aieouAverage
Pitch + MP 2.46 4.76 6 4.77 6.55 4.91
Pitch + 2MP 2.25 3.91 5.53 6.94 8.74 5.47
Pitch + 3MP 2.27 4.53 5.67 6.23 11.2 5.99
Pitch + 5MP 2.44 4.52 5.85 6.00 12.0 6.16
Pitch + 10MP 2.11 4.21 6.85 4.13 12.7 5.99
Table 4: The fisher scores for tone discrimination using FrFT-MFCC. Orders are set according to N times of pitch rate, and then using
multiorder multiplication (Section 4.3).
aieouAverage
N = 1, 2 2.4 4.63 5.67 6.91 9 5.72
N
= 1,2, 3 2.36 5.41 5.71 6.17 11.6 6.25
N
= 1,2, , 5 2.46 5.01 5.86 5.96 12.4 6.34
N
= 1,2, , 10 2.13 4.08 6.83 4.1 12.5 5.93
The pitch + 5MP method can obtain good results on average
for all vowels except [a].
For the vowel [a], the FrFT-MFCC always performs
worse than MFCC. This is possibly because the first formant
of [a] is much higher than in the other vowels. A higher
formant needs a larger N,butalargerN will smear the
formant, so a good compromise can not be achieved.
The multiorder multiplication method with different
number of N’s can significantly increase the scores for vowels
[i] [e], and [o] and [u] compared with MFCC. These four
vowels achieve their best results with different numbers of
order multipliers. Here, they are 3, 10, 1 and 10, respectively.
The best average result of all is obtained using the multiorder
multiplication method with N
= 1, 2, ,5.
Compared with the pitch + MP method, the pitch +
2MP method improves the discriminability of FrFT-MFCC
for vowels [o], [u], but not for the other three vowels,
especially for [i]. The reason for this might be the frequencies
of the first two formants of [o] and [u] are low and close;
so a significant improvement can be obtained; but it’s the
opposite for [i], whose first formant is quite low and the
second formant is rather high. The smearing effect prevails
in the combination of the corresponding two orders. When
more “formants” are taken, such situation is somewhat
alleviated.
6. Consonant Challenge Speech
Recognition Experiments
6.1. Speech Corpus. The experiments were conducted on the
intervocalic consonants (VCV) provided by the Interspeech
2008 Consonant Challenge [42]. Twelve female and 12 male
native English talkers produced each of the 24 consonants
(/b/,/d/,/g/,/p/,/t/,/k/,/s/,/sh/,/f/,/v/,/th/,/dh/,/ch/,/z/,
/zh/, /h/, /dz/, /m/, /n/, /ng/, /w/, /r/, /y/, /l/) in nine vowel
contexts consisting of all possible combinations of the three
vowels /i:/, /u:/, and /ae/. The VCV signals are sampled at
25 kHz, with 16 bit quantization.
The training material comes from 8 male and 8 female
speakers and consists of 6664 clean tokens, after remov-
ing unusable tokens identified during postprocessing. The
tokens from the remaining 8 speakers are provided in 7 test
sets employing different types of noise. We combined all test
sets as one large test set of clean tokens. For this, the clean
speech signals were extracted from the two-channel material
that contains speech in one channel and noise in the other
channel. Each of the 7 test sets contains 16 instances of each
of the 24 consonants, giving a total of 2688 tokens in the
combined test set.
6.2. Experiment Design. The baseline system is the same as in
the Consonant Challenge. Speech is analyzed using a frame
length of 25 milliseconds and a frame shift of 10 milliseconds.
The speech is parameterized with 12 MFCC coefficients
plus the log energy and is augmented with first and second
temporal derivatives, resulting in a 39-dimensional feature
vector. Each of the monophones used for HMM-decoding
consists of 3 emitting states with a 24-Gaussian mixture
output distribution. No silence model and short pause model
are employed in this distribution as signals are end-pointed.
The HMMs were trained from a flat start using HTK [43].
Cepstral mean normalisation (CMS) is used [44]. The same
parameters and configurations as described above are used
to test FrFT-MFCC. The transform orders of FrFT are
adaptively set for each frame using the methods proposed in
Section 4.
6.3. Experimental Results. The recognition results are given
in Tables 5
∼7. Ta ble 8 gives the consonant-specific results. It
depicts the error rates for individual consonants using MFCC
and the absolute error rate drop over MFCC using FrFT-
MFCC with different order adaptation methods. To give a
more intuitive observation, Figure 6 draws the histograms
according to Tab le 8 .
Ta bl e 5 shows that the FrFT-MFCC with N
= 1, 2, 3, 5
all outperform traditional MFCC. The best result is obtained
10 EURASIP Journal on Audio, Speech, and Music Processing
Table 5: Consonant correct rates (%). Orders are set according to
N timesofpitchrateforFrFT-MFCC.
MFCC N = 1 N = 2 N = 3 N = 5
84.71 85.34 85.6 84.93 84.90
Table 6: Consonant correct rates (%). Orders are set according to
the pitch and main peaks of the LPC spectrum.
MFCC Pitch + MP Pitch + 2MP Pitch + 3MP Pitch + 5MP
84.71 84.82 85.10 85.27 84.78
Table 7: Consonant correct rates (%). Orders are set according to
N times of pitch rate, and then using multiorder multiplication.
MFCC N = 1, 2 N = 1,2, 3 N = 1, 2, ,5 N = 1, 2, ,10
84.71 85.27 85.01 85.45 84.93
when N = 2. When N gets larger, the formants may be
dispersed because the chirp rates of formants are generally
lower than N times the pitch rate. N
= 2canobtain
a good compromise between tracking the dynamic speech
harmonics and preserving the concentration of the formants.
Ta bl e 6 shows that the best result is obtained when
using “pitch + 3MP”, which means that there is also an
optimal x in the “pitch + xMP” method. Unlike the results
for tonal vowel discrimination test, the pitch + “formants”
method does not obtain better results than the method only
based on the pitch. This might be due to the decreased
distance across vowels when using this method: although the
“pitch + xMP” method significantly increases the distances
between different tones with the same vowel compared to
the “multiple of pitch rate” method (see Tables 2 and 3),
the distances between differentvowelswiththesametone
probably decrease more (see Tables 10 and 11). Thus, a
compromise has to be made between tracking the fast and
slowly changing components in speech signals, respectively.
From Tab l e 7, we can see that the best results using
multiorder multiplication method are obtained with N
=
1, 2, ,5. This coincides with the result of the tonal vowel
discrimination test (Table 4). Nevertheless, note that the
multiorder multiplication method shows higher computa-
tional load than the other techniques. Although the FrFT
is calculated with a fast discrete algorithm which can be
implemented by FFT, it has to be calculated several times
using different orders.
Ta bl e 8 shows that when using MFCC features, the
dental fricatives, /dh,th/, and the labiodentals fricatives /f,v/
encounter most errors, just like in human listening tests,
where these sounds were responsible for a large number
of production errors. The error rates for /g/ and /zh/ also
exceed 20%. The consonants /p,b/, /w/, /k/ encounter least
errors. Different consonants achieve their peak performance
using different order adaptation methods and with different
parameters. /l/ and /z/ achieve their lowest error rates using
MFCC. /d/, /n/, /ng/, /sh/, /w/, /p/ achieve their lowest error
rates using the “multiple of pitch rate” method with N
= 2
or 3, while /v/, /g/, /m/, /k/ achieve their lowest error rates
with N
= 1, and /h/ and /y/ with N = 5. /dh/, /th/ achieve
their lowest error rates using the “pitch + MP” method and
/f/, /zh/, and /ch/ using the “pitch + xMP” (x>1) method.
/dj/, /s/, /h/, /t/, /r/, /b/, /k/, /p/ achieve their lowest error
rates using the “multiorder multiplication method.” Com-
pared with MFCC, the improvements on the most error-
prone consonants /dh/, /f,v/ are also most significant when
using FrFT-MFCC. The largest improvements appear on
consonants /dh/, /f/, /zh/, and /v/, which are 10.71%, 9.82%,
7.14% and 6.25%, respectively. Besides these consonants, /t/,
/ch/, and /sh/ achieve lower error rates by using almost all
the adaptation methods. Contrarily, most of the adaptation
methods do not have any positive effect on the consonants
/d/, /h/, /ng/, /r/, /l/, /z/, and /p/.
7. Discussion and Conclusions
The specific novelty of this work is that we have proposed
several order adaptation methods for FrFT in speech signal
analysis and recognition which are based on the pitch and
the formants (or just envelope peaks) of voiced speech.
These order selection methods are specifically proposed
according to the characteristics of speech, and their merits
are indicated by FFT and FrFT based spectrograms of an
artificially-generated vowel. The order selection methods
are adopted in the calculation of the FrFT-MFCC features,
and then used in a tonal vowel discrimination test and in
a speech recognition experiment. It is shown that FrFT-
MFCC features can greatly increase the discrimination of
tones compared to FFT-based MFCC features and that the
discrimination of Mandarin vowels and English intervocalic
consonants is slightly increased.
It is well known that the FFT-based MFCC, and almost
all other features conventionally used for speech recognition,
discard pitch information and can not track the fast-
changing events in speech signals. It can be assumed that
this lack of short-term temporal information may lead to
problems for the recognition of quickly changing events such
as plosives. Moreover, formant transitions, a key aspect in
the perception of speech, are also only covered indirectly by
the MFCCs [3]. The assumption that the FrFT might better
track temporal features is verified by the tonal vowel discrim-
ination test and the speech recognition experiments, which
show that considering the change of pitch and harmonics is
not always harmful in the discriminability of speech features.
However, it was also shown that the information on gross
spectral peaks (formants) might be increasingly smeared
when using high-resolution FrFT analysis.
On the other hand, the FrFT is a kind of linear
transform and thus does not have the problem of cross-term
interference known from other high-resolution transforms
such as the Wigner-Ville distribution. Nevertheless, speech
signals show a very complex spectrotemporal dynamics, and
thus cannot be simply decomposed into several independent
components using the FrFT or similar methods. When the
analysis emphasizes one component in a certain fraction
domain, it will bring dispersion effect to some other com-
ponents, so a compromise has to be made when determining
EURASIP Journal on Audio, Speech, and Music Processing 11
Table 8: Consonant-specific results: error rates and absolute improvements for each consonant (%).
Error rate
Absolute error rate improvement with respect to MFCC by using FrFT-MFCC
MFCC N = 1 N = 2 N = 3 N = 5
Pitch +
MP
Pitch +
2MP
Pitch +
3MP
Pitch +
5MP
N
=
1, 2
N
=
1, 2,3
N
=
1, 2, ,5
N
=
1, 2, ,10
b
6.25
−0.89 −1.79 0.89 0.89 −1.79 −0.89 0.89 0.89 0.89 3.57 0.89 0.89
ch
8.93 0.89 2.68 0.89 3.57 4.46 0.00 1.79 5.36 0.00 0.89 3.57 1.79
d
16.07
−3.57 1.79 −7.14 −2.68 −3.57 −0.89 0.00 −1.79 −0.89 −3.57 −0.89 −1.79
dh
55.36 6.25 7.14 8.04 6.25 10.71 3.57 8.04 6.25 6.25 4.46 8.04 1.79
dj
16.07 0.89 0.00
−0.89 0.00 −1.79 −4.46 0.89 −0.89 1.79 −0.89 −0.89 0.89
f
25.00 0.89 7.14 0.89 3.57 8.04 9.82 8.93 2.68
−0.89 1.79 5.36 2.68
g
22.32 2.68 1.79 0.00
−1.79 −8.93 0.89 0.89 −4.46 1.79 0.00 1.79 −4.46
h
12.50
−0.89 −0.89 −0.89 0.89 −2.68 −2.68 0.00 −2.68 0.00 −1.79 −4.46 0.89
k
6.25 1.79
−0.89 −1.79 0.00 −1.79 −0.89 −1.79 0.89 1.79 −1.79 1.79 0.00
l
8.93
−2.68 0.00 −0.89 −0.89 −0.89 −1.79 −4.46 0.00 −1.79 −5.36 −1.79 −3.57
m
13.39 2.68
−1.79 −4.46 −1.79 −0.89 1.79 −1.79 −0.89 −0.89 −2.68 −1.79 0.00
n
12.50 0.00 2.68 5.36 0.89 2.68
−0.89 −0.89 −4.46 −3.57 0.89 −3.57 −9.82
ng
12.50
−0.89 0.89 −1.79 −0.89 −4.46 −2.68 −2.68 −2.68 −1.79 0.00 −2.68 −0.89
p
3.57
−0.89 −0.89 0.89 0.00 −1.79 −1.79 −2.68 −0.89 0.89 0.00 0.00 −0.89
r
9.82
−1.79 −0.89 −4.46 −4.46 −0.89 −1.79 0.00 −2.68 0.00 1.79 0.89 −0.89
s
14.29
−0.89 −0.89 0.89 −2.68 −3.57 0.89 2.68 2.68 4.46 1.79 −0.89 2.68
sh
8.04 1.79 5.36 2.68 2.68 3.57 4.46 4.46 3.57 4.46 1.79 4.46 3.57
t
10.71 2.68 3.57 4.46 1.79 1.79 1.79 0.00 1.79 2.68 1.79 7.14 4.46
th
30.36 0.89
−2.68 0.89 −2.68 2.68 0.00 1.79 0.00 −7.14 −0.89 0.00 0.00
v
33.04 6.25 0.00 2.68 0.00 2.68 2.68
−0.89 −4.46 2.68 0.00 0.89 3.57
w
4.46 1.79 2.68 0.00 0.89 1.79 0.89 1.79 1.79 1.79 0.00
−1.79 1.79
y
7.14
−0.89 −1.79 0.00 1.79 −0.89 −3.57 −0.89 −2.68 0.00 0.00 0.89 0.89
z
8.93
−3.57 −2.68 −3.57 −3.57 −3.57 −1.79 −3.57 −2.68 −2.68 0.00 −0.89 −1.79
zh
20.54 2.68 0.89 2.68 2.68 1.79 3.57 0.89 7.14 3.57 5.36 1.79 3.57
Table 9: Fisher scores for vowel discrimination using MFCC
separatelyforeverytone(1,2,3,4)andthescoreacrossalltones
(The Fisher score across all tones is not equal to the average score
over the four tones. Generally this score is smaller than the average
value).
12 3 4All
MFCC 8.31 13.88 16.50 12.30 12.20
Table 10: Fisher scores for vowel discrimination using FrFT-
MFCC. Orders are set according to N times of pitch rate.
12 3 4All
N = 1 8.97 14.57 18.07 12.88 13.14
N
= 2 8.73 14.31 17.94 12.77 12.91
N
= 3 8.57 14.10 17.74 12.67 12.73
N
= 5 8.38 13.85 17.26 12.42 12.44
the transform order. In the proposed order selection meth-
ods, it seems that an optimal value always exists to achieve the
compromise between tracking the dynamic characteristics of
the speech harmonics and avoiding severe smearing of the
formants.
Table 11: Fisher scores for vowel discrimination using FrFT-
MFCC. Orders are set according to pitch and “formants.” MP
denotes the main peaks of the LPC spectrum, and Pitch + xMP
refers to the technique presented in Section 4.2. when x>1, the
transforms are multiplied as explained in Section 4.3 (right panel in
Figure 5(b)).
12 3 4All
Pitch + MP 8.45 13.97 17.07 12.66 12.51
Pitch + 2MP 9.78 14.63 18.00 12.03 13.31
Pitch + 3MP 9.32 13.77 13.56 10.18 11.70
Pitch + 5MP 7.58 11.39 9.27 8.00 9.03
Table 12: Fisher scores for vowel discrimination using FrFT-
MFCC. Orders are set according to N times of pitch rate, and then
using multiorder multiplication (Section 4.3).
1234All
N = 1, 2 10.37 15.15 19.11 12.68 14.03
N
= 1,2, 3 9.57 13.93 14.37 10.86 12.18
N
= 1,2, , 5 7.74 11.42 9.73 8.61 9.34
N
= 1,2, , 10 4.77 8.20 6.08 5.83 6.09
12 EURASIP Journal on Audio, Speech, and Music Processing
The major difference between the proposed methods
based on the FrFT and the related Fan-Chirp transform
is that the Fan-chirp transform considers all harmonics at
the same time, whereas our approach selects only a subset,
for example, those who are close to the formants or a
specific set of harmonic numbers. In both cases formants get
smeared similarly. As to whether the proposed methods can
lead to fundamentally different results from the Fan-Chirp
transform is unclear, and this needs more experiments and
detailed analysis. However, it could be beneficial to combine
our multiorder methods with the Fan-Chirp transform.
From the experimental results, it seems that FrFT-
MFCC might be better for vowels if using multiorder
methods. However, smearing the formants in a single order
method does not seem to be very harmful. Considering the
effectiveness of the FFT analysis on formant determination
and that of the FrFT analysis on emphasizing harmonics,
one possible further approach might be to combine FFT-
and FrFT-based MFCCs to get an improved representation
of speech features for speech analysis and recognition.
Another interesting conclusion is that the proposed
methods are not only useful for tonal language processing,
but may also be useful for nontonal languages. It is
reasonable that tonal languages can benefit from the FrFT-
MFCC features with the proposed order adaptation methods,
because different tone patterns have different pitch evolving
trace, and the proposed method can track these dynamic
characteristics of speech. For the toneless languages, the
quickly changing events in speech can also benefit from this
merit, leading to a somewhat improved speech recognition
rate. Actually, the presented FrFT-MFCC features use the
initial pitch estimates for all signal segments including con-
sonants that do not have a prominent pitch. This fact might
suggest that consonant recognition could degrade, because
essentially invalid initial pitch estimates are used for some
of the consonants. However, contrary to the expectation,
in our test with English intervocalic consonants a slight,
although not statistically significant, performance increase
was measured. Overall, FrFT-MFCC seems to outperform
the FFT-MFCC-baseline, because consonant recognition is
not decreased and tone and vowel discriminability are
increased.
The proposed order adaptation methods are based on
initial short-time pitch, pitch rate and formant estimates
which are derived directly from the signal. It’s well-known
that using the perfect a-priori knowledge of the pitch
can improve the performance of tone discrimination and
speech recognition [45]. However, the proposed methods
can achieve better performance even with nonperfect pitch
and formant estimation, which is shown by the fact that,
although the improvement of the consonant recognition is
not so statistically significant, it at least does not decrease
despite using essentially invalid initial pitch estimates. This
also indicates that the FrFT-MFCC features might degrade
more gracefully with increasing noise level than the initial
estimates of pitch and formants that are used to derive them.
Furthermore, FrFT-MFCC is shown to improve tone and
vowel discrimination compared to FFT-MFCC even though
pitch harmonics are blended by the mel-frequency filterbank
and formants are partially smeared as a consequence of the
FrFT analysis. This forms one of the major outcomes of
the study and indicates that the benefit of the FrFT-MFCC
does not just result from the fact that initial pitch estimates
are used. FrFT-MFCC features seem to provide a better
combination of pitch and formant-related information than
FFT-MFCC and this might be beneficial for ASR.
The clear disadvantage of the order selection methods
determined by pitch and formants is that they rely greatly
on the accuracy of pitch and formants determination, which
is a tough problem in noisy environments. However, all
model-based methods that consider AM-FM models have
the problem that parameter adaptation is deteriorated by
noise. In this paper, we wanted to show the potential of the
proposed FrFT-based analysis method and demonstrate its
benefit at high signal-to-noise ratios (SNRs). Since the results
are encouraging, it is worth to look for noise-robust methods
of deriving pitch and formants, and then to investigate the
proposed methods in noisy conditions. This goes beyond the
scope of this study and will be part of future work.
Acknowledgments
This research was partially supported by the Spanish project
SAPIRE (TEC2007-65470) as well as a research grant to
V. Hohmann from the Spanish Ministry of Education and
Science, and partially supported by the National Nature
Science Foundation of China under Grant NSFC 60605015.
Parts of this work have been presented at the V Jornadas en
Te c n o l o g
´
ıa del Habla, JTH 2008, Bilbao, Spain, and also at
the 6th International Symposium on Chinese Spoken Language
Processing, ISCSLP ’08, Kunming, China.
References
[1] H. M. Teager and S. M. Teager, Evidence for nonlinear sound
production mechanisms in the vocal t ract,NATOAdvanced
Study Institute on Speech Production and Speech Modelling,
Bonas, France, 1989.
[2] P. Maragos, J. F. Kaiser, and T. F. Quatieri, “On amplitude
and frequency demodulation using energy operators,” IEEE
Transactions on Signal Processing, vol. 41, no. 4, pp. 1532–1550,
1993.
[3] M. Heckmann, “Call for papers, Special issue of Speech Com-
munication on auditory inspired spectro temporal features,”
2008.
[4] M. K
´
epesi and L. Weruaga, “High-resolution noise-robust
spectral-based pitch estimation,” in Proceedings of the 9th
European Conference on Speech Communication and Tech-
nology (INTERSPEECH ’05), pp. 313–316, Lisbon, Portugal,
2005.
[5] D.Dimitriadis,P.Maragos,andA.Potamianos,“RobustAM-
FM features for speech recognition,” IEEE Signal Processing
Letters, vol. 12, no. 9, pp. 621–624, 2005.
[6] P. Tsiakoulis and A. Potamianos, “Statistical analysis of
amplitude modulation in speech signals using an AM-FM
model,” in Proceedings of IEEE International Conference on
Acoustics, Speech and Signal Processing (ICASSP ’09), pp. 3981–
3984, Taibei, China, 2009.
EURASIP Journal on Audio, Speech, and Music Processing 13
[7] S. Gazor and R. Rashidi Far, “Adaptive maximum windowed
likelihood multicomponent AM-FM signal decomposition,”
IEEE Transactions on Audio, Speech and Language Processing,
vol. 14, no. 2, pp. 479–491, 2006.
[8] Y. Kubo, A. Kurematsu, K. Shirai, and S. Okawa, “Noisy
speech recognition using temporal AM-FM combination,”
in Proceedings of IEEE International Conference on Acoustics,
Speech, and Signal Processing (ICASSP ’08), pp. 4709–4712, Las
Vegas, Nev, USA, March-April 2008.
[9] R. R. Far and S. Gazor, “AM-FM decomposition of speech
signal using MWL criterion,” in Proceedings of Canadian
Conference on Electrical and Computer Engineering, vol. 3, pp.
1769–1772, 2004.
[10] F. Gianfelici, G. Biagetti, P. Crippa, and C. Turchetti, “Multi-
component AM-FM representations: an asymptotically exact
approach,” IEEE Transactions on Audio, Speech, and Language
Processing, vol. 15, no. 3, pp. 823–837, 2007.
[11] M. Betser, P. Collen, G. Richard, and B. David, “Estimation
of frequency for AM/FM models using the phase vocoder
framework,” IEEE Transactions on Signal Processing, vol. 56,
no. 2, pp. 505–517, 2008.
[12] T. Ezzat, J. Bouvrie, and T. Poggio, “AM-FM demodulation
of spectrograms using localized 2D max-gabor analysis,” in
Proceedings of IEEE International Conference on Acoustics,
Speech and Signal Processing (ICASSP ’07), vol. 4, pp. 1061–
1064, Honolulu, Hawaii, USA, 2007.
[13] S. C. Sekhar and T. V. Sreenivas, “Novel approach to AM-
FM decomposition with applications to speech and music
analysis,” in Proceedings of IEEE International Conference on
Acoustics, Speech, and Signal Processing (ICASSP ’04), vol. 2,
pp. 753–756, Montreal, Canada, 2004.
[14] V. Namias, “The fractional order Fourier transform and its
application to quantum mechanics,” IMA Journal of Applied
Mathematics, vol. 25, no. 3, pp. 241–265, 1980.
[15] L. B. Almeida, “The fractional fourier transform and time-
frequency representations,” IEEE Transactions on Signal Pro-
cessing, vol. 42, no. 11, pp. 3084–3091, 1994.
[16] L. Qi, R. Tao, S. Zhou, and Y. Wang, “Detection and parameter
estimation of multicomponent LFM signal based on the
fractional Fourier transform,” Science in China, Series F, vol.
47, no. 2, pp. 184–198, 2004.
[17] D. Dimitriadis, P. Maragos, V. Pitsikalis, and A. Potamianos,
“Modulation and chaotic acoustic features for speech recogni-
tion,” Control and Intelligent Systems, vol. 30, no. 1, pp. 19–26,
2002.
[18] B. Mondal and T. V. Sreenivas, “Mixture Gaussian envelope
chirp model for speech and audio,” in Proceedings IEEE
International Conference on Acoustics, Speech, and Signal
Processing (ICASSP ’01), vol. 2, pp. 857–860, Salt Lake City,
Utah, USA, May 2001.
[19] Y. Huang and R. D. Dony, “Speech modelling by non-
stationary partials with time varying amplitude and fre-
quency,” in Proceedings of Canadian Conference on Electrical
and Computer Engineering, vol. 3, pp. 1273–1276, Niagara
Falls, Canada, May 2004.
[20] P. L. Ainsleigh and N. Kehtarnavaz, “Characterization of
transient wandering tones by dynamic modeling of fractional-
Fourier features,” in Proceedings of IEEE International Confer-
ence on Acoustics, Speech, and Signal Processing (ICASSP ’00),
vol. 2, pp. 665–668, Istanbul, Turkey, 2000.
[21] R. Dunn and T. F. Quatieri, “Sinewave analysis/synthesis based
on the Fan-Chirp tranform,” in Proceedings of IEEE Workshop
on Applications of Signal Processing to Audio and Acoustics
(WASPAA ’07), pp. 247–250, New Paltz, NY, USA, October
2007.
[22] M. K
´
epesi and L. Weruaga, “Adaptive chirp-based time-
frequency analysis of speech signals,” Speech Communication,
vol. 48, no. 5, pp. 474–492, 2006.
[23] L. Weruaga and M. K
´
epesi, “Self-organizing chirp-sensitive
artificial auditory cortical model,” in
Proceedings of the 9th
European Conference on Speech Communication and Technol-
ogy, pp. 705–708, Lisbon, Portugal, 2005.
[24] E. Mercado III, C. E. Myers, and M. A. Gluck, “Modeling audi-
tory cortical processing as an adaptive chirplet transform,”
Neurocomputing, vol. 32-33, pp. 913–919, 2000.
[25] D. L. Jones and T. W. Parks, “A high resolution data-
adaptive time-frequency representation,” IEEE Transactions on
Acoustics, Speech, and Signal Processing, vol. 38, no. 12, pp.
2127–2135, 1990.
[26] J. G. Vargas-Rubio and B. Santhanam, “An improved spectro-
gram using the multiangle centered discrete fractional fourier
transform,” in Proceedings of IEEE International Conference on
Acoustics, Speech, and Signal Processing (ICASSP ’05), vol. 4,
pp. 505–508, Philadelphia, Pa, USA, 2005.
[27] F. Zhang, Y. Q. Chen, and G. Bi, “Adaptive harmonic fractional
Fourier transform,” in Proceedings of IEEE International
Symposium on Circuits and Systems, vol. 5, pp. 45–48, Geneva,
Switzerland, May 2000.
[28] L. Weruaga and M. K
´
epesi, “Speech analysis with the fast
chirp transform,” in Proceedings of the 12th European Signal
Processing Conference (EUSIPCO ’04), pp. 1011–1014, Vienna,
Austria, September 2004.
[29] R.J.SluijterandA.J.E.M.Janssen,“Atimewarperforspeech
signals,” in Proceedings of IEEE Workshop on Speech Coding
Proceedings, pp. 150–152, Porvoo, Finland, 1999.
[30] M. A. Ramalho and R. J. Mammone, “New speech enhance-
ment techniques using the pitch mode modulation model,”
in Proceedings of the 36th Midwest Symposium on Circuits and
Systems, vol. 2, pp. 1531–1534, Detroit, Mich, USA, August
1993.
[31] Z. Wang and X. Zhang, “On the application of fractional
Fourier transform for enhancing noisy speech,” in Proceedings
of IEEE International Symposium on Microwave, Antenna,
Propagation and EMC Technologies for Wireless Communica-
tions (MAPE ’05), vol. 1, pp. 289–292, Beijing, China, August
2005.
[32] R. Sarikaya, Y. Gao, and G. Saon, “Fractional Fourier
transform features for speech recognition,” in Proceedings
of IEEE International Conference on Acoustics, Speech, and
Signal Processing (ICASSP ’04), vol. 1, pp. 529–532, Montreal,
Canada, 2004.
[33] W. Jinfang and W. Jinbao, “Speaker recognition using features
derived from fractional fourier transform,” in Proceedings of
the 4th IEEE Workshop on Automatic Identification Advanced
Technologies (AUTO ’05), pp. 95–100, New York, NY, USA,
October 2005.
[34] P. Zhao, Z. Zhang, and X. Wu, “Monaural speech separation
based on multi-scale Fan-Chirp Transform,” in Proceedings of
IEEE International Conference on Acoustics, Speech, and Signal
Processing (ICASSP ’08), pp. 161–164, Las Vegas, Nev, USA,
March-April 2008.
[35] T. Alieva and M. J. Bastiaans, “On fractional Fourier transform
moments,” IEEE Signal Processing Letters, vol. 7, no. 11, pp.
320–323, 2000.
[36] R. Tao, B. Deng, and Y. Wang, “Research progress of the
fractional Fourier transform in signal processing,” Science in
China, Series F, vol. 49, no. 1, pp. 1–25, 2006.
14 EURASIP Journal on Audio, Speech, and Music Processing
[37] S. Barbarossa, “Analysis of multicomponent LFM signals by
a combined Wigner-Hough transform,” IEEE Transactions on
Signal Processing, vol. 43, no. 6, pp. 1511–1515, 1995.
[38]X.H.Zhao,R.Tao,S.Y.Zhou,andY.Wang,“Chirpsignal
detection and multiple parameter estimation using Radon-
ambiguity and fractional Fourier transform,” Transactions of
Beijing Institute of Technology, vol. 23, no. 3, pp. 371–377,
2003.
[39] Y. R. Chao, Ed., A Grammar of Spoken Chinese, University of
California Press, Berkeley, Calif, USA, 1968.
[40] H. Yin, X. Xie, and J. M. Kuang, “Adaptive-order fractional
Fourier transform features for speech recognition,” in Proceed-
ings of the 9th Annual Conference of the International Speech
Communication Association (INTERSPEECH ’08), Brisbane,
Australia, September 2008.
[41] D. Talkin, “A robust algorithm for pitch tracking (RAPT),” in
Speech Coding & Synthesis, W. B. Kleijn and K. K. Paliwal, Eds.,
Elsevier, Amsterdam, The Netherlands, 1995.
[42] The website of consonant challenge in Interspeech, 2008,
/>IS08/material.html.
[43] Hidden Markov Model Toolkit (HTK), 2008, http://htk
.eng.cam.ac.uk/.
[44] M. Cooke and O. Scharenborg, “The interspeech 2008 conso-
nant challenge,” in Proceedings of the 9th Annual Conference of
the International Speech Communication Association (INTER-
SPEECH ’08), Brisbane, Australia, 2008.
[45] J L. Zhou, Y. Tian, Y. Shi, C. Huang, and E. Chang, “Tone
articulation modeling for Mandarin spontaneous speech
recognition,” in Proceedings of IEEE International Conference
on Acoustics, Speech, and Signal Processing (ICASSP ’04) , vol.
1, pp. 997–1000, Montreal, Canada, May 2004.