báo cáo hóa học:" Research Article Resistivity Probability Tomography Imaging at the Castle of Zena, Italy" pdf
Bạn đang xem bản rút gọn của tài liệu. Xem và tải ngay bản đầy đủ của tài liệu tại đây (6.25 MB, 9 trang )
Hindawi Publishing Corporation
EURASIP Journal on Image and Video Processing
Volume 2009, Article ID 693274, 9 pages
doi:10.1155/2009/693274
Research Article
Resistivit y Probability Tomography Imaging at
the Castle of Zena, Italy
Vincenzo Compare,
1
Marilena Cozzolino,
1
Paolo Mauriello,
1
andDomenicoPatella
2
1
Department of Science and Technology for Environment and Territory, University of Molise, Via Mazzini 8,
86170 Isernia, Italy
2
Department of Physical Sciences, University Federico II, University Campus of Mt. S. Angelo,
80126 Naples, Italy
Correspondence should be addressed to Domenico Patella,
Received 27 January 2009; Revised 25 June 2009; Accepted 8 October 2009
Recommended by Anna Tonazzini
We present the results of an electrical resistivity investigation performed at Castle of Zena (Castello di Zena), a 13th-century
fortress located between the towns of Fiorenzuola and Piacenza in the Emilia Romagna Region (Northern Italy), in the frame of a
project of restoration. Dipole-dipole resistivity tomographies were planned in three areas suspected of containing buried archaeo-
architectural remnants. Data analysis has been made using a 3D tomography imaging approach based on the concept of occurrence
probability of anomaly sources in the electrical resistivity distribution. The 3D tomography has allowed three interesting anomaly
source areas to be identified in the 1-2 m depth range below ground level. Subsequent excavations have brought to light a giacciara,
that is, a brickwork room for food maintenance, a furnace, and the basement of a wing of the castle destroyed in the 18th century,
exactly in correspondence with the anomaly sources detected by the resistivity tomography.
Copyright © 2009 Vincenzo Compare et al. This is an open access article distributed under the Creative Commons Attribution
License, which permits unrestricted use, distribution, and reproduction in any medium, provided the original work is properly
cited.
1. Introduction
Geoelectrics is one of the most reliable prospecting tools in
the field of Cultural Heritage, thanks to the technological
and methodological developments in recent years, which
have made it a fast target-oriented method. The electrical
resistivity parameter, on which the method is based, has
such a large variability so as to allow the great majority of
the structures and bodies of archaeologic and architectural
interest to be readily distinguished, in principle, from the
hosting material. To enhance the resolution power of the
method, a great help is provided by the recently developed
electrical resistivity tomography (ERT) approach, which
involves the acquisition and processing of large datasets.
This paper presents the results of an ERT survey,
carried out about the Castle of Zena (Castello di Zena)
(Figure 1), which is a fortress located near the village of
Carpaneto Piacentino, in the lowland between the towns of
Fiorenzuola and Piacenza (Emilia Romagna Region, Italy).
The foundation date of the Castle of Zena are still unknown,
though the first document attesting its presence dates back to
1216. The whole complex, despite the several repairs which it
has been subject to in past ages, still preserves the ancient
character of a fortress of square plan, as documented in the
drawing of Figure 2, dating back to 1701 and based on a
land map of 1591. The southern wing of the building, that
is, the right-hand side of the map in Figure 2, is attested to
have been demolished in the 18th century, thus leaving the
courtyard of the castle partially exposed, as visible in the top
picture of Figure 1. On the western front, where the entry is
situated, the traces of a drawbridge, replaced afterwards by
a bridge in masonry, and the ditch that surrounds the castle
are visible in the lower picture of Figure 1.
The ERT survey was planned in the framework of the
SOCRATES project, sponsored by institutional subjects and
finalised to the study and preservation of the castle and
surrounding areas. The ERT survey was addressed to study
the nature of the subsoil in three different zones, which
the historians involved in the project suspected to contain
remnants of great archaeo-architectural interest.
2 EURASIP Journal on Image and Video Processing
(a)
(b)
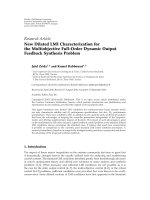
Figure 1: The Castle of Zena, Carpaneto Piacentino (Emilia
Romagna, Italy). Views from the southern (a) and western (b) sides.
2. Outline of the Geoelectrical Method
The solution for the electrical potential arising from an
electrical current flowing into the ground from a point
source of current (a grounded electrode) is the starting
theoretical point for the resistivity prospecting method. In
practice, there is always a device of four electrodes used to
measure the ground resistivity: two are used for injecting
a current of intensity I and two for detecting a voltage
(potential difference) Δφ.
For all of the devices the theoretical solution is basically a
superposition of the fundamental equations for the potential
from a current point source with appropriate sign for the
current. The formulae for evaluating the resistivity of the
ground are a product of the impedance Δφ/I and a geometric
factor with the units of length which depends on the
geometry of the four electrodes. However, as the resistivity
is an intrinsic property of a homogeneous material and
the subsoil is generally a complex distribution of different
materialswithdifferent resistivities, the key concept of
apparent resistivity, ρ
a
, is defined. In simple terms, ρ
a
is a
volumetric average of a heterogeneous half-space, except that
the averaging is not done arithmetically but by a complex
weighting function dependent on the 4-electrode device and
how it is used.
In near-surface investigations, as in the archaeological
prospection, the dipole-dipole (DD) (Figure 3) is the most
convenient 4-electrode device, since it provides a very
(a) (b)
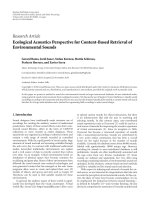
Figure 2: An archive document from Piacenza dating back to
1701, showing a drawing of the Castle of Zena based on land
measurements of 1591.
Δ
I
aa
NM
ka
AB
Figure 3: A sketch of the dipole-dipole electrode device for
geoelectrical prospecting. A (positive) and B (negative) are the
current electrodes to inject a current of intensity I into the ground.
M and N are the potential electrodes to measure the voltage Δφ.The
dipole length is a and k
= 1, 2, determines the spacing between
the dipoles as an integer multiple of a.
Zone B
Line B9
Zone C
Line C10
Line A20
Zone A
N
050
(m)
Figure 4: A sketched map of the Castle of Zena (C-shaped central
light blue area) and the three ERT A, B, and C survey zones (grey
areas). The red lines A20, B9, and C10 are the profiles selected to
show examples of the nature of the input data in the form of 2D
pseudosections.
EURASIP Journal on Image and Video Processing 3
Figure 5: A-zone: cropmarks in correspondence with the giacciara
indicated in the map of Figure 2.
0.811.21.41.61.8
Log apparent resistivity (Ωm)
0 5 10 15 20 25 30
Distance (m)
−2
−4
Pseudodepth
(m)
Figure 6: The apparent resistivity pseudosection across the line A20
in the A-zone (red line in Figure 4).
detailed lateral bounding of vertical features. The DD device
is normally used in profiling mode to map lateral as well as
depth variations of the resistivity. The convention for the DD
device shown in Figure 3 is that current and voltage dipole
lengths are the same, a, and the spacing between the dipoles
is an integer multiple k of a. The DD apparent resistivity is
thus given by
ρ
a
= πak
(
k +1
)(
k +2
)
Δφ
I
,(1)
and its values are expressed in Ohm·meters (Ωm) in the SI
system of units.
To investigate the resistivity distribution along a profile,
a
{ρ
a
} dataset is collected from a linear array of dipoles
coupled to a transmitter/receiver unit through a series of
solid state relays. Measurements are realised from predefined
arrays of dipoles selected by the relays.
The plotting convention is to attribute the values of ρ
a
at the intersection point of two 45
◦
lines descending from
the current dipole and from the voltage dipole. The resulting
maps of
{ρ
a
}are contoured at constant (usually logarithmic)
intervals. The contoured sections are called pseudosections
because they look somewhat like resistivity cross-sections
of the ground, but actually they are simply a graphical
representation of the
{ρ
a
} dataset. The vertical scale is not
depth but some function of the array spacing. For simplest
geological models the relative pseudosections do have an
intuitive relationship to the actual section but mostly they do
0.811.21.41.61.8
Log apparent resistivity (Ωm)
0 5 10 15 20 25
Distance (m)
−5
−3
−1
Pseudodepth
(m)
Figure 7: The apparent resistivity pseudosection across the line B9
in the B-zone (red line in Figure 4).
0.81.11.41.722.3
Log apparent resistivity (Ωm)
0 5 10 15 20 25 30
Distance (m)
−5
−3
−1
Pseudodepth
(m)
Figure 8: The apparent resistivity pseudosection across the line C10
in the C-zone (red line in Figure 4).
not. For a layered earth the contour lines are horizontal and
rise and fall in value in the same sense as the actual resistivity,
but for the case of even a single vertical contact between
dissimilar resistivities the pseudosection is a complex map
with no direct relationship to the actual model.
A numerical inversion is used to convert measured
apparent resistivity distributed along a pseudosection to
electrical resistivity values displayed as a function of depth
below surface.
The geoelectric resistivity tomography (ERT) approach
comes from taking many ρ
a
determinations at as many
locations as possible and involves the joint inversion of
many independent tests, using an algorithm to discern subtle
details from differences which would otherwise not be seen
in any one test. The inversion of a
{ρ
a
} dataset collected
by the described DD profiling field technique gives rise to
a two-dimensional (2D) DD ERT. If one assembles a set of
parallel DD profiles, as we did in the Castle of Zena survey,
the inversion of the whole
{ρ
a
} dataset provides a three-
dimensional (3D) DD ERT.
Resistivity inversion is a typical nonlinear, ill-posed, and
underdetermined problem [1–4]. Furthermore, mainly in 3D
cases, the number of the model parameters to be inverted is
so high that the large computer time required to solve the
problem makes the approach almost unpractical in routine
applications. An efficient way of dealing with 2D and 3D
inversion derives from a linearised form of the nonlinear
problem. One-step and iterative linear methods have been
proposed; see for example, [5–8]. The main advantage of
such methods is that they can greatly reduce the computer
time needed to generate an approximate model.
4 EURASIP Journal on Image and Video Processing
−0.5 −0.25 0 0.25 0.5
Resistivity anomaly occurrence probability
04080
Distance (m)
5
4
3
2
1
Depth (m)
0
20
40
60
80
Distance (m)
A
C
B
Figure 9: The 3D probability tomography in the three surveyed A,
B, and C zones of Figure 4, represented with sequences of horizontal
slices at increasing depth below the ground surface. The top slice is
the reference land map with the three survey zones and the sketched
plan of the castle.
Following the one-step linearised strategy, a probability-
based ERT method has also been developed in more recent
years as a simple and fast anomaly source imaging tool [9–
11]. It has been proven to be very useful in highlighting shape
and position of the most probable sources responsible of the
ρ
a
anomalies detected on the free surface. An outline of the
probability-based ERT method is given below, since it was
used to interpret the ERT survey performed in the Castle of
Zena area.
3. Outline of the Probability Tomography
The probability tomography method consists in the analysis
of an occurrence probability function ranging between
−1
and +1, defined as a normalised cross-correlation product
of the
{ρ
a
} dataset by a suitably digitised scanner function,
derived from the electric potential theory by a perturbation
technique under Born approximation [10].
In practice, since the source pattern generating the
observed anomalies is unknown, an elementary source of
10
20
30
40
50
60
N
30
20
10
−2
−4
(a)
110
115
120
125
N
20
25
30
35
−2
−4
(b)
85
90
95
80
N
5
10
15
20
25
30
−2
−4
−0.5 −0.25 0 0.25 0.5
Resistivity anomaly occurrence probability
Distances (meters)
(c)
Figure 10: 3D views of the probability-based ERT representation in
the A-zone (a), B-zone (b), and C-zone (c).
unitary strength is ideally used to scan the volume beneath
the surveyed area, called the tomospace, and search where
the sources are most probably located. From the analytical
point of view, this ideal process corresponds to calculating
the occurrence probability function in a grid of points in
the tomospace. A positive value of this function will give
the occurrence probability of an increase of resistivity with
respect to a reference resistivity value, whereas a negative
value will give the occurrence probability of a decrease
of resistivity. By scanning the tomospace, a full 3D image
reconstruction of the anomaly sources distribution can at last
be obtained in a probabilistic sense.
EURASIP Journal on Image and Video Processing 5
Zone B
S7
S5
S6
Zone C
S8
S10
S9
S4
S3
S2
S1
Zone A
N
050
(m)
−0.5 −0.25 0 0.25 0.5
Resistivity anomaly occurrence probability
Figure 11: Geoelectrical probability tomography at 1m of depth
b.g.l. and locations of the mechanical surveys S1-S10, indicated by
black circlets.
Figure 12: A-Zone: the giacciara or icebox found in correspondence
of the rounded sequence of nuclei in the probability tomography of
Figure 11.
A suitable reference resistivity can be either the true
background resistivity, if it is known, or simply the average
apparent resistivity, as we did in this study. At the end
of the scanning procedure, one can draw sections or,
more efficaciously, 3D images of the probability distribution
pattern in the tomospace.
Besides this primary scope of the method, worthy
of mention is a second, not less important peculiarity,
which makes the 3D probability tomography a versatile and
objective imaging approach. Since the algorithm can deal
even with multiple datasets, independently of the acquisition
technique, it also works as an intrinsic filter. The result is
a simultaneous smoothing of the uncorrelated noise and
suppression of any correlated phantom effects. In principle,
this peculiarity derives from the circumstance that such types
of disturbances have zero probability to be generated by
true anomaly sources within the context of the geoelectrical
theory.
Concluding, we think that it is useful to point out that
the probability-based ERT approach cannot give estimates of
the true resistivity contrasts which characterise the sources
of anomalies. Therefore, it appears to be more appropriate
in those circumstances in which the resistivity contrast of the
targets is either known in advance or relatively less relevant
than the discovery of their existence and retrieval of their
shape. This is usually the case in target-oriented applications
to archaeology. Otherwise, the method can be considered a
valuable support to the classical interpretation. Its results can
in fact be used as a priori robust geometrical constraints in
anyone of the inversion routines.
4. The Survey Planning
As previously anticipated, the ERT survey was carried out
by a direct current multielectrode resistivity meter, capable
of handling up to 254 electrodes. The DD electrode device
was adopted using 1 m long dipoles displaced at a step of 1 m
along each profile with k in (1) reaching the maximum value
of 10. The following three different zones (Figure 4)were
investigated.
Zone A: it is an area of 1674 m
2
, located close to the
northern side of the fortress, where a car park underground
had been planned. 37 parallel profiles, 31 m long and spaced
1.5 m apart, were realised. Each profile consisted of 235
measurements, thus totalling 8695 data points. In this zone,
a giacciara is indicated with a circle in the old drawing of the
fortress, close to its northern wing (Figure 2). The probable
presence of the round structure, likely a brickwork room
used in the past for the maintenance of food, is also suggested
by the cropmarks easily visible on the ground (Figure 5),
nearly where it is indicated in the map of Figure 2.
Zone B: it covers an area of 620 m
2
, located south of
the castle, where the construction of a swimming pool had
been planned. 21 parallel profiles, 31 m long and spaced
1 m apart, were investigated. Each profile consisted of 185
measurements, thus totalling 3885 data points.
Zone C: it covers an area of about 600 m
2
, located inside
the southwestern portion of the ditch that surrounds the
fortress, where part of the destroyed southern wing of the
castle was founded. Due to logistic difficulties, 18 profiles
spaced 1 m apart, but with different lengths ranging between
15 m and 31 m, were measured. The total number of data
points was 3560.
Ta bl e 1 reports the minimum, maximum, and mean ρ
a
values in Ωm obtained in each of the surveyed zones. The
mean value in each zone was calculated taking the average of
the logarithms of the corresponding ρ
a
values.
For the sake of brevity, we show in Figures 6, 7,and8
only three apparent resistivity pseudosections, one for each
zone, in order to give an idea of the nature of the input data.
We now proceed directly to the 3D probability tomography
approach that we have used to detect and confine the sources
of the apparent resistivity anomalies.
6 EURASIP Journal on Image and Video Processing
34
32
30
36
38
N
−4
−2
0
22
24
26
28
−4
−2
0
22
24
26
28
30
32
34
36
38
−4
−2
0
28
26
24
22
30
32
34
36
38
−0.5 −0.25 0 0.25 0.5
Resistivity anomaly occurrence probability
Distances (meters)
(a)
34
32
30
36
38
N
22
24
26
28
22
24
26
28
30
32
34
36
38
28
26
24
22
30
32
34
36
38
−0.5 −0.25 0 0.25 0.5
Resistivity anomaly occurrence probability
Distances (meters)
(b)
Figure 13: A-Zone: a sketch of the giacciara compared with the particular of the round sequence of nuclei extracted from the 3D image of
Figure 10(a),fromalateral(a)andatop(b)view.
Table 1: The minimum, maximum, and mean apparent resistivity
values in Ωm obtained in the surveyed zones A, B, and C.
Zone ρ
a,min
ρ
a,max
ρ
a,mean
A 0.67 52367.28 29.92
B 2.94 218.31 24.76
C 3.27 2055.32 87.05
5. The 3D Probability Tomography
Figure 9 shows the results of the 3D probability-based ERT
imaging applied to the
{ρ
a
} datasets collected in the three
zones marked in Figure 4. In each zone, the number of the
model cells used for the 3D ERT imaging is exactly the
same as that of the data points. The 3D ERT image consists
of a sequence of horizontal slices at increasing depth from
1 m down to 5 m beneath the ground level (b.g.l.). A rather
complex pattern of resistivity anomaly sources can readily
be observed. The group of sources, deserving to be analysed
from the archaeo-architectural point of view, can reasonably
be associated with the highs occurring within the first 3 m of
depth. These highs, that is, source nuclei characterised by a
positive occurrence probability, would indicate the presence
of structures with true resistivity higher than the reference
uniform resistivity in each zone. The large positive and
negative nuclei, centred at a depth not less than 4 m b.g.l. in
the B-zone and the C-zone, respectively, and within which
the maximum absolute occurrence probabilities have been
obtained, may reasonably indicate, instead, the presence of
a vertical discontinuity. This discontinuity is assumed to
separate two geological media with resistivity on a side higher
and on the other side lower than the reference resistivity. The
reference resistivity was taken equal to the average apparent
resistivity of 29.92 Ωm in the A-zone, 22.80 Ωm in the B-
zone, and 87.04 Ωm in the C-zone.
More compact 3D views of the highs of probable archaeo-
architectural interest under the surveyed zones are reported
separately in Figure 10. In all of these and following 3D views
the resistivity anomaly occurrence probability scale has been
modified, by compressing the light-to-dark colour sequence
entirely within the positive half-scale and leaving colourless
the negative half-scale.
Moreover, to help focus the discussion, we consider
as a reference map the horizontal slice at 1 m of depth,
extracted from Figure 9 and depicted in Figure 11.Allof
the relative maxima of the highs of probable archaeo-
architectural interest are located in this slice, where the sites
of 10 holes, bored after the ERT prospecting for ground-
truthing, are also indicated. The results of this activity are
reported separately for each zone.
5.1. A-Zone. Worthy of note appears the isolated rounded
sequence of nuclei visible in Figure 11 at the centre of the
EURASIP Journal on Image and Video Processing 7
Figure 14: B-zone: the furnace found in correspondence with the
longer side of the L-shaped sequence of nuclei in the geoelectrical
tomography of Figure 11.
A-zone, close to its right-hand borderline. The location of
this source exactly corresponds with the cropmarks visible in
Figure 5. The subsequent archaeological excavation allowed
a circular structure with radius and height of 3.3 m to be
discovered (Figure 12), immediately under the humus [12].
It was found made of pebbles and bricks tied up with a
mortar rich in sand in the top portion, made of disjointed
bricks and slightly flared at the bottom, and externally
surrounded by eight small buttresses, set at a regular distance
of about 2.6 m. This regular and well-preserved masonry
structure was readily ascribed to the circular plot indicated
as giacciara in the ancient drawing reported in Figure 2 [12].
For a better appreciation of the resolving power of the
exposed probability tomography method, Figure 13 shows a
zoom of the 3D image in Figure 10(a), under two different
angles of view, limited only to the central round sequence
of nuclei. A sketch of the giacciara is also plotted at the
correct place as from the digging. In both images, the round
sequence of nuclei appears to correspond exactly with the
trace of the giacciara on the horizontal plane through its
centre. Furthermore, in the lateral view in Figure 13(a), the
full bowl-shaped set of source nuclei appears to smoothly
conform to the very regular nest-shaped structure of the
giacciara.
In the A-zone 4 holes (S1-S4) located as in Figure 11 were
also bored. The results from the S2 hole, bored down to 5 m
of depth in correspondence with the top right alignment of
small positive nuclei, showed the only significant anomalies.
In S2, a layer with significant signs of human activity
was in fact detected at about 1.65 m of depth. A slimy-
sandy-clayey layer, rich of bricks and carbonaceous frustules,
was found [13]. This fertile layer has, however, not yet
been confirmed by direct archaeological excavations. It may
reasonably extend over the whole top third of the A-zone,
likely as patches separated by sterile zones. A support to this
interpretation derives from the discontinuous nature of the
dark nuclei and the circumstance that the hole S1, located a
little outside the large horizontal sequence of nuclei in the
top left-hand side of the area, did not meet any remnants.
No interesting archaeological data came also out of the S3
and the S4 holes, thus confirming the absence of resistivity
anomaly source nuclei in those areas.
5.2. B-Zone. An inclined L-shaped sequence of positive
nuclei was the only interesting feature appeared in the B-
zone, as shown in Figure 11. Three holes (S5-S6-S7) were
bored. The S5 hole, located on the longer side of the L-
shaped source sequence, revealed, from 0.65 m down to
1.7 m b.g.l., the presence of residues testifying an activity of
combustion and/or heating [13]. The first 0.45 m resulted,
in fact, to belong to a brick structure, the following 0.15 m
to be made of ash and coal and the last 0.45 m of burnt
clay. The subsequent digging brought to the light a roofless
furnace dating back to the 15th-16th century (Figure 14).
The complex presents two anterooms (prefurni)andaroom
of combustion that probably contained part of the last batch
of bricks employed for the construction of the castle [12].
TheholeS6wasboreddownto5mofdepth,in
correspondence with the small positive nucleus located at the
centre of the lower half of the zone. The most significant
archaeological layer was found between 0.7 and 1.47 m of
depth with abundant brick fragments. In particular, the
first strata are worthy of note because remnants similar to
those found in the S5 hole were detected in the same depth
range, allowing for a connection between them. The S7 hole,
instead, was bored down to 5 m of depth in an area where
the geoelectrical tomography did not put in evidence any
relevant positive nucleus. The hole confirmed such a result,
since only very rare fragments were there detected [13].
As before, a zoom of the 3D image in Figure 10(b),under
two different angles of view, limited only to the portion of
the longer side of the L-shaped sequence, where the nuclei
with highest occurrence probability were found, is depicted.
A sketch of the furnace is also plotted at the correct place as
inferred from the digging. In both 3D images, it can readily
be observed that the selected portion of the L-shaped set of
nuclei exactly corresponds with the trace of the discovered
furnace on the horizontal plane through its floor. Moreover,
the top view in Figure 15(b) shows that the sequence of the
small nuclei closely conforms to the disposition and shape of
the discovered rooms.
5.3. C-Zone. The C-zone is almost totally dominated by
a positive pattern of source occurrence probabilities, com-
posed of a double set of parallel positive nuclei, which appear
to conform at right angle to the southwestern corner of
the castle. The internal sequence of nuclei may reasonably
attest the presence underground of the foundations of the
fourth wing, including the tower, as indicated in the drawing
of Figure 2, both destroyed in the 18th century. The outer
sequence of positive nuclei may, instead, be associated to
8 EURASIP Journal on Image and Video Processing
120
125
115
N
−4
−2
0
30
34
38
−4
−2
0
30
34
38
125
120
115
−4
−2
0
38
34
30
125
120
115
−0.5 −0.25 0 0.25 0.5
Resistivity anomaly occurrence probability
Distances (meters)
(a)
125120115
30
34
38
30
34
38
125120115
38
34
30
125120115
−0.5 −0.25 0 0.25 0.5
Resistivity anomaly occurrence probability
Distances (meters)
N
(b)
Figure 15: B-Zone: a sketch of the furnace compared with the last portion of the longer side of the L-shaped sequence of nuclei extracted
from the 3D image of Figure 10(b), from a lateral (a) and a top (b) view.
Figure 16: C-zone: a nearly east-westward view of the foundations
of the fourth wing of the Castle of Zena found in correspondence
of the inner sequence of nuclei at right angle in the geoelectrical
tomography of Figure 11.
traces of structural elements connected to the castle, likely
the base of the former embankment of the ancient ditch.
In the C-zone three holes were bored. The hole S8 was
bored down to the depth of 4 m outside the area surveyed
N
265
260
255
250
145
150
155
160
165
170
−2
−4
−0.5 −0.25 0 0.25 0.5
Resistivity anomaly occurrence probability
Distances (meters)
Figure 17: C-Zone: a sketch of the foundations of the destroyed
fourth wing and southwestern tower of the castle compared with the
inner sequence of the resistivity anomaly source nuclei, replicated
from Figure 10(c). The present outline of the castle is drawn on top.
by the ERT. At 1.75 m of depth, a compacted gravel layer
was found with traces of mortar, probably constituting the
EURASIP Journal on Image and Video Processing 9
allurement layer of the fourth wing [13]. The hole S9 was
bored down to the depth of about 2.5 m in the area of the
old ditch now turned into orchard. Bricks were found from
0.97 m down to 1.10 m. Finally, the hole S10 of 4.5 m of
depth did not reveal any elements referable to the destroyed
wing, but only levels related to the depositional activity
in the ditch [13], thus confirming the absence of positive
anomaly source nuclei in the ERT of that sector of the C-
zone. The subsequent archaeological excavations (Figure 16)
brought to light the existence of the foundations of the
collapsed southern wing of the castle and the tower at
the southwestern corner [12]. Also in this case, in order
to evaluate the resolving power of the 3D tomography
reconstruction, the 3D tomography image in Figure 10(c)
is replicated in Figure 17 for a comparison with the plotted
sketch of the foundations as discovered by the digging.
6. Conclusion
We have shown the results from an application of the 3D
probability-based ERT imaging approach to a case-study of
great importance from both the historical and architectural
points of view, consisting in the mapping of some structural
remains of the medieval Castle of Zena in three adjacent areas
destined to restoration and renovation.
As outlined in previous applications [14, 15], the 3D
probability-based ERT method can be considered a self-
sufficient procedure, useful to delineate location and shape of
the most probable sources of the anomalies detected on the
ground surface. In this study, and more generally in the field
of Cultural Heritage, the exact knowledge of the true resistiv-
ity is not so essential as the location and shape delineation
of the expected targets. The rationale for this assumption
is that, generally speaking, buried stone remnants or metal
bodies of archaeo-architectural interest are characterised
by true resistivities higher or lower, respectively, than the
resistivity of the hosting environment, which normally
consists of medium-to-low resistivity sediments. This, of
course, facilitates the detection of meaningful anomalies on
the measurement surface. It must also be stressed that the
knowledge of the resistivity of the targets generally does not
give any added value to the immediate interest of the histori-
ans, archaeologists, or architects. This is the reason why the
3D probability tomography approach has not required in this
application a further step, aimed at associating true resistivity
values to the revealed anomaly sources.
The subsequent ground-truth excavations are to be con-
sidered a further successful confirmation of the full validity
of the 3D probability-based ERT imaging in detecting the
targets location underground and of its resolving power.
For a more detailed discussion on this aspect and examples
of comparison with the results of inversion-based ERT
approaches, the reader is referred to [9, 14, 15].
Acknowledgments
The authors wish to thank for the fruitful collaboration the
Archaeology Service of Parma and Piacenza and the Institute
of Technologies for Cultural Heritage, National Research
Council (CNR), Italy. Thanks are also to Dr. P. Mancioppi,
GEONORD Company, Piacenza, Italy, who has kindly pro-
vided them with the stratigraphic results from the boreholes,
and to Professor. A. Augenti and his group, Department of
Archaeology, Ravenna branch, University of Bologna, Italy,
who has supervised the archaeological excavations in the
areas indicated by the geoelectrical probability tomography.
References
[1] Y. Sasaki, “3-D resistivity inversion using a subspace method,”
Geophysical Exploration, vol. 59, no. 5, pp. 425–430, 2006.
[2] T. Ha, S. Pyun, and C. Shin, “Efficient electric resistivity
inversion using adjoint state of mixed finite-element method
for Poisson’s equation,” Journal of Computational Physics, vol.
214, no. 1, pp. 171–186, 2006.
[3] A. Pidlisecky, E. Haber, and R. Knight, “RESINVM3D: a 3D
resistivity inversion package,” Geophysics,vol.72,no.2,pp.
H1–H10, 2007.
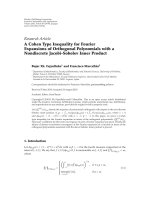
[4] L. Marescot, S. P. Lopes, S. Rigobert, and A. G. Green,
“Nonlinear inversion of geoelectric data acquired across 3D
objects using a finite-element approach,” Geophysics, vol. 73,
no. 3, pp. F121–F133, 2008.
[5] R. Barker, “A simple algorithm for electrical imaging of the
subsurface,” First Break, vol. 10, no. 2, pp. 53–62, 1992.
[6] M. H. Loke and R. D. Barker, “Rapid least-squares inversion
of apparent resistivity pseudosections by a quasi-Newton
method,” Geophysical Prospecting, vol. 44, no. 1, pp. 131–152,
1996.
[7] S. Narayan, M. B. Dusseault, and D. C. Nobes, “Inversion
techniques applied to resistivity inverse problems,” Inverse
Problems, vol. 10, no. 3, pp. 669–686, 1994.
[8] R. K. Chunduru, M. K. Sen, and P. L. Stoffa, “2-D resistivity
inversion using spline parameterization and simulated anneal-
ing,” Geophysics, vol. 61, no. 1, pp. 151–161, 1996.
[9] P. Mauriello, D. Monna, and D. Patella, “3D geoelectrical
tomography and archaeological applications,” Geophysical
Prospecting, vol. 46, no. 5, pp. 543–570, 1998.
[10] P. Mauriello and D. Patella, “Resistivity anomaly imaging by
probability tomography,” Geophysical Prospecting, vol. 47, no.
3, pp. 411–429, 1999.
[11] P. Mauriello and D. Patella, “Imaging 3D structures by
resistivity probability tomography,” in Proceedings of the 61st
EAGE Conference and Technical Exhibition, Helsinki, Finland,
June 1999.
[12] M. Bondi, M. Cavallazzi, and G. Musina, “Progetto
di recu-pero e valorizzazione del Castello di Zena
e delle sue perti-nenze,” Campagna di scavo, 2006,
/>[13] F. Boschi, “Progetto di recupero e valorizzazione del Castello
di Zena e delle sue pertinenze,” Campagna di sondaggi mecca-
nici, 2006, />[14] R. Alaia, D. Patella, and P. Mauriello, “Application of geo-
electrical 3D probability tomography in a test-site of the
archaeological park of Pompei (Naples, Italy),” Journal of
Geophysics and Engineering, vol. 5, no. 1, pp. 67–76, 2008.
[15] V. Compare, M. Cozzolino, P. Mauriello, and D. Patella,
“Three-dimensional resistivity probability tomography at the
prehistoric site of Grotta Reali (Molise, Italy),” Archaeological
Prospection, vol. 16, no. 1, pp. 53–63, 2009.