báo cáo hóa học:" Research Article Optimization of Sensing Receiver for Cognitive Radio Applications" docx
Bạn đang xem bản rút gọn của tài liệu. Xem và tải ngay bản đầy đủ của tài liệu tại đây (1.69 MB, 12 trang )
Hindawi Publishing Corporation
EURASIP Journal on Advances in Signal Processing
Volume 2009, Article ID 309212, 12 pages
doi:10.1155/2009/309212
Research Article
Optimization of Sensing Receiver for
Cognitive Radio Applications
Hassan Zamat
1
and Balasubramaniam Natarajan
2
1
IBM Systems and Technolog y Group, 4660 La Jolla Village Dr., Suite 300, San Diego, CA 92127, USA
2
Director WiCom Research Group, Dep artment of Electrical Engineering, Kansas State University, Manhattan, KS 66506, USA
Correspondence should be addressed to Hassan Zamat,
Received 14 February 2009; Revised 26 May 2009; Accepted 8 July 2009
Recommended by R. Chandramouli
We propose an optimized dedicated broadband sensing receiver architecture for use in cognitive radios supporting delay sensitive
applications. Specifically, we first reason the need for a dedicated sensing receiver that employs a combination of coarse and
fine scanning to reduce sensing time over a large bandwidth. We derive an expression for mean acquisition/detection time as a
function of a number of parameters including the number of coarse and fine frequency bins employed. We then determine the
optimal number of coarse and fine bins that minimize the overall detection time required to identify idle channels under various
system conditions. Using analytical and simulation results, we quantify the dependence of optimal coarse and fine bin selection
on system parameters such as (1) size of FFT used in scanning; ( 2) probability of detection and false alarm of the underlying
sensing algorithm; (3) signal-to-noise ratio of the received signal, and (4) expected number of available channels. The primary
contribution of this work lies in a practical realization of an optimal broadband sensing receiver.
Copyright © 2009 H. Zamat and B. Natarajan. This is an open access article distributed under the Creative Commons Attribution
License, which permits unrestricted use, distribution, and reproduction in any medium, provided the original work is properly
cited.
1. Introduction
Cognitive Radios (CRs) promise to address the underuti-
lization of the frequency spectrum—a scarce and precious
resource required for wireless communication. CRs are
capable of operating as secondary users (SUs) adding limited
interference to the primary users (PUs) and other secondary
users in a desired band. The key to spurring the wide
adoption of CR in the market is a practical realization of
the sensing receiver in the cognitive radio. The receiver
must have the ability to make fast and accurate decisions
on availability (or lack thereof) of a channel. The sensing
receiver must actively scan, detect, initiate a communication
link, and dynamically adjust its transmission parameter
in order to minimize interference with existing users.
Technological advances in the recent years have addressed
some of the challenges of broadband, frequency agile radios.
However, real challenges still persist such as the physical
implementation of broadband frequency synthesizers, high
sensitivity receivers with high dynamic range [1–4]. In
order to address these shortcomings, the CR community is
focusing on innovative architectures and algorithms.
Cognitive Radios (CRs) require an accurate assessment
of the activities in a desired frequency spectrum in order
to determine the availability of idle channels suitable for
opportunistic secondary use. Prior research has focused on
novel techniques such as centralized network sensing [5],
cooperative sensing [6], and the use of statistical methods
and game theory [7] to improve sensing time. These
techniques are not well suited for practical implementation
of CR in time sensitive operations. By utilizing the techniques
presentedin[5–7], the CR is now dependent on external
inputs to make decisions on its operation. With a centralized
network sensing, additional costs and delays are introduced
by the traffic controller. In the cooperative model, the CR
performs energy detection and uses time division slots to
communicate with other users. As the number of users
increase, the delay may become intolerably long. In our
earlier work [8], we propose the use of a dedicated sensing
receiver (DSR) that is solely focused on channel sensing and
runs in parallel with a main receiver. The key to the DSR
is an efficient algorithm that performs spectrum detection
and continuously improves the quality of the collected
data and decision process. The fast and initial sensing is
2 EURASIP Journal on Advances in Signal Processing
done in the analog domain at the RF or IF frequencies
prior to additional processing in the digital domain. We
demonstrated that the use of a dedicated sensing receiver
(DSR)isnecessaryandrequiredforfastandreliablesensing
in broadband operation. In addition, the overall time delay is
also greatly reduced which opens the way for voice operation
in cognitive radio. We were able to show that the DSR
architecture provides up to a fivefold reduction in total mean
time detection.
In this paper, we focus on optimizing the broadband
sensing receiver architecture for use in cognitive radios
supporting delay sensitive applications. In our proposed DSR
model, we use a two-stage sensing technique for performing
broadband sensing. Here, we divide the desired bandwidth
into coarse bins which are then subdivided into fine bins.
After the initial setup, the receiver performs a cursory scan
of the coarse bins in search of idle channels. Once idle
channels are identified, the receiver then proceeds to a more
thorough scan of the channels using improved resolution
in order to avoid misdetection or a false alarm (especially
when the primary users of the channel are operating at low
signal to noise ratio (SNR)). Higher resolution scans require
more time to complete the operation. The coarse scan while
faster is not as accurate and might lead to a high number of
misdetections. Hence, a delicate balance between the faster
coarse scan and the more accurate but slower fine scan is
needed. Therefore, we first derive an expression for total
mean detection time as a function of the number of coarse
and fine bins as well as other system parameters such as
phase locked loop (PLL) lock time, digital signal processing
(DSP) frequency of operation, and received signal to noise
ratio. We then determine the optimal values of coarse and
fine bins that minimize the total mean detection time. Using
both analytical and simulation results, we quantify the effect
of various system parameters on the optimal choice of coarse
and fine bins. For example, we show that the optimal number
for coarse bins decreases with an increase in SNR and
the optimal number of fine bins increases with increased
interference in the band.
This paper consists of five sections. In Section 2,we
present our Dedicated Sensing Receiver architecture, define
the channel model, and derive an equation for mean
detection time. In Section 3, we optimize the coarse and
fine bin size such that our total mean detection time is
minimized. The results from optimization are presented
in Section 4. Section 5 presents the conclusions and future
work.
2. Dedicated Sensing Receiver
Although spectrum is overcrowded at frequencies below
3 GHz, the utilization drops to less than 0.5% above 3 GHz
[9]. It is not a trivial task to design a broadband and agile
radio that operates above 3 GHz. The radio design challenges
include receiver sensitivity, dynamic range, frequency gener-
ation (synthesizers), and other RF impairments [3, 7]. As the
radio cycles through the frequencies of interest, the PLL lock
time, becomes a sig nificant contributor to the total scan time.
As the frequency step increases, the PLL lock and settling
times degrade. Once settled, the receiver could exercise a
Periodogram Spectral Estimator (PSE) which makes use of
fast Fourier transform (FFT) for spectral detection. FFTs are
computationally intensive and the time required to perform
the computation is directly proportional to the DSP speed
used in the system. If a higher frequency resolution is desired,
we require a longer observation time. Hence as the number
of FFT points increases, the resolution improves but the
scanning time degrades. A compromise between frequency
estimation and detection bandwidth is therefore required.
In this paper, we proposed a two-stage approach in which
a coarse scan with lower number of FFT points is performed
on a large bandwidth in search of idle channels. Once the
idle coarse channels are identified, a higher number of FFT
points are used to perform the fine scan. In order to avoid
false alarms and minimize the probability of interfering with
a user in the band, the CR must continuously monitor the
spectrum for activity of other occupants in the spect rum.
Without a radio receiver dedicated to sensing the spectrum,
the main receiver is continuously interrupted in order to
perform sensing and link maintenance. The interruption and
delays are detrimental to time sensitive applications such
as video and audio. Based on popular voice Codecs and
ITU recommendations [10–12], it is possible to translate
the acceptable voice delays to CR delay requirements [8].
For the purposes of this work, we propose a rule of thumb
for total time delay between packet transmissions to be less
than 20 milliseconds. In [8], we illustrate that it is possible to
meet this delay requirement with the help of a DSR provided
that the initial detection of available channels across the
entire band is completed in a timely manner. Otherwise, as
channel conditions vary, the CR cannot start operation until
a new spectrum scan is completed and the availability of the
channel is validated.
2.1. Prior Efforts. The research around sensing in cognitive
radio has been extensive. There are several well researched
techniques.
(1) Blind Se nsing Algorithms. The technique is based on
oversampling the received signal or by employing multiple
receives antennas. The algorithm does not require knowledge
of the channel or of the noise power (i.e., blind). When the
primary signal is present, the signal statistics computed will
differ much more in value from each other, than when the
primary signal is not present [13, 14].
(2) Cooperative Sensing. It defines two protocols:
(i) Noncooperative (NC) Protocol. All users detect the
primary user independently. However the first user
to detect the presence of the primary user informs
the other users through the central controller (dis-
tributed sensing).
(ii) Totally Cooperative (TC) Protocol. Two users oper-
ating in the same car rier, if placed sufficiently near
each other, cooperate to find the presence of the
primary user. The first user to detect the presence
of the primary user informs the others through the
central controller.
EURASIP Journal on Advances in Signal Processing 3
(iii) Agility is measured as the probability of detection of
noncooperative divided by probability of detection
of cooperative protocol. The paper estimates that
maximum gain in using the technique is 11% [15,
16].
(3) PU LO Leakage Detection. Technique is based on the
possibility of detecting primary receivers by exploiting the
local oscillator (LO) leakage power emitted by the RF front
endofprimaryreceivers[17].
(4) Radio Identification-Base d Sensing. A complete knowl-
edge about the spectrum characteristics can be obtained by
identifying the transmission technologies used by primary
users.
(i) Several features are extracted from the received signal
and they are used for selecting the most proba-
ble primary user technology by employing various
classification methods. Features obtained by energy
detector-based methods are used for classification.
Channel bandwidth and its shape are used in refer-
ence features. Channel bandwidth is found to be the
most discriminating parameter among others [18].
(5) Cyclostationary Feature Detection. To impr ove spec-
trum sensing sensitivity, cyclostationary feature detection
computes the autocorrelation of received signal before the
spectral correlation detection. The technique is based on
the fact that modulated signals are in general coupled with
sine wave carriers, pulse trains, or cyclic prefixes which
result in built-in periodicity. The periodicity helps extracting
information about the received signal such as modulation,
pulse shape, and bandwidth [19].
None of the approaches described above address the
requirements for time sensitive applications. As a matter of
fact, several of these techniques actually lengthen the time
required to search for appropriate CR channels.
In Ta ble 1, “detection time” is the time required to
scan the entire bandwidth, “detection ability” is the ability
to correctly predict the presence or absence of a sig-
nal, “complexity” refers to the implementation complexity,
“dependency” is the need for the sensing receiver to depend
on another user, a base station or a master controller to
perform sensing, and finally the “overall performance” is
summarized in the last column. It is clear that none of
the previous work actually addresses the timely sensing
requirement of CR. The dedicated sensing receiver (DSR)
architecture is presented in the next subsection.
2.2. The Dedicated Sensing Receiver. Based on the imple-
mentation and operational challenges described above, our
proposed approach is to separate the continuous sensing
function from the main CR receiver. The Dedicated Sensing
Receiver (DSR) addresses several of the issues discussed
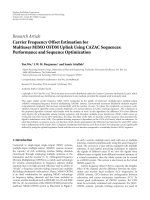
earlier. The block diagr am of the proposed architecture is
shown in Figure 1.
At the heart of the DSR is a learning algorithm that
continuously scans the spectrum and prioritizes the available
channels in a look up table (LUT). In order to speed up
sensing, both the main receiver and the DSR in Figure 1
perform the coarse sensing in essence sharing the work
between the two receivers. Once the initial results in the
LUT, the DSR performs the fine sensing on the candidate
channels. In order to avoid conflict with a PU or another
secondary user, continuous channel monitoring is done via
detectors in the analog domain because of their fast response
time. In order to take full advantage of the DSR, a radio
architecture and especially the phase locked loop must be
able to quickly hop and settle onto the desired frequency.
Without an agile PLL, the system scan time would be gated
by the radio hardware. The overall PLL design is critical to
the performance, cost and complexity of the CR specifically
across wideband operation. One important aspect of the
cognitive radio network is to insure that the CR does not
interfere with a PU or another SU in the band. In our
implementation in [8], we proposed the analog RF detector
shown as the “RF Coarse Sensing” in Figure 1 to monitor and
suspend transmission if a detected signal surpasses a preset
threshold.
2.3. Scan Time Calculations. Throughout the paper, we use
the subscript “crs” to denote parameters associated with
coarse sensing while “fin” is used for fine sensing. The overall
system bandwidth of interest B
sys
is divided into β coarse
bins (each bin with bandwidth B
crs
). Each coarse bin is
further divided into α fine bins (with fine bin bandwidth
corresponding to B
fin
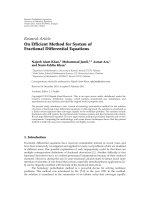
) as shown in Figure 2.
From Figure 2, it is clear that
B
crs
= αB
fin
,whereα = 1, 2, 3, 4, (1)
In practical implementations, FFTs have widely used the
split-radix FFT algorithm [20]. The number of real additions
and multiplications needed for a 2
N
points FFT (with N
> 1) is given by 4N log
2
N − 6N + 8. The resolution of
the estimation is proportional to N. Hence, the resolution
increases as N increases. For fine sensing,
B
fin
= NF
res
,(2)
where F
res
is the resolution of the sensing. The total time to
perform a discrete Fourier Transform (DFT) is given by
T
DFT
=
1
F
DSP
4N log
2
N − 6N +8
,(3)
where F
DSP
is the DSP operating frequency. For simplicity,
assume that the DSP is capable of performing one addition
and one multiplication per clock cycle, the total sensing time
for coarse and fine sensing of the total bandwidth is given by
T
crs
=
B
SYS
B
crs
T
DFT
. (4)
As shown in Figure 1, the CR has two receiver chains: the
main receiver and the DSR. With two available receivers, one
would share the load across the two receivers. One can also
expand this concept from 2 receivers to M receivers operating
4 EURASIP Journal on Advances in Signal Processing
Table 1: Prior work summary.
Detection time Detection ability Complexity Dependencies
Overall
performance
Base sensing
receiver
To o s low
OK in
narrowband apps
Solution
workable in low
bandwidth
solutions
Blind sensing
Fear of false
positive
Because of
“comparative
sensing” might
miss low SNR
solutions
Fear of missing
available channels
or false positives.
Cooperative
sensing—
distributed
Each user must
still scan and detect
the band
Sharing helps
improve detection
Requires the
cooperation of
others in the
network
To o s low an d
needs input of
others
Cooperative
sensing—
centralized
Time may be
accelerated with
help from BS
Sharing helps
improve detection
Requires the
cooperation of
others in the
network
Improved time,
but requires
infrastructure and
may be limited in
frequency
operations.
Cooperative
sensing—Totally
cooperative
Time is gated by 2
or more CR sensing
the same channel
Sharing helps
improve detection
Requires the
cooperation of
others in the
network
Improved time,
but requires
infrastructure and
may be limited in
frequency
operations.
PU LO leakage
detection
Limited to the PU
bands
Solution very
limitedtoaknown
band
Need prior
knowledge of PU
Very limited
solution
Radio
identification
based sensing
Limited to the PU
bands
Solution very
limitedtoaknown
band
Need prior
knowledge of PU
Very limited
solution
Cyclostationary
Detection time
slows down
considerably
Better detection
ability but much
worse time
Network with
beacon
Leverages beacon
to detect signal, but
limitedtobeacon
freq. bands
Solution very
limitedtoaknown
band
Requires
cooperation from
beacon
Very limited
application can
help avoid
interference
Best solution Good Adequate Inadequate Unworkable.
in parallel to reduce the scan time, where each receiver is
tasked to scan a 1
/M of the desired frequency band.
Combining (1), (2), and (3) and assuming that in coarse
mode, M receivers share the sensing load, we can write
T
crs
and T
fin
as:
T
crs
=
B
SYS
αMN
crs
F
res
F
DSP
4N
crs
log
2
(
N
crs
)
− 6N
crs
+8
,
T
fin
=
α
F
DSP
4N
fin
log
2
(
N
fin
)
− 6N
fin
+8
,
(5)
where N
crs
and N
fin
are the number of FFT points used in
coarse and fine mode, respectively.
In order to compute the overall system sensing time
we need to include the radio tuning time which is mostly
dominated by the PLL lock times. Let us define three different
PLL locks times: T
init
which is the initial lock time, T
PLL crs
which is PLL lock time for a coarse step, and T
PLL fin
which
is PLL lock time for a fine step. Hence, the total PLL sweep
time T
PLL crs
during the sensing operation is give by
T
PLL SYS
= T
init
+ αβT
PLL fin
+ βT
PLL crs
. (6)
After the coarse scan, only a fraction of the channels is
expected to be fine scanned. We define a term ρ whereas ρ is
defined as the percentage of coarse bins that a re identified as
candidate channels after coarse sensing. In other words, if the
entire band was available then ρ
= 1 which means that every
coarse bin must be submitted for fine sensing. Conversely,
ρ
= 0 means that the coarse sweep identified that all bins
EURASIP Journal on Advances in Signal Processing 5
A/D
Main
PLL
Band
filter
Band
filter
Coarse
sensing
Fine
sensing
Fine
sensing
DSP
LUT
Receive Data
LNA
LNA
A/D
DSR
PLL
BB coarse
sensing
BB coarse
sensing
RF coarse
sensing
Dedicated sensing receiver
Main Receiver
Figure 1: Proposed block diagram.
B
sys
B
crs 1
B
crs β
B
fin 1
B
fin α
B
crs
B
sys
= β . B
crs
system BW is divided into β coarse bins
B
crs
= α . B
fin
each coarse bin is divided into α fine bins
···
Figure 2: Channel model.
are occupied and hence no need for fine sensing. The overall
system scan time is defined as
T
SYS
=
B
SYS
αMN
crs
F
res
F
DSP
4N
crs
log
2
(
N
crs
)
− 6N
crs
+8
+
αβρ
F
DSP
· M
4N
fin
log
2
(
N
fin
)
− 6N
fin
+8
+ T
init
+
αβρ
M
T
PLL fin
+
β
M
T
PLL crs
.
(7)
Equation (7) corresponds to the overall system scan time for
the proposed DSR. However, this equation assumes perfect
detection and no false alarm during coarse scanning. In order
to charac terize the sensing time accurately, the probability
of detection and false alarm rate of coarse scanning must be
incorporated into (7).
2.4. Detection and False Alarm Probability. For the purposes
of this paper, we assume that energy detection is used for
detecting channel availability. The received signal is filtered
then passed through a square law detector and integrated
over a sensing time. We define (1) P
d
as the detection
probability; (2) P
fa
as the false alarm probability; (3) D
t
as the threshold level for the detection rule; (4) J as the
implementation penalty metric that models the additional
wasted time needed to recover from a false alarm and resume
the search process; M as the number of receivers. In the case
of the DSR shown in Figure 1, M
= 2. We further define L as
the actual number of idle coarse channels and K as the actual
number of idle fine channels. Hence, ρ can be represented in
term of L as
ρ
=
L
β
. (8)
Assuming a serial search is performed, the mean detection
time
T
det
corresponds to [21]
T
det
= S
det
(
T
s
+ T
i
)
,(9)
where,
S
det
=
β − L
JP
fa
+ β
P
d
(
L +1
)
. (10)
S
det
is the average number of steps in channel scanning
prior to a success (i.e., detecting an idle channel). T
s
is the
switching time. However, since we have 2 different switching
timesinthissystemT
PLL crs
and T
PLL fin
,wesetT
s
= T
PLL crs
when we generate a coarse detection time. Similarly, we set
T
s
= T
PLL fin
in order to determine the fine detection time.
T
i
is the integration time required for making a decision.
6 EURASIP Journal on Advances in Signal Processing
From (9)and(10), we can write down the mean detection
time in coarse mode
T
det crs
=
β − L
JP
fa
+ β
P
d
(
L +1
)
×
T
PLL crs
+
1
F
DSP
4N
crs
log
2
N
crs
−6N
crs
+8
+T
init
(11)
Similarly,
T
det
for the fine mode can be derived and plugged
into (7) in order to determine the overall mean time
detection of system defined by
T
sys
in
T
sys
=
B
sys
αMN
crs
F
res
+
β − L
J · P
fa
+ β
P
d
(
L +1
)
A
crs
+
αβρ
MF
DSP
+
(
α
− K
)
J · P
fa
+ α
P
d
(
K +1
)
A
fin
+ T
init
+
αβρ
M
+
(
α
− K
)
J · P
fa
+ α
P
d
(
K +1
)
T
PLL fin
+
β
M
+
β − L
J · P
fa
+ β
P
d
(
L +1
)
T
PLL crs
,
(12)
where
A
crs
= 4 · N
crs
log
2
N
crs
− 6N
crs
+8,
A
fin
= 4 · N
fin
log
2
N
fin
− 6N
fin
+8.
(13)
As expected, there are several parameters that affect the
overall mean time detection of a two-stage sensing system
as proposed in Section 2.1.Equation(12) illustrates that
sensing time is influenced by environmental parameters such
as B
sys
,SNR,K,andL, while other factors affecting T
sys
are under user control such as number of FFT points, α
and β. In the next section, we work to minimize
T
sys
by
appropriately choosing user defined parameters. Although
the detection of the signal is critical, this work focuses on
the ability of the system to quickly and efficiently scan and
track available channels. Nevertheless, the detection and
false alarm probabilities are integrated into the total mean
detection time of the system and hence are used to set a
threshold for detection. P
d
and P
fa
are assumed to be given
based on the detector performance and the received signal
quality.
3. System Optimization
The main goal of the sensing receiver is to detect available
channels quickly and reliably. Most importantly, it is critical
to reduce the number of false alarms. In examining (12)
above, there are some very obvious ways to minimize
T
sys
such as reducing initialization time (T
init
) and the PLL lock
times (T
PLL crs
and T
PLL fin
). However, the PLL lock time
has physical implementation limitations [8]. The critical
PLL parameters that affect the receiver performance (besides
center frequency and power consumption) are switching
time, phase noise, and spurs (also called reference sideband).
While the phase noise and spurs are directly proportional
to the loop bandwidth, the switching time is inversely
proportional [22]. In other words, as the loop bandwidth
increases to accommodate faster lock time, the PLL phase
noise and sideband spurs degrade which in turn cause the
sensitivity of the receiver to degrade. Hence, the PLL lock
time implementation is restricted by the phase noise budget
within the radio design.
Another method used to reduce sensing time is to
make appropriate choices for coarse and fine bins, that is,
selecting optimal β and α to minimize the overall mean
detection time. In order to minimize
T
sys
,wecanemploy
the standard strategy of equating the partial derivatives of
(12)withrespecttoβ and α to zero. However, P
d
and P
fa
complicate this computation since they exhibit a dependence
on the sensing or detection bandwidth which is directly
proportional to β and α. Therefore, we first simplify (12)by
approximating P
d
and P
fa
.
Assuming noncoherent square-law detection is used, P
d
and P
fa
corresponds to [21]
P
d
≈ Q
D
t
− 2T
sense
B
sense
(
1+SNR
)
2
T
sense
B
sense
√
1+2SNR
,
P
fa
≈ Q
D
t
− 2T
sense
B
sense
2
T
sense
B
sense
,
(14)
where Q(x)
= (1/
√
2π)
∞
x
e
−τ
2
/2
dτ.
As described earlier, T
sense
and B
sense
constitute the
sensing time and the sensing bandwidth that is directly
proportional to the bin bandwidth. Equation (14)canbe
approximated using a sigmoid function. The authors in
[23] used a gradient approximation of the sigmoid function
that was used for a fast algorithm for learning large-
scale preference relations. The relationship between the
sigmoid function and complementary error function can be
approximated as [23]
σ
(
z
)
=
(
1+e
−z
)
−1
≈ 1 −
1
2
erfc
√
3z
√
2π
. (15)
Recall that
Q
(
z
)
=
1
2
erfc
z
√
2
. (16)
By combining (15)and(16), Q(z) may be approximated as
Q
z
√
3
π
≈
1 −
(
1+e
−z
)
−1
. (17)
We can use the approximation in (17) to find a simplified
expression for P
d
and P
fa
in (14). After substituting these
EURASIP Journal on Advances in Signal Processing 7
updated P
d
and P
fa
expressions in (12), the simplified
approximation of
T
sys
is shown in
T
sys
α, β
=
A
crs
M · F
DSP
+
T
PLL crs
M
β +
A
crs
+ T
PLL crs
L +1
×
Je
x
(
y−1
)
β − L
+ βe
x
+
LA
fin
MF
DSP
+
L
· T
PLL fin
M
α +
A
fin
+ T
PLL fin
K +1
×
Je
v
(
y−1
)
(
α
− K
)
+ αe
v
+ T
init
,
(18)
where
y
=
SNR + 1
√
1+2SNR
,
x
=
π
2
A
crs
B
sys
6β · F
DSP
,
v
=
π
2
A
fin
B
sys
6αβ · F
DSP
.
(19)
The expression in (18) characterizes the mean scan time as
a function of a number of system parameters. Specifically,
we can show that under certain conditions,
T
sys
in (18)isa
convex function with respect to α , β as its Hessian is positive
definite. The conditions for convexity are α>K(i.e., the
number of idle fine channels is less than the total number of
fine channels), β>L(i.e., the number of idle coarse channels
is less than the total number of coarse channels) and y>1
(i.e., the SNR is real). All three conditions for convexity are
practical and essential. Since
T
sys
is convex in α and β (see
in the appendix), we can determine the optimal choice for
the number of coarse and fine bins (that minimize minimum
scan time) a s the values that force the derivative of (18)to0.
The partial derivate of (18)withrespecttoβ corresponds
to
∂
∂β
T
sys
=
A
crs
MF
DSP
+
T
PLL crs
M
+
A
crs
+ T
PLL crs
L +1
×
Je
x(y−1)
1 −
1
2
y − 1
x
+
JL
2
β
y − 1
xe
x(y−1)
+
1 −
1
2
x
e
x
⎤
⎦
.
(20)
Similarly, we can write down the partial derivative of
T
sys
with respect to α:
∂
∂α
T
sys
=
LA
fin
MF
DSP
+
LT
PLL crs
M
+
A
fin
+ T
PLL fin
K +1
×
Je
v(y−1)
1 −
1
2
y − 1
v
+
JK
2
√
α
y − 1
ve
v(y−1)
+
1 −
1
2
v
e
v
.
(21)
As expected, (21) depends on both β and α while (20)is
only dependent on β. That is, as the sensing receiver initiates
a coarse search, the number of coarse bins is not dependent
on the fine scan. However, once the coarse scan is completed,
the fine scan is dependent on the results of the coarse scan
(i.e., dependent on β). The fine scan is initiated according
to the priority set in the LUT set after the coarse scan is
completed. We can set (20)and(21)tozeroandsolvefor
β and α that minimize
T
sys
. We employ numerical nonlinear
solvers in order to find the solution to (20)and(21). The
results from the optimization and its physical interpretation
are presented in the next section.
4. Simulation Results
In this paper, our goal is to find the optimal bin size for coarse
and fine sensing under given channel conditions and design
implementation of the radio. As the spectrum becomes more
and more crowded, the number of idle channels for coarse
(K) and fine sensing (L) decreases and hence, on average,
it would take the sensing receiver a longer time to identify
an appropriate channel for CR operation (i.e., increases).
Similarly, the physical implementation is mostly defined by
the user given restrictions on cost, power, performance, and
so forth. For example, the total time to perform a DFT in
(3) is inversely proportional to the speed of operation of the
DSP. A brute force approach would be for the designer to
choose the fastest DSP available. However, fast DSP comes
with a premium in cost and power consumption that may
or may not necessarily affect the overall system performance.
The solution to this problem is fine balance between coarse
and fine sensing.
In this section, the simulation results are presented in
two parts. In the first part, we focus on minimizing
T
sys
in (12). We provide a better insight on the dependence of
minimum
T
sys
with respect to input variables such as the
number of FFT points, DSP operating frequency, number of
available channels (or spectrum crowding), assuming that β,
α, P
d
,andP
fa
are given. In the second part, we concentrate
on optimizing β and α in order to minimize
T
sys
given the
channel conditions (e.g., L, K, and SNR) and the physical
implementation of the radio (such as PLL initialization, PLL
lock times, number of FFT points, and the DSP frequency
F
DSP
).
4.1. Total Mean Detection Time
T
sys
. We simulate the total
sensing time with respect to channel conditions and our
choice of β, α. The basic parameters for our environment
are J
= 2, N
crs
= 64, N
fin
= 512, M = 2, F
DSP
= 50 MHz,
B
sys
= 10 GHz (broadband), T
PLL crs
= 10 ms, T
PLL crs
=
1 milliseconds and T
inits
= 100 milliseconds. In the first
simulation, we want to better understand how
T
sys
is affected
by the increase of the number of users. As the number of
users increases, the occupancy of the spectrum increases and
hence the number of idle channels suitable for CR operation
decreases. Recall that ρ constitutes the fraction of available
coarse channels that are scanned in fine mode. On one hand,
we want ρ to be as small as possible in order to minimize
fine scan. However, if ρ is too small, then the occupancy of
8 EURASIP Journal on Advances in Signal Processing
00.10.2
0.3
0.4
0.5
0.6
0.7 0.8
0.9
1
950
1000
1050
1100
1150
1200
1250
B
sys
= 10 GHz, J = 2; M = 2; T
PLL
= 100 ms
β = 100; N
crs
= 64 F
dsp
= 50 MHz;
α = 10; N
crs
= 512;
T
sys
min moves with P
d
Inflection
point
Fraction of available coarse channel-ρ
Total sensing time
Total sensing time (ms)
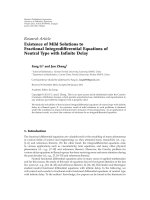
Figure 3: Total mean sensing time versus fraction of available coarse
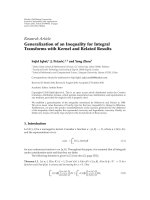
channels.
the channel is high and therefore it takes the DSR longer to
find an available channel. The simulation of ρ versus
T
sys
is
shown in Figure 3. As expected, as the number of available
candidate channel (ρ) increases, the algorithm identifies and
tags additional channels for fine sensing. Therefore the lower
the number of candidate channels needed to be fine scanned
the lower the total sensing time. However, as the number of
candidate channels (ρ) decreases to value typically <10%, the
total sensing time reverses course and begins to increase. At
low ρ values, it is less probable that the sensing receiver finds
an available channel quickly. Hence, the total sensing time
increases due to the lack of available channels that are viable
for CR operation. The dependence in Figure 3 indicates an
optimal ρ value for minimizing sensing time. However, ρ is a
system parameter that is outside the control of the desig n er.
The minimum sensing location is dependent on the value
of P
d
.AsP
d
increases, the T
sys
minimum location increases
while shifting to the right. The main reason for this shift is
that as the probability of detection increases, the false alarm
probability tends to increase. With an increasing number
of misdetection, the total system mean time is affected by
the factor J which is an implementation penalty metric that
models the additional wasted time needed to recover from a
false alarm and resume the search process.
The question remains how would
T
sys
be affected by our
choice of β and α? Since the coarse sensing time is much
lower than the fine sensing time,
T
sys
is reduced if more of
the detection is done in coarse mode. On the flip side, the
resolution in coarse mode is lower than in fine mode and
false alarms or false positive reading of the spectrum would
cause the DSR to reset and resume the scanning process. This
penalty is captured by parameter J and the F
res
in (12). Using
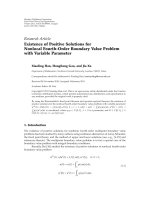
the same variables as defined above, we simulate the total
mean sensing time versus β and α is shown in Figure 4 with
ρ
= .5.
The relationship among β, α,and
T
sys
is shown in
Figure 4. We can observe that the sensing time is typically
×10
4
0
20
40
60
80
100
0
5
10
0.7
0.8
0.9
1
1.1
1.2
1.3
Total sensing time
Total sensing time (ms)
α
β
Figure 4: Total mean sensing time versus β and α.
lower at lower β and as expected, increases as α increases.
The resolution and the switching time in coarse mode start
to have a much greater effect on
T
sys
than the computation
of the N-point FFT. Given channel conditions and circuit
implementation (on the PLL, e.g.), we expect to find a
combination of β, α such that the total mean detection
time is minimized. One would h ope that the combination
would give a global minimum and hence provide an optimal
solution for the system. In the next subsection, we calculate
β and α such that
T
sys
is minimized.
4.2. Optimal β and α for Minimum
T
sys
. With the detection
time highly dependent on the coarse and fine bandwidths,
we seek to find an optimal solution. This is a large-
scale unconstrained optimization with primarily two sets of
variables (1) channel dictated variables such as SNR and
implementation variables such as PLL lock times and (2)
the choice of DSP. In this section, we study the effect of the
aforementioned variables on the minimum mean detection
time of the system. First, we simulate the effect of the given
variables on optimal β and α . We seek to find the parameters
in support of our algorithm such as number of FFT points in
coarse and fine mode and bin sizes. Second, we present our
results in a summary table format.
We u se (20)and(21) to determine optimal α with respect
to the channel variables (such as K, SNR). The results are
documented in Figures 5 and 6. In Figure 5, we plot the
effect of the number of available fine channels K (or channel
crowding) versus the optimal α. As the channels become
crowded (i.e., K decreases), the probability of finding an idle
channel decreases which requires additional sensing time.
This phenomenon can be observed in Figure 5,whereK
becomes a dominant factor as the number of idle channel
decreases. Under the conditions shown in the figure, the
effect of K becomes less dominant when the number of fine
available bins reaches
∼700 . The slope decreases by almost a
factor of 5 between K
= 100 and K = 700.
In Figure 6, we plot the effect of SNR on choice of α.
We note that as SNR increases, the number of required
EURASIP Journal on Advances in Signal Processing 9
0
100
200
300
400
500
600
700
800
1000
1200
1400
1600
1800
2000
Number of candidate fine (K) bins
J = 2; K = 200; SNR = 0 dB; T
PLL
= 1.1 ms
N = 1024; B
crs
= 50 MHz; F
dsp
= 250 MHz
Optimal α
Optimal α versus K
Figure 5: Optimal α versus number of available fine bins.
6 8 10 12 14 16 18 20 22
0
SNR (dB)
Effect of SNR on optimal α
J = 2; K = 100; L = 50; T
pll
= 1.1ms
N = 1024; B
crs
= 50 MHz; F
dsp
= 250 MHz
Optimal α
200
400
600
800
1000
1200
1400
Figure 6: Optimal α versus SNR of received signal.
fine sensing bins decreases until it reaches the limit of our
convexity condition α
= K, which basically states that all
bins are available and may be used for CR operation. These
results support our intuition that in order to minimize the
overall scanning time, we need to perform less computation.
Since the fine bins require more computation time, we seek
to decrease the number of fine bins. That goal becomes more
palatable at high SNR value where probability of detection is
high and the probability of false alarm is low.
Similarly, we study the effect of the variables on the our
choice of β. We document our results for β in Figures 7–
9.InFigure 7, we note that the number of available coarse
bins (L)affects β in the same manner as K affected α.As
the number of available bin increases, we expect a higher
probability of detection and with a reduction in β, the overall
T
sys
decreases. In this example, we show that when there
is only 10% available bins (K
= 50 of a total of 500), we
need a large β which basically states that the bandwidth
0 50 100 150
200
250 300 350
380
400
420
440
460
480
500
520
540
Optimum β versus available coarse bins
J = 2; K = 200; SNR = 0 dB; T
PLL
= 10 ms
N = 32; B
sys
= 1 GHz; F
dsp
= 250 MHz
Optimum β
Number of available bins (L)
Figure 7: Optimal β versus available coarse channels.
0
50
100
150
200 250
300
3
4
5
6
7
8
9
10
11
J = 2; L = 3; SNR = 10 dB; T
PLL
= 100 ms
B
sys
= 1 GHz; F
dsp
= 50 MHz;
Optimum β versus number of FFT points
Optimum β
FFT points
Figure 8: Optimal β versus number of FFT points.
must be divided into small bands in order to find idle
channels.
In Figure 8, we show the number of coarse N-point FFT
calculation versus our choice of β. In this example, we set the
fine scan mode FFT points to 512. In Figure 8, the number
of bins decreases as the number of FFT points increases,
until the limit condition for convexity of β
= L is reached.
Another interpretation of the results is as the number of
FFT points increases, it becomes less viable that a 2-stage
scanning process is needed. One of the main advantages of
going to a 2-stage sensing technique is to reduce the number
of calculation by allowing a coarse mode to do a cursory
search for available channels. As the number of coarse FFT
points start to approach that of a fine sensing mode, the
advantage and effectiveness of the coarse sensing mode is
reduced.
Similar to Figure 6, the need for coarse bins decreases as
the SNR increases. The results are captured in Figure 9.One
10 EURASIP Journal on Advances in Signal Processing
10 20 30 40
0
J = 2; K = 200; L = 50; T
PLL
= 10 ms
N = 32; B
sys
= 1 GHz; F
dsp
= 250 MHz
Optimum β
Effect of SNR on optimum β
600
500
400
300
200
100
−40 −30 −20 −10 0
SNR (dB)
Figure 9: Effect of SNR on Choice of Optimal β.
Table 2:
T
sys
versus SNR.
SNR βαT
sys
(s)
15 43 998 1.57
30 40 678 1.07
60 39 589 0.938
interesting aspect of the results that was not obvious with α is
the fact that the required number of bins does not vary b elow
a given SNR (in the example below
∼−20 dB). This result is
the opposite effect of what we discussed earlier in Figure 8.
As the SNR decreases, more and more bins are needed to a
point where the coarse sensing bandwidth is small enough to
start infringing on the need for fine sensing. When the SNR
is high, the probability of detection increases, and therefore
the need for additional coarse search bins is reduced until the
limit condition of convexity β
= L is reached at which point
β can not be reduced further.
In order to better understand the sensitivity of our analy-
sis on
T
sys
, we show selected results below. The parameters
used for these simulations are T
PLL crs
= 0.5 ms, T
PLL fin
=
0.1 mlliseconds, M = 2, J = 2, and F
DSP
= 250 MHz. In
Table 1,wesetL
= 6, K = 22, N
crs
= 64, and N
fin
= 2048.
Please note that by doubling SNR from 15 to 30, the effect
on α is a 32% reduction versus a 7% on β. This discrepancy
in variation supports our earlier results. As SNR increases,
the need for bins decreases. However, the sensing time is far
greater for fine mode sensing than in coarse mode sensing.
Hence, the algorithm gives the priority to reducing α over
β which has a greater affect on
T
sys
. Recall that for time
sensitive applications, the DSR surveys the desired band of
operation, sorts and prioritizes the channels best suited for
CR operation. After the channels are identified and stored,
the DSR continuously monitors and reprioritize the channels
as needed. In order to avoid storing “stale” data in the LUT,
the overall
T
sys
must be minimized. Our goal is to optimize
T
sys
by minimizing the overall sensing time.
Table 3: T
sys
versus N
fin
.
N
fin
βαT
sys
(s)
1024 40 901 0.828
2048 40 678 1.07
4096 40 595 1.81
Table 4: T
sys
versus Available Fine Channels (K).
K βαT
sys
(s)
22 40 678 1.07
20 40 539 0.867
10 40 115 0.275
In Tabl e 2,wesetL = 6, K = 22, N
crs
= 64, and SNR = 30.
We vary the number of FFT points for the fine mode (N
fin
).
As expected, by varying the N
fin
, there is no impact on β since
it is independent of the coarse sensing, but there is a high
impact on α and
T
sys
.
As the number of FFT points increases, α decreases but
the overall
T
sys
increases. Another parameter that has a
high impact on
T
sys
is the activity in the spectrum. In our
results, we showed that as the number of available channels
decreases, we need additional bins (i.e., α increases) in order
to identify idle channels. In Tab le 3,wesetL
= 6, N
fin
= 2048,
N
crs
= 64, and SNR = 30 and we vary the K variable. Please
note that as K increases, α decreases, and
T
sys
also decreases
at a fast rate (Table 4).
In this example, the improvement on
T
sys
is drastic.
Unfortunately, K is a representation of the channel environ-
ment and it is not under user control.
5. Conclusions
In this paper, we propose the use of dedicated sensing receiver
architecture with a 2-stage sensing algorithm required for
time sensitive applications such as voice. We quantify the
effect of channel v ariables (SNR, number of idle channels,
etc.) and radio implementation parameters (PLL lock time,
N-point FFT, etc.) on the total mean detection time. We
minimize our detection time by optimizing the coarse and
fine bin sizes in our 2-stage sensing algorithm. In order
to achieve an equilibrium point, we perform a large-scale
optimization on the mean detection time with respect to
bin sizes. Coarse sensing is faster than fine sensing, however,
it is not as accurate. As the number of users in a channel
increases, the number of fine bins increases which directly
affects the total scan time. Hence, we optimize our sensing
time by striking a balance between the fast, lower accuracy
coarse detection versus the slower, more accurate fine sensing
operation.
In our future work, we will focus on adaptively allocating
the fine sensing bins with the coarse bins. In other words, we
could have a different number of fine bins for each coarse bin.
In the case of a busy spectrum, we would assign additional
fine sensing bins, but this choice of bins in the busy spectrum
band should not be perpetuated to other coarse bins when
EURASIP Journal on Advances in Signal Processing 11
the activity is a lot lower. We believe that such efforts will
further reduce the mean detection time.
Appendix
A. Proof of Convexity
Lemma 1. The sensing time as given in (18) is a convex
function of β and α.
Proof. The sensing time is given as
T
sys
α, β
=
A
crs
M · F
DSP
+
T
PLL crs
M
β +
A
crs
+ T
PLL crs
L +1
×
Je
x
(
y−1
)
β − L
+ βe
x
+
LA
fin
MF
DSP
+
L
· T
PLL fin
M
α +
A
fin
+ T
PLL fin
K +1
×
Je
v
(
y−1
)
(
α
− K
)
+ αe
v
+ T
init
.
(A.1)
In (A.1), the first and third terms are linear in α and β
and therefore convex. Let us take a closer look at the second
term. The second term corresponds to the effect of sensing in
coarse mode. It has two parts. Both parts are functions of x
and y that are defined as
x
=
π
2
A
crs
B
sys
6β · F
DSP
,
(A.2)
y
=
SNR + 1
√
1+2SNR
.
(A.3)
From (A.3), y is dependent on SNR and not on α and β,
while x is a function of β. Since 1/
√
p is convex in p, x is a
convex function with respect to β. By invoking the properties
(1) e
p
is convex if p is convex, (2) the product of a convex
function and a constant is convex, and (3) the product of two
convex functions is convex if both func tions are positive and
nondecreasing, we have the following results.
(1) The product e
x
(
y−1
)
(β
−L) is convex as long as β>L.
(2) The product βe
x
is convex as long as β>0.
Since the sum of 2 convex func tions multiplied by a constant
is convex, the second term in (A.1) is convex. Similarly, we
can show that the 4th term which represents the fine sensing
mode is also convex with respect to α as long as α>Kand
α>0. Therefore,
T
sys
(α, β)asdefinedin(A.1) is the sum
of 4 convex terms and a constant and is therefore convex as
long as (1) β>L,(2)α>K, and (3) SNR is real. All three
conditions of convexity are practical.
References
[1] XG Working Group, “The XG vision. Request for comments.
Version 2.0,” Tech. Rep., BBN Technologies, 2005.
[2] DARPA WAND Industry Day, “XG Communications Program
Overview,” Feburary 2007.
[3] D. Cabric, S. M. Mishra, and R. W. Brodersen, “Implemen-
tation issues in spectrum sensing for cognitive radios,” in
Proceedings of the 38th Asilomar Conference on Signals, Systems
and Computers, vol. 1, pp. 772–776, November 2004.
[4] A. Sahai and D. Cabric, “Spectrum sensing: fundamental
limits and practical challenges,” in Proceedings of the 1st
IEEE International Symposium on New Frontiers in Dynamic
Spectrum Access Networks (DySPAN ’05), November 2005.
[5] H. Sun, D. I. Laurenson, J. S. Thompson, and C X. Wang, “A
novel centralized network for sensing spectrum in cognitive
radio,” in Proceedings of IEEE International Conference on
Communications (ICC ’08), pp. 4186–4190, May 2008.
[6]W.Zhang,R.K.Mallik,andK.B.Letaief,“Cooperative
spectrum sensing optimization in cognitive radio networks,”
in Proceedings of IEEE International Conference on Communi-
cations (ICC ’08), pp. 3411–3415, May 2008.
[7] M. R. Musku and P. Cotae, “Time domain spectrum allocation
using game theory for cognitive radios,” in Proceedings of the
9th IFIP Internat ional Conference on Mobile and Wireless Com-
munications Networks (MWCN ’07), pp. 101–105, September
2007.
[8] H. Zamat and B. Natarajan, “Use of dedicated broadband
sensing receiver in cognitive radio,” in Proceedings of IEEE
International Conference on Communications (ICC ’08),pp.
508–512, May 2008.
[9] The Federal Communications and Commissions, FCC 04-
113 IEEE 802.22 Working Group on Wireless Regional Area
Networks, IEEE P802.22
TM
/D0.1, May 2006.
[10] ITU Recommendation G.711, “Pulse Code Modulation
(PCM) of Voice Frequencies,” ITU, November 1988.
[11] ITU Recommendation G.726, “40, 32, 24, 16 kbit/s Adaptive
Differential Pulse Code Modulation (ADPCM),” ITU, Decem-
ber 1990.
[12] ITU Recommendation G.723.1, “Speech Coders: Dual Rate
Speech Coder for Multimedia Communications Transmitting
at 5.3 and 6.3 kbit/s,” ITU, March 1996.
[13] P. De and Y C. Liang, “Blind spectrum sensing algorithms
for cognitive radio networks,” IEEE Transactions on Vehicular
Technology, vol. 57, no. 5, pp. 2834–2842, 2008.
[14] N. Sai Shankar, “Overview of blind sensing techniques con-
sidered in IEEE 802.22 WRANs,” in Proceedings of the 5th
Annual IEEE Communications Society Conference on Sensor,
Mesh and Ad Hoc Communications and Networks Workshops
(SECON ’08), pp. 1–4, June 2008.
[15] G. Ganesan and Y. Li, “Cooperative spectrum sensing in
cognitive radio—part I: two user networks,” IEEE Transactions
on Wireless Communications, vol. 6, no. 6, pp. 2204–2213,
2007.
[16] M. Matsui, H. Shiba, K. Akabane, and K. Uehara, “A coop-
erative sensing technique with weighting based on distance
between radio stations,” in Proceedings of the 14th Asia-Pacific
Conference on Communications (APCC ’08), pp. 1–4, October
2008.
[17] B. Wild and K. Ramchandran, “Detecting primary receivers
for cognitive radio applications,” in Proceedings of the 1st IEEE
International Symposium on New Frontiers in Dynamic Spec-
trum Access Networks (DySPAN ’05), pp. 124–130, November
2005.
[18] T. Y
¨
ucek and H. Arslan, “Spectrum characterization for
opportunistic cognitive radio systems,” in Proceedings of IEEE
Military Communications Conference (MILCOM ’06), pp. 1–6,
Washington, DC, USA, October 2006.
12 EURASIP Journal on Advances in Signal Processing
[19] J K. Lee, J H. Yoon, and J U. Kim, “A new spectral correla-
tion approach to spectrum sensing for 802.22 WRAN system,”
in Proceedings the Internat ional Conference on Intelligent
Pervasive Computing (IPC ’07), pp. 101–104, October 2007.
[20] P. Duhamel, “Algorithms meeting the lower bounds on
the multiplicative complexity of length-2
n
DFT’s and their
connection with practical algorithms,” IEEE Transactions on
Acoustics, Speech, and Signal Processing,vol.38,no.9,pp.
1504–1511, 1990.
[21] L. Luo and S. Roy, “Analysis of search schemes in cognitive
radio,” in Proceedings of the 4th Annual IEEE Communications
Society Conference on Sensor, Mesh and Ad Hoc Communica-
tions and Networks (SECON ’07), pp. 647–654, June 2007.
[22] F. Gardner, Phaselock Techniques, John Wiley & Sons, New
York, NY, USA, 2nd edition, 1979.
[23] V. C. Raykar, R. Duraiswani, and B. Krishnapuram, “A fast
algorithm for learning a ranking function from large-scale
data sets,” IEEE Transactions on Pattern Analysis and Machine
Intelligence, vol. 30, no. 7, pp. 1158–1170, 2008.