Clusters and Competitive Advantage_1 pot
Bạn đang xem bản rút gọn của tài liệu. Xem và tải ngay bản đầy đủ của tài liệu tại đây (202.08 KB, 24 trang )
32 Clusters and Competitive Advantage
but also by the conditions for resource supply and resource creation in its
proximate environment (Öz, 1999). We shall now look at the most relevant
debates for the purposes of this study.
Geographical unit of analysis and applicability to every context
A very interesting debate in the literature is on the most appropriate geo-
graphical unit of analysis to apply Porter’s approach. In his 1990 study, Porter
argues that many of the determinants of advantage are more similar within
a country than across countries. However, because the geographic concen-
tration of competitive industries is so important he questions whether the
country is the most appropriate unit of analysis since competitive advantage
often seems to be localized in an area within the country. International
business scholars, however, tend to take the opposite position. Regarding
the EU, for example, Dunning (1993) argues that national diamonds should
be replaced by ‘supranational diamonds’ in order to capture the true com-
petitive advantages of the EU. Jacobs and De Jong (1992), on the other
hand, argue that there is a dialectic relationship between divergence and
convergence, and concur with Porter’s (1990) idea that globalization para-
doxically leads to more emphasis on local conditions and creates an
opportunity for firms to take advantage of them. Others (for example Rugman,
1991; Hodgetts, 1993; Rugman and D’Cruz, 1993; Rugman and Verbeke,
1993) share the idea that double and/or multiple-linked diamonds would
reflect the sources of competitive advantage better than Porter’s (1990) single
diamond framework does for smaller countries that are highly dependent
on one or more of the major blocs (Europe, North America and Japan). At
the micro level the issue is further complicated by the existence of cross-border
clusters (Saner and Yiu, 2000).
Relatedly, some researchers consider that Porter’s approach cannot be
used for all countries. For instance Rugman (1991) believes that while most
of Porter’s (1990) analysis would work for managers based in the EU, the
United States or Japan, much of it could not be applied in Canada. The
main reason for this, according to Rugman, is that Porter’s study does not
incorporate the true significance of multinational activities, an issue that
will be discussed below. Similarly, in Hodgetts’s (1993, p. 44) view, ‘since
most countries of the world do not have the same economic strength or
affluence as those studied by Porter, it is highly unlikely that his model can
be applied to them without modification’. Porter’s emphasis on home markets
and local firms, according to Bellak and Weiss (1993), may be justified in
the case of large countries but is of little relevance for small ones. Narula
(1993) and Yetton et al. (1992) make a similar point when arguing that since
it is based on and applied to them, the diamond is most relevant for mature,
manufacturing-based economies and cannot be used to explain the inter-
national competitiveness of developing countries. Similarly Davies and Ellis
(2000) argue that since Porter generalizes inappropriately from the American
Clusters in the Management Literature 33
experience, developing countries are inadvertently encouraged to pursue
policies that might be harmful.
Sources of advantage: global versus local
Whether sources of advantage are local, as suggested by Porter (1990, 1998),
is another issue that has been subject to severe criticism. Porter’s (1990)
treatment of multinationals and foreign direct investment in particular has
been widely criticized. According to Rugman (1991), the narrow understanding
of foreign direct investment is a major conceptual problem with Porter’s
model. Relatedly, Davies and Ellis (2000) argue that it is not surprising that
Singapore was not included in Porter’s 1990 book, eventhough it had been
studied by him: ‘If Singapore’s prosperity were determined by the activities
of firms for whom Singapore is a home base its residents would be poor
people, but they are not.’ According to Dunning (1993), to suggest that the
competitiveness of multinationals rests only on their access to the diamond
of competitive advantage in their home countries is ludicrous, regardless of
whether or not their initial foray overseas was based on such advantages.
The geographical dimension of the criticisms of Porter’s attitude towards
FDI is the focus of a work by Lagendijk and Charles (1999), who emphasize
the importance of foreign assets in clustering and suggest that at the regional
level the issue of multinationality becomes an issue of multiregionality.
7
Rugman and Verbeke (1993, p. 72) challenge ‘Porter’s allegation that the
core competencies of large MNEs and the innovative processes occurring
within these firms necessarily need to depend upon the characteristics of
a single home base’. They argue that multinationals from small countries
may rely on a host nation to such an extent that it becomes difficult to
make a distinction between the home base and the host country or countries.
8
According to Rugman and Verbeke (2001), a major problem with Porter’s
approach is that he concentrates solely on non-location-bound, firm-specific
advantages (FSAs) developed by companies in their home country prior to
engaging in FDI, which is only one of many possible combinations that can
be observed empirically in respect of the locational determinants of competi-
tive advantage. For example one alternative is for non-location-bound FSAs
to be created jointly by subsidiaries located in various countries and
exploited throughout the network. Here we have an increasingly complex
and blurred picture of the relative contribution of FSAs versus CSAs (country-
specific advantages) and home CSAs versus host CSAs to overall multinational
competitiveness.
Another point of disagreement concerns the identification of the home
base of a multinational. According to Rugman and Verbeke (ibid.), it is
necessary to define a threshold percentage of core assets, competencies and
strategic decision-making power, below which a firm would be viewed as
functioning with several home bases. In addition, if a firm is able to enhance
its accumulated competencies through interactions with location advantages
34 Clusters and Competitive Advantage
in host countries, it will again be viewed as functioning with several home
bases. This implies that most multinationals will have several home bases,
which is in sharp contrast to Porter’s approach. It should be remembered
that Porter (1990) uses the world export shares of industries as a proxy to
measure international competitiveness at the industry level. An industry is
also considered to be competitive when domestic firms in the industry are
engaged in substantial outward FDI. With regard to inward FDI, a methodo-
logical problem arises when a country has an internationally competitive
sector (measured by world export share) that is dominated by foreign
companies. What Porter does in such cases is to try to locate the source of
advantage through in-country research. This requires determining whether
the firms in the industry operate as branches of a multinational company or
can be clearly associated with the host country. In the former case the
industry is excluded, and in the latter case it remains on the list of competitive
industries. This is confusing but logical, and the real challenge is to locate
the source of advantage.
What is even more confusing is Porter’s (1990) argument that ‘inward FDI
is not entirely healthy’, especially when examples of relatively prosperous
countries such as Singapore, Canada and Ireland, which host considerable
inward FDI, are taken into account. Dunning (1993) argues that Porter’s
interpretation of the link between FDI and competitiveness rests on the idea
that outward FDI reflects the possession of firm-specific tangible assets that
give a competitive edge prior to undertaking the FDI. While this is a valid
explanation of why individual firms are able to engage in FDI, it does not
follow that inward FDI has a negative effect on the competitiveness of the
recipient economies (Davies and Ellis, 2000). Recently Lin and Song (1997)
have taken up Dunning’s (1995) extension of the diamond framework,
which adds ‘multinational business activity’ as a determinant of competitive
advantage. Applying the model to China, Lin and Song conclude that the
country’s recent success owes much to inward FDI. Similar findings are
available for other countries, including Mexico (Hodgetts, 1993) and Singapore
(Chia, 1994). The crucial point here is that foreign investors might and do
choose competitive locations because the environment offered by a particular
industry cluster acts as a magnet for other firms in the industry, so both
national and foreign firms gravitate to favourable cluster locations even if
corporate ownership is based elsewhere.
9
This being the case, there is no reason
why inward FDI should be considered ‘unhealthy’.
In summary, many international business scholars (Rugman, 1991, 1992;
Rugman and D’Cruz, 1993; Jacobs and De Jong, 1992; Yetton et al., 1992;
Bellak and Weiss, 1993; Cartwright, 1993; Dunning, 1993; Hodgetts, 1993;
Rugman and Verbeke, 1993; Yla-Anttila, 1994) have found fault with Porter’s
(1990) insistence that firms’ ability to compete depends on the strength of
the diamond in their home base. As Davies and Ellis (2000) point out, however,
this difficulty with the diamond goes deeper than these researchers realize
Clusters in the Management Literature 35
since the argument can be extended to suggest that not only multinational
companies but also other companies that are exposed to international
influences in one way or other (for instance via exporting) may sharpen their
advantages as a result of such interactions. If, however, ‘firms in one country
are able to draw upon diamonds in another, the concept of the national
diamond is stripped of its content’ (ibid., p. 1204), since the whole concept
of the diamond is based on the hypothesis that the sources of competitive
advantage are local. Porter thinks that such criticisms mainly stem from an
unnecessary confusion: the geographic scope of competition and the geo-
graphic locus of competitive advantage are two different things. In his view,
competition can be global but the sources of advantage are local (Porter and
Amstrong, 1992). It is therefore clear that the two sides of the debate, that
is, Porter versus the international business scholars, are arguing for two
competing hypotheses: that the sources of advantage are local, or that
advantages can be sourced globally. The point made by international business
scholars, in other words, is in fact a counter-hypothesis rather than a criticism.
Needless to say the burden of proof lies on both sides when there are two
competing hypotheses, and this calls for further empirical research. This book
hopes to contribute to this by investigating not only the local circumstances
of but also the global linkages associated with the Turkish clusters.
The debate on policy issues
Another noteworthy debate focuses on regional policy issues. According to
Markusen (1996b), agglomeration effects are largest for industries that are
high-tech, knowledge-intensive, innovative and young. She implies that
developing countries need these industries because they support a higher
standard of living. Porter (1996), however, believes that this perspective
may be misleading, and that the productivity of an industry matters more
than its being high-tech. Markusen also challenges Porter’s argument that
industrial clusters are the most significant unit of analysis for investigating
regional economic advantage. According to her, this is an empirical question
and far from self-evident. As an example she cites Seattle, the dynamism of
which is explained by the presence of five distinct sectors: shipping, forestry-
related activity, aircraft, software and biotechnology (Markusen, 1996b, p. 91).
Porter agrees with Markusen’s view that the significance of generalized versus
cluster-specific agglomeration economies is an empirical question. With
regard to the Seattle example, Porter underlines that he is not suggesting
that all clusters in a regional economy have to be connected. Another major
point of divergence for the two researchers is that Markusen supports
government targeting of particular industries, which in her view is appropriate
and effective, whereas for Porter, the whole premise of targeting is flawed.
Porter and Markusen also disagree on the types of regional policy that should
be followed. Markusen favours a traditional formulation of regional policy
that includes broad incentives for firms to locate in less developed regions,
36 Clusters and Competitive Advantage
whereas Porter thinks that such measures are doomed to failure. According
to him, cluster formation can only be encouraged ‘by locating specialized
infrastructure and institutions in areas where factor endowments, past
industrial activity, or even historical accidents have resulted in concentrations
of economic activity’ (ibid., p. 88). Moreover in Porter’s view there are strong
arguments for the greater decentralization of economic policy to subnational
regions, marking yet another area in which he disagrees with Markusen.
10
Another dimension of policy issues that has been subject to debate is the
revitalization of inner-city areas.
11
Based on his approach to the locational
determinants of competitiveness, Porter (1995a) argues that this task can
only be done through private initiatives based on economic self-interest and
competitive advantage. In the associated debate in the literature, Blakely
and Small (1995) state that Porter’s analysis is incomplete, while Johnson
et al. (1995) argue that Porter has devoted too little attention to the role of
the business community in revitalizing such areas. In their view, Porter’s
assertion that the private sector – in exchange for a more business friendly
environment – will step in to fill the gap is not convincing given that this
has rarely happened in the past. Businesses need steady customers and reliable
employees, and people who are ‘ill-housed, ill-fed or just plain ill’ cannot be
either (Lowery, 1996, p. 64). Overall the critics agree that Porter’s (1995a)
approach can serve to supplement other efforts, but it can never be an all-in-
one solution or as important as affirmative action. In his reply to his critics,
Porter (1995b, p. 304) insists that many of the criticisms indicate a misun-
derstanding of his arguments. According to him, as a general principle it is
necessary to view the disadvantages suffered by inner-city areas as an economic
problem and the result of poor strategies and obsolete public policies. It is
therefore necessary to develop a new strategy for each area, tailored to its
unique characteristics and building on its advantages (ibid., p. 333).
With regard to the role of government, Porter (1990) believes that clusters
often emerge and grow naturally so there is only an indirect role for the
government. This is one of the most criticized aspects of his approach. Several
scholars (for example Stopford and Strange, 1991; Van den Bosch and de
Man, 1994; Öz, 1999) are of the opinion that in developing countries a more
active part should be played by the government as poor countries cannot
afford the luxury of letting market forces determine outcomes. In his later
work Porter (1998) continues to argue that the essential role of government
is to challenge and press industries, and that too much help can undermine
the industries’ success. A detailed discussion of the ideal level of government
intervention is beyond the scope of this study. However the discussions in
this book on the part played by the government in shaping the sources of
competitive advantage of the Turkish clusters examined may provide some
insights into to the role of government in cluster development.
37
3
Industrial Clusters in Turkey
The Turkish business environment, past and present
During the first ten years of the newly established Republic of Turkey
(1923–32), state involvement in economic activities was rather limited. This
was mainly because (1) the basic principles adopted in the Izmir Economic
Congress (1923) committed the government to the establishment of a private
enterprise economy, and (2) some economy-related provisions in the Lausanne
Treaty (1924) considerably restricted the area in which the government
could operate. For instance the country was bound to apply the Ottoman
tariffs for another five years. Over this period little was achieved in terms of
industrialization since the private sector lacked the necessary technological
competence and capital. These factors, combined with external ones such as
the Great Depression, were enough to convince the policy makers that the
private sector could not be entrusted with the task of leading the country’s
economic development. This marked the beginning of a new period (1933–45)
in Turkish economic history called ‘etatism’, during which the government
heavily intervened in the production of goods and services. The First Five
Year Industrialization Plan (1934–38) placed strong emphasis on the indus-
trialization process, particularly in the case of textiles, iron and steel. As
a result of the related policies the pace of industrialization accelerated, with
industry’s share of GNP rising from 14 per cent to 18 per cent during the
period in question (Kepenek and Yentürk, 1997).
Between the end of World War II and 1960, some attempts were made at
liberalization, shaped by a new type of etatism in which the government
supported the private sector. The transition to a multiparty regime and the
provisions of the Marshall Plan are considered to be the major reasons for
this policy shift. Significant investment in energy and motorways as well as
a boom in the housebuilding sector associated with rapid urbanization created
a considerable demand for construction firms, thus promoting the development
of the Turkish construction industry. Another feature of the period was that
special emphasis was placed on agriculture in accordance with the Marshall
38 Clusters and Competitive Advantage
Plan, which brought modern practices to the sector. The government was
clearly committed to encouraging the private sector and therefore pursued
pro-business policies. However this fostered rent-seeking activities, which
subsequently became an increasingly deep-rooted problem. Interestingly, since
the pro-business policies did not bring stability, both politicians and business
people started to question whether it was possible to achieve stability and
liberalization at the same time. In this respect it is worth mentioning that
even Prime Minister Menderes, who was very sceptical about planning, had
a change of mind and took certain steps to prepare a development plan in
his last year in office, prior to the military intervention in 1960.
The disappointing results of liberalization, together with the tendency else-
where in the world for greater government intervention, caused the military
government of the early 1960s to introduce a 20-year import-substitution
development strategy for a mixed economy, to be implemented via five-year
plans. During this period there were improvements in the growth rate of
overall output and industrial production. Big businessmen were also in favour
of a planned approach and stressed the importance of having a long-term
economic strategy to reduce the uncertainty in the economic environment.
The need to clarify the boundaries of private sector activity was another
factor in this. The sense of responsibility felt by the newly emerging bour-
geoisie for the economic development process resulted in the establishment
of influential business associations such as TÜSIAD (Bugra, 1994).
The period 1960–80 was a time of unusual political turmoil and there were
three military interventions (in 1960, 1971 and 1980). After these interven-
tions, concern about the position of the private sector was soon replaced by
concern about the instability generated by the regimes’ macroeconomic
policies. In the 1970s two additional developments, the oil shock and the
Cyprus crisis, exacerbated the already bleak scene. The coincidence of an
unfavourable global economic environment with the political instability in
Turkey led the country into a major crisis in the late 1970s, resulting in
another military takeover in 1980. In that year the ‘January 24 Resolutions’
introduced a comprehensive stabilization programme under the auspices of
the IMF and the World Bank. The structural adjustment policies adopted in
accordance with the programme were intended to shift the economy from
an inward to an outward orientation, with an emphasis on export-led growth.
Reforms were conducted in a number of key areas, one of which was trade
policy, with the introduction of extensive export promotion measures and
the gradual liberalization of imports. The results were impressive in terms of
exports in general and manufactured exports in particular, although the
increase in exports was matched by a boom in imports (Öz, 1999).
In the second half of the 1980s there was a considerable reduction in
export subsidies. Tariffs and quotas, and therefore the level of import
protection, were also reduced. With the unexpected but comprehensive finan-
cial liberalization achieved by making the Turkish lira convertible in 1989,
Industrial Clusters in Turkey 39
the main policies of the liberalization programme were completed. The
immediate result was a worsening of the trade deficit, mainly stemming from
the increase in imports rather than a decrease in exports, which actually
continued to increase gradually (Figure 3.1) and Turkey’s world export share
remained fairly stable.
It is argued that the frequent and unexpected changes to key policies
created a chaotic business environment in Turkey in the 1980s and 1990s
(Bugra, 1994). Under the circumstances it was essential for business people
to have good state contacts so that they would at least have a vague idea
about what was going on. In fact, they often complained not about the
changes themselves but about the way they were handled. What was worse,
however, was that such an environment offered considerable opportunities for
abuse. Allegations about tax rebates for exports, for instance, caused some
scholars to question the export success achieved by Turkey in the post-1980
period, and to ask whether the export figures were fictitious (see Arslan and
van Wijnbergen, 1990).
While the 1980s are associated with major reforms, the 1990s are often
considered ‘lost years’ in Turkish economic history (Kumcu and Pamuk, 2001).
With regard to the key events that shaped the 1990s, the first was the Gulf
crisis in the beginning of the period, which damaged Turkey’s economic
relations with Iraq. In 1994 Turkey faced yet another economic crisis, due
mainly to mismanagement of a programme to reduce interest rates. The
customs union between Turkey and the EU, which had been in effect since
January 1996, brought challenges as well as opportunities for Turkish industry.
0
10 000
20 000
30 000
40 000
50 000
60 000
1982
1983
1984
1985
1986
1987
1988
1989
1990
1991
1992
1993
1994
1995
1996
1997
1998
1999
2000
Exports
Imports
Figure 3.1 Exports and imports, Turkey 1982–2000 (US$ 000s)
Sources: SIS (2000); ITC (2002).
40 Clusters and Competitive Advantage
Towards the end of the decade the Asian crisis broke out, affecting many
parts of the world. The impact of this on the Turkish economy was indirect
and occurred after a one-year lag, but the Russian crisis caused considerable
damage to the construction and leather sectors, whose main trading partner
was Russia. In 2000 the government introduced a disinflationary programme,
but this collapsed in February 2001. Finally, Turkey implemented yet another
stabilization programme, under the auspices of the IMF and the World Bank
and aimed at ‘empowering the Turkish economy’.
Turkey is classified by the World Bank as a middle-income developing
country. It has close ties with the EU, including a customs union agreement.
It occupies a very advantageous geographical position, constituting a natural
link between West and East, and recently it has started to take greater
advantage of this, especially in respect of trade and tourism. Turkey’s standard
of living, as measured by GDP per capita, has gradually increased (Figure 3.2)
but is still rather low at US$ 2200–6080, based on purchasing power parity
(PPP) (2001 figures, SPO, 2002). The average annual growth rate of the
economy, as measured by the rate of growth of real GDP, on the other hand,
averaged about 4 per cent in the post-liberalization period. This rate, though
fluctuating widely, was slightly above the average attained by middle-income
countries (around 2–3 per cent) during the same period (World Bank, 1999).
However, although overall domestic production and per capita income have
been increasing at above average rates compared with other middle-income
developing countries, inequalities in income distribution remain significant.
Persistently high inflation rates and external debts, when taken together
with Turkey’s ‘grey’ economy, present a bleak outlook for the country’s
macroeconomic future. This is further complicated by the continuing political
uncertainty. Such an environment is preventing firms from improving their
0
1000
2000
3000
4000
5000
6000
7000
1980
1981
1982
1983
1984
1985
1986
1987
1988
1989
1990
199
1
1992
1993
1994
1995
19
9
6
1997
1998
1999
200
0
2001
GDP per capita GDP per capita (PPP)
Figure 3.2 Standard of living, Turkey, 1980–2001 (US$)
Source: SPO (2002).
Industrial Clusters in Turkey 41
competitive advantages. Given this picture it is not surprising that Turkey
has failed to attract much FDI, the annual average being less than US$ 1 billion
in recent years, a figure that compares unfavourably with those achieved by
other emerging economies (SPO, 2002).
An examination of the broad characteristics of the Turkish business envir-
onment shows that small and medium-sized enterprises account for more than
90 per cent of Turkish firms, but larger firms’ contribution to value-added
and exports are much higher (Taymaz, 1997). Big corporations are a rela-
tively new phenomenon in Turkey: of the 405 TÜSIAD member companies,
only 22 were incorporated before 1950 (Bugra, 1994, p. 55). The 1950s were
an important decade for many of the largest Turkish companies, reflecting
the government’s shift to more liberal policies. Many of today’s leading
Turkish construction firms, for example, were either established or made an
important turn in their business during that decade (Öz, 1999).
Family-dominated management of firms of all sizes is a common phenome-
non in Turkey as there is a lack of confidence in salaried managerial personnel.
Educating young members of the family in top universities, integrating a
professional manager into the family via marriage, and strong relationships
established over the years between family members and professional managers,
making the latter ‘part of the family’, appear to be common ways of achieving a
delicate balance between professionalization and family control (Bugra, 1994).
According to Bugra (ibid., pp. 68–9), all Turkish business tycoons have
certain characteristics in common, including family support in commercial
activities at the start of their career, the arbitrary – and rather opportunistic –
choice of their initial area of activity, heavy engagement in unrelated diver-
sification as the business grows, and good connections especially in state
circles. Rent-seeking behaviour is common, and real-estate speculation is
particularly widespread.
The high degree of state involvement in business activity, be it in the form
of subsidized credits, input supply or output demand, has been detrimental
to the Turkish business environment. Given the key role of government in
the economy, good connections in government circles have contributed
significantly to business success. The slow bureaucracy and unexpected
changes in key policies, on the other hand, have caused problems for Turkish
business people.
Turkey’s position in international competition
This section provides an overview of the evolution of the competitive struc-
ture of Turkish industry. The analysis is conducted with the help of Porter’s
(1990) methodology. The basic measure used to determine the international
competitiveness of an industry is its share of world exports, which is defined
as a country’s exports for an industry divided by total world exports for that
industry in a given year. All industries defined in the Standard International
42 Clusters and Competitive Advantage
Trade Classification (SITC) are then sorted by world export share at the lowest
possible level of disaggregation (in five-digit detail). Next the cut-off rate is
calculated by dividing the total exports of a country by total world exports.
Those industries which have world export shares above the cut-off rate con-
stitute the relatively more competitive industries of the country. The list of
these industries is then modified according to additional criteria. For example,
industries with a world export share that lies between the cut-off rate and
twice its value are checked to exclude ones with a negative trade balance.
Also, industries that are among the top fifty in terms of their country’s export
share (which is defined as the share of an industry in the country’s total
exports) but below the cut-off rate in terms of their world export share are
included in the list of relatively more competitive industries, provided they
have a positive trade balance. If there is considerable outward foreign direct
investment in an industry, this industry is also included in the list. Finally,
with the addition of the internationally competitive service sectors the list is
completed for that particular year and country (Öz, 1999).
The list of competitive industries is used to produce cluster charts. These
reveal the connections between and interrelationships amongst the country’s
competitive industries, and hence the country’s competitive pattern. All com-
petitive industries are classified into three broad groupings, each of which
includes different clusters. The first group consists of ‘upstream industries’,
whose primary products are inputs to the products of other industries. The
clusters included in this category are semiconductors/computers, materials/
metals, petroleum/chemicals and forest products. The second group, ‘industrial
and supporting functions’, comprises clusters of multiple businesses, trans-
portation, power generation and distribution, office, telecommunications, and
defence. The last group is ‘final consumption goods and services’, which
contains the food/beverage, textiles/apparel, housing/household goods, health
care, personal, and entertainment/leisure clusters. The industries in each cluster
are further classified into four groups, revealing the vertical relationships
among industries and the depth of national clusters. These four groups are
primary goods, the machinery used to produce these goods, the special inputs
required and the related service industries (Öz, 1999).
We shall now apply the above methodology to recent data on Turkish indus-
tries. Table 3.1 shows the percentage of exports by cluster and vertical position
in 1992–2000. Turkey’s share of world exports in 2000 was 0.52 per cent,
and six clusters of industries had a share above that figure, namely materials/
metals (from the upstream industries group), food/beverages, textiles/apparel,
housing/household, personal and entertainment/leisure (all from the final
consumption goods and services group). Of these, textile/apparel had the
highest share with an impressive 2.4 per cent. Turkey exports a great variety
of items in this category, mainly primary goods and special inputs. The
importance of the cluster for the Turkish economy is considerable, given that it
accounts for around 37 per cent of the country’s total exports. While it has
43
Table 3.1 Percentage of Turkish exports by cluster and vertical position, 1992–2000
Notes: SC share of country’s total exports (2000); CSC change in share of country’s exports (1992–2000); SW share of world cluster exports (2000);
CSW change in share of world cluster exports (1992–2000).
Materials/Metals Forest products
Petroleum/Chemicals Semiconductors/Compu
ters
Upstream
industries
SC CSC SW CSW SC CSC SW CSW SC CSC SW CSW SC CSC SW CSW SC SW
Primary goods 8.3 3.4 0.8 0.1 0.3 0.3 0.0 0.0 1.6 0.2 0.1 0.0 0.0 0.0 0.0 0.0 10.0 0.2
Machinery 0.2 0.2 0.1 0.1 0.0 0.0 0.0 0.0 0.0 0.0 0.0 0.0 0.0 0.0 0.0 0.0 0.2 0.1
Special inputs 0.5 0.5 0.4 0.4 0.0 0.0 0.0 0.0 0.0 0.0 0.0 0.0 0.0 0.0 0.0 0.0 0.5 0.3
Total 9.0 2.7 0.6 0.1 0.3 0.3 0.0 0.0 1.6 0.2 0.1 0.0 0.0 0.0 0.0 0.0 10.7 0.2
Multiple businesses Transportation
Power generation
& distribution Office Telecommunications Defence
Indus. &
support
functions
SC CSC SW CSW SC CSC SW CSW SC CSC SW CSW SC CSC SW CSW SC CSC SW CSW SC CSC SW CSW SC SW
Primary goods 0.2 0.2 0.0 0.0 3.7 2.5 0.2 0.1 2.3 0.7 0.2 0.1 0.0 0.0 0.0 0.0 0.0 0.0 0.0 0.0 0.1 0.1 0.2
0.2 6.3 0.1
Machinery 0.2 0.2 0.1 0.1 0.0 0.0 0.0 0.0 0.0 0.0 0.0 0.0 0.0 0.0 0.0 0.0 0.0 0.0 0.0 0.0 0.0 0.0 0.0 0.0 0.2 0.1
Special inputs 0.0 0.0 0.0 0.0 1.2 0.3 0.2 0.1 0.0 0.0 0.0 0.0 0.0 0.0 0.0 0.0 0.0 0.0 0.0 0.0 0.0 0.0 0.0 0.0 1.2 0.2
Total 0.4 0.4 0.0 0.0 4.9 2.8 0.2 0.1 2.3 0.7 0.2 0.1 0.0 0.0 0.0 0.0 0.0 0.0 0.0 0.0 0.1 0.1 0.2 0.2 7.7 0.1
Food/Beverage Textiles/Apparel Housing/Household Health care Personal
Entertainment/
Leisure
Final
consumption
goods &
services
SC CSC SW CSW SC CSC SW CSW SC CSC SW CSW SC CSC SW CSW SC CSC SW CSW SC CSC SW CSW SC SW
Primary goods 9.7 6.9 0.9 0.1 33.1 1.6 2.7 0.7 7.5 2.7 0.9 0.4 0.2 0.2 0.0 0.0 2.0 2.0 0.5 0.5 3.1 1.4 0.6 0.5 56.0 1.2
Machinery 0.3 0.3 0.2 0.2 0.0 0.0 0.0 0.0 0.0 0.0 0.0 0.0 0.0 0.0 0.0 0.0 0.0 0.0 0.0 0.0 0.0 0.0 0.0 0.0 0.3 0.2
Special inputs 0.6
2.5 0.2
0.4 3.4 0.2 1.6 1.0 0.8 0.6 0.3 0.4 0.0 0.0 0.4 0.4 1.3 0.7 1.2 1.8 0.0 0.0 0.0 0.0 6.1 0.7
Total 10.6 9.1 0.7 0.1 36.5 1.8 2.4 0.9 8.3 2.1 0.8 0.3 0.2 0.2 0.0 0.0 3.3 1.3 0.6 0.3 3.1 1.4 0.6 0.5 62.4 1.1
44 Clusters and Competitive Advantage
always been important in terms of world market share its performance
improved remarkably after liberalization (Öz, 1999). The second most
important cluster is housing/household goods, which includes a variety of
processed products and some special inputs. Turkey’s strong position in
carpets, glass, ceramics and cement products is especially noteworthy. With
regard to the food/beverages cluster, Turkey holds significant positions at
all vertical stages, including related machinery, although primary goods
dominate. Within the primary goods category there has been a move
towards processed foods. The materials/metals cluster holds the highest world
export share in the primary goods category, together with special inputs and
machinery. Competitive industries in the entertainment/leisure cluster, on
the other hand, exclusively produce primary goods and have virtually no
presence in other vertical categories. Despite the considerable rise in this
category’s position in the world market in the 1990s, the range of competitive
industries in the cluster is rather limited. The personal cluster has a different
structure from the ones outlined above as its strength mainly lies in special
inputs. In fact a single item, unprocessed tobacco, is largely responsible for
the high export share of the cluster. Thus like the entertainment/leisure
industry, the personal industry is hardly a strong contributor to the Turkish
economy.
In addition to these six leading clusters, some competitive positions are
held in the transportation, power generation and distribution, and defence
clusters, although their world export shares are rather low at around
0.2 per cent. Turkey’s position is weak in categories such as forestry products,
semiconductors/computers, multiple businesses, office, telecommunications
and health care. Finally, there have been a few isolated successes, such as that
by the construction services sector in the otherwise uncompetitive multiple
business cluster.
1
The most striking finding of the examination of the competitive structure
of Turkish industry over time is that there has been little change in terms of
the types of industry in which Turkey is internationally competitive.
Although it increased its overall exports after the 1980 liberalization and
improved its strength in the existing clusters, it failed to establish itself in
other ones. As a result the economy still depends on four major clusters:
materials/metals, textiles/apparel, food/beverages and housing/household
goods. Turkey also has a strong advantage in primary goods and to as lesser
degree in special inputs, but its position in the machinery category is rather
weak (Öz, 1999).
Although some improvement can be observed in a few additional clusters
(Table 3.1) it would be premature to assert that these will join the four
major clusters. Three of the four leading clusters (textiles/apparel, food/
beverages and housing/household goods) are in the final consumption
goods and services group, where a concentration of competitive industries is
considered typical for a developing country.
Industrial Clusters in Turkey 45
Geographic concentration of Turkish industries
In the previous section we looked at patterns of export competitiveness in
Turkish industry, outlining the changes that have taken place over time. We
shall now switch our focus to the location of industries and investigate
which are concentrated spatially, and where they are concentrated. First,
however, we shall discuss the methodology that will be followed to identify
geographic clusters.
Identification of geographic clusters
This subsection reviews alternative approaches to identifying clusters. One
well-known index is the Gini coefficient, which compares a distribution
against a profile. When the profile represents a country the coefficient is
called the ‘coefficient of localization’. The ‘location quotient’ is another
frequently used measure of spatial concentration. This linear scale transform-
ation is obtained by dividing each occurrence by a constant, enabling the
occurrences to be compared against a norm (Üser, 1983). The range of the
quotients indicates the relative degree of concentration of a certain activity
in a region.
2
Enright (1990) has adapted the indices used to measure industrial concen-
tration in the literature on industrial organization. Accordingly, C4EMP and
C8EMP are defined as the shares of employment in the leading four and
leading eight provinces in a given industry.
3
Enright warns that these indices
record clusters of firms that are spread across provincial borders as two
different clusters, thus understating the extent of geographic concentration.
However it would be wrong to merge the provinces in question as this
would render the indices non-comparable (ibid., pp. 4–9).
Ellison and Glaeser (1994, 1997) propose a ‘dart-board approach’, which
is based on a dart-throwing metaphor. The term localized is used to describe
industries whose degree of concentration goes beyond that which would
have prevailed if firms had chosen the locations of their plants in a
completely random manner. Ellison and Glaeser’s main index measures
concentration of employment, adjusted for the plant size. The method,
however, requires a substantial data filling procedure necessitated by the
limitations of census data. Maurel and Sedillot (1999) offer a slightly different
index that measures the location decisions of two business units in the
same industry.
4
Midelfart-Knarvik etal. (2000, p. 2) offer another measure of spatial dis-
persion that takes into account the relative locations of clusters of industries.
In their comprehensive analysis of the location of European industry, they
first investigate the degree of specialization in EU countries. For each country
they calculate the share of industry k in that country’s total manufacturing
output. Next they calculate the share of the same industry in the production
of all other countries. It is then possible to measure the difference between
46 Clusters and Competitive Advantage
the industrial structure of a country and all other countries by taking the
absolute values of the difference between these shares, summed over all
industries. They call this the Krugman specialization index (following
Krugman, 1991a). It takes the value of zero if country i has an identical
industrial structure to the rest of the EU, and the maximum value two if it
has no industries in common with the rest of the EU. They calculate this
as a four-year moving average for the period 1970–97 to remove spurious
fluctuations due to the differential timing of country and sectoral business
cycles. Next they use the Gini coefficient of concentration of the variables
for all manufacturing to measure the concentration of manufacturing
industries in the EU. Like Enright (1990), Midelfart-Knarvik et al. (2000)
discuss the challenges imposed by geographic boundaries when measuring
concentration. With their index, two industries may appear to be equally
geographically concentrated, when in fact one is predominantly located in
two neighbouring countries and the other is split between two geographically
separated countries. Since distinguishing such patterns can provide additional
insights, they propose ‘an index of spatial separation’, which can be thought
of as a supranational index of geographic location, as a complement to the
traditional concentration indices (ibid., p. 28). The spatial separation index
incorporates a measure of the distance between two locations. It should be
noted that Midelfart-Knarvik et al.’s units of analysis are countries (rather
than provinces) within a supranational entity – that is, the EU – which works
to their advantage in terms of the availability of detailed time-series data.
Among the many other ways of measuring geographic concentration are
‘nearest neighbour’ analysis, which takes account of the spatial separation
of the observed units; general harmonic mean distance variation, which
measures the concentration of each sector in respect of the spatial distribution
of employment among provinces, calculated as the average distance
between the occurrences; and peak potential, which measures the average
distance from the occurrences to their peak potential. Feser and Bergman
(2000) have developed a ‘spatial-economic test’, which uses a case control
design to test whether certain types of manufacturing firm are more spatially
concentrated than might be expected given the general geographic pattern
of all firms in the locale. All plants in a given industry are used as a case, and
a matched sample of all other manufacturing firms is used as a control. The
difference in concentration between the two, measured by means of standard
statistical geography techniques, provides evidence of spatial concentration
or dispersion at different spatial scales for the firms in the cluster (ibid.,
pp. 258–9). Finally, Shilton and Stanley (1999) use a modified form of the
location quotient, designated as the ‘growth quotient’.
It is obvious from the above discussion that there is no consensus in the
literature on the best means of measuring geographic concentration. This
study will use the concentration indices proposed by Enright (1990), supported
by location quotients (LQs). Data-related considerations, comparability
Industrial Clusters in Turkey 47
across industries and ease of interpretation favour the use of these indices.
Moreover some of the alternative indices are designed in such a way that an
industry is not considered to be localized if employment is concentrated
in a small number of plants. This approach underestimates the localization
of oligopolistic industries (such as the automotive industry in Detroit),
which are as interesting as small firm concentrations for the purposes of the
present study.
5
It should be noted that problems can emerge if a purely statistical
approach is used to identify geographic concentration (Brusco et al., 1996).
This is mainly because the definition of clusters itself is not easily quantifiable,
given that it involves social relations and value systems as well as production
relations. Consequently a purely statistical approach can fail to spot places
that are clearly concentrated, the most typical example being Silicon Valley.
In fact many of the indices cited above have failed to identify the concentra-
tion in Silicon Valley due to the absence of the finely detailed data required
to uncover this cluster statistically. Qualitative evaluations should therefore
be used to complement the quantitative measures.
Identifying the boundaries of a cluster is another crucial issue since industrial
clusters do not necessarily conform to political boundaries, as emphasized by
Padmore and Gibson (1998, p. 627): ‘A successful cluster may crowd into one
corner of a province, span several cities and suburbs, or straddle an inter-
national border.’ Saner and Yiu’s (2000) study of a cluster in the Upper Rhine
Valley region, which encompasses neighbouring provinces in Switzerland
(Basle), France (Alsace) and Germany (Baden), is an illustrative case in this
respect. The ceramic goods cluster spanning the border between the provinces
of Kütahya and Bilecik in Turkey is another example. It is also possible for
a cluster to enlarge over time and spread into neighbouring provinces, as
has happened with the textile cluster in Gaziantep, which has extended
north-westward to reach Kahramanmaras. The choice of geographic unit of
analysis is further complicated by the fact that provinces can differ substan-
tially in size and population. Despite these concerns, the most appropriate
geographic unit of analysis for the present study is still the province, since
the data are fairly complete at the provincial level for Turkey.
Defining the scope of a cluster in terms of the industries it embodies is
equally difficult since the distinction between cluster firms on the one hand
and related and supporting firms on the other can be fuzzy. In general a
narrow definition is preferred since in a broadly defined cluster, linkages are
likely to be less strong and less complete. In the end there should indeed
be a limit before the cluster is defined as ‘the whole economy’. Otherwise, in
the extreme case, it would be possible to define a cluster encompassing the
whole economy (Padmore and Gibson, 1998, p. 630). Enright (1990, pp. 4–3)
also argues that highly aggregated classifications cannot be used to develop
an index of geographic concentration since the true pattern is distorted by
aggregation, which tends to ‘average out’ industry location. Such concerns
48 Clusters and Competitive Advantage
clearly favour a disaggregated data set, so this study uses a data set that
covers all Turkish industries at the four-digit (ISIC) level. A summary of the
results is presented in the next section.
6
Spatial patterns in Turkish industry
In the present study,
7
geographic concentration indices (C4EMP, C8EMP
and LQs) are calculated for all Turkish provinces and the 231 sectors for
which the necessary data are available at the four-digit level.
8
The top 100
Turkish industries, as ranked by the C4EMP indices, are listed in Table 3.2,
while Table 3.3 lists the 25 least geographically concentrated Turkish indus-
tries.
9
Since it is not possible to include the full list of the LQs calculated for
all industries and provinces due to space limitations, only the top five
industries are reported for each province (see Appendix 1). However the full
list of LQs that are greater than 1 will be presented for the provinces and
clusters chosen for detailed examination in each of the relevant chapters.
Finally, Tables 3.4 and 3.5 show the proportion of the total Turkish population
in the four (C4POP) and eight (C8POP) most populated provinces, plus the
cumulative totals. The population figures provide a base line to compare the
geographic concentration of Turkish industry.
Analysis of the information provided in the tables shows that on average
Turkish industries are far more geographically concentrated than is the
population (with a p value of 0.0191). If the C4EMP and C4POP values are
compared, it can be seen that 225 of the 231 industries are more geograph-
ically concentrated than is the population. A comparison of Table 3.2 and
Table 3.3 provides some rough information on the nature of the most and
least geographically concentrated industries. Among the highly concentrated
industries are those dominated by a small number of firms, such as the
manufacture of tobacco products, which is located in a single province
(Izmir). The manufacture of watches and clocks (Eskisehir) and financial
intermediation (Istanbul) are highly concentrated despite there being a
larger number of firms. Among the least concentrated industries are whole-
saling and retailing, plus restaurants, hairdressers, the manufacture of cement
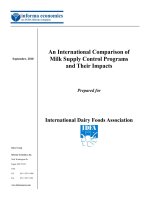
and builders’ carpentry. Figure 3.3 shows a selected number of highly
concentrated industries.
To conclude this section we shall briefly review the evolution of indus-
trial activity in Turkey. In the 1970s the growth rate attained in the less
developed regions of eastern Turkey remained below the national average,
whereas those achieved in the relatively more developed parts of the coun-
try enjoyed a rise. In this decade the Istanbul metropolitan area accounted
for almost 45 per cent of national employment, while the relevant figures
for the Izmir, Adana and Ankara metropolitan areas were 11 per cent,
5.5 per cent and 5.5 per cent respectively (Eraydin, 2002a).
10
In the more
liberal environment that prevailed in the 1980s, Istanbul enhanced its
position as the top location of choice for Turkish industrial establishments,
49
Table 3.2 Top 100 Turkish industries, by C4EMP
Rank ISIC Industry CR4EMP
1 1010 Mining and agglomeration of coal 1.0000
2 1030 Extraction and agglomeration of peat 1.0000
3 1542 Manufacture of sugar 1.0000
4 1600 Manufacture of tobacco products 1.0000
5 2213 Publishing of recorded media 1.0000
6 2421 Manufacture of pesticides and other agrochemical products 1.0000
7 2430 Manufacture of man-made fibres 1.0000
8 3710 Recycling of metal waste and scrap 1.0000
9 4020 Manufacture of gas; distribution of gaseous fuels 1.0000
10 4550 Hiring out of construction or demolition equipment 1.0000
11 5251 Retail sale via mail order houses 1.0000
12 6210 Scheduled air transport 1.0000
13 6591 Financial leasing 1.0000
14 7122 Hiring out of construction and civil engineering machinery 1.0000
15 7413 Market research and public opinion polling 1.0000
16 7495 Packaging activities 1.0000
17 8022 Technical and vocational secondary education 1.0000
18 6412 Courier activities other than the national postal service 0.9935
19 7492 Investigation and security activities 0.9921
20 7230 Data processing 0.9906
21 3330 Manufacture of watches and clocks 0.9880
22 7320 Research on and experimental development of SSH (Social Sci-
ences and Humanities)
0.9744
23 6599 Other financial intermediation n.e.c. (not elsewhere classified) 0.9715
24 7422 Technical testing and analysis 0.9712
25 3150 Manufacture of electric lamps and lighting equipment 0.9677
26 7111 Hiring out of land transport equipment 0.9630
27 5190 Other wholesale 0.9613
28 7220 Software consultancy and supply 0.9570
29 6712 Security dealing activities 0.9569
30 6110 Sea and coastal water transport 0.9565
31 6220 Non-scheduled air transport 0.9535
32 2310 Manufacture of coke oven products 0.9500
33 9211 Motion picture and video production and distribution 0.9447
34 3220 Manufacture of television and radio transmitters, etc. 0.9356
35 3000 Manufacture of office and computing machinery 0.9353
36 2412 Manufacture of fertilizers and nitrogen compounds 0.9333
37 5150 Wholesale of machinery, equipment and supplies 0.9321
38 6420 Telecommunications 0.9265
39 3694 Manufacture of games and toys 0.9264
40 7290 Other computer-related activities 0.9264
41 9213 Radio and television activities 0.9262
42 3320 Manufacture of optical and photographic equipment 0.9225
43 1110 Extraction of crude petroleum and natural gas 0.9156
44 7210 Hardware consultancy 0.9146
45 2927 Manufacture of weapons and ammunition 0.9099
46 1712 Finishing of textiles 0.9092
47 1730 Manufacture of knitted and crocheted fabrics and articles 0.9086
50
Table 3.2 (Continued)
Rank ISIC Industry CR4EMP
48 6719 Activities auxiliary to financial intermediation n.e.c. 0.9065
49 9303 Funeral and related activities 0.9032
50 8021 General secondary education 0.8900
51 1723 Manufacture of cordage, rope, twine and netting 0.8851
52 5131 Wholesale of textiles, clothing and footwear 0.8796
53 2423 Manufacture of pharmaceuticals, medicinal chemicals etc. 0.8780
54 1912 Manufacture of luggage, handbags etc. 0.8775
55 2892 Treatment and coating of metals; mechanical engineering 0.8710
56 8010 Primary education 0.8701
57 3693 Manufacture of sports goods 0.8675
58 3130 Manufacture of insulated wire and cable 0.8657
59 3512 Construction and repair of pleasure and sporting boats 0.8642
60 6601 Life insurance 0.8618
61 2919 Manufacture of general purpose machinery 0.8602
62 3691 Manufacture of jewellery and related articles 0.8506
63 7414 Business and management consultancy activities 0.8503
64 3210 Manufacture of electronic valves, tubes etc. 0.8500
65 1711 Preparation and spinning of textile fibres 0.8463
66 9220 News agency activities 0.8401
67 1820 Dressing and dyeing of fur; manufacture of fur articles 0.8396
68 3230 Manufacture of television and radio receivers, etc. 0.8383
69 7010 Real estate activities with own or leased property 0.8381
70 2413 Manufacture of plastics in primary form 0.8342
71 2101 Manufacture of pulp, paper and paperboard 0.8338
72 3699 Other manufacturing n.e.c. 0.8330
73 7493 Building cleaning activities 0.8323
74 2912 Manufacture of pumps, compressors, taps and valves 0.8288
75 2109 Manufacture of articles of paper and paperboard 0.8275
76 5142 Wholesale of metals and metal ores 0.8232
77 2102 Manufacture of corrugated paper, paperboard etc. 0.8225
78 3110 Manufacture of electric motors, generators and transformers 0.8183
79 6120 Inland water transport 0.8165
80 6304 Travel agencies, tour operators etc. 0.8163
81 1310 Mining of iron ore 0.8094
82 5149 Wholesale of intermediate products, waste and scrap 0.8094
83 3592 Manufacture of bicycles and invalid carriages 0.8066
84 7430 Advertising 0.8059
85 3312 Manufacture of instruments for measuring etc. 0.8056
86 2610 Manufacture of glass and glass products 0.7964
87 2926 Manufacture of machinery for textile and leather production 0.7883
88 1532 Manufacture of starches and starch products 0.7879
89 3190 Manufacture of other electrical equipment n.e.c. 0.7859
90 3591 Manufacture of motorcycles 0.7851
91 2422 Manufacture of paints, varnishes etc. 0.7829
92 5139 Wholesale of other household goods 0.7786
93 2929 Manufacture of other special purpose machinery 0.7782
94 2923 Manufacture of machinery for metallurgy 0.7769
95 2922 Manufacture of machine tools 0.7759
Industrial Clusters in Turkey 51
whose export orientation increased enormously. In general, regions that
could survive the test of international competition prospered, while the
less developed areas became even less attractive. In the 1990s the share of
the Istanbul metropolitan area in national employment rose to almost
50 per cent and, as could be expected, diseconomies of urbanization began to
emerge. As a result, export-oriented industries chose to move to nearby
areas – Tekirdag in particular. In the last two decades, several new loca-
tions, including Denizli, Gaziantep, Kayseri, Konya and Çorum, have
attained impressively high growth rates. Overall, however, Istanbul and its
96 2511 Manufacture of rubber tyres and tubes 0.7704
97 2913 Manufacture of bearings, gears, gearing and driving elements 0.7703
98 2732 Casting of non-ferrous metals 0.7688
99 4520 Building of complete constructions or parts; civil engineering 0.7661
100 6309 Activities of other transport agencies 0.7641
Table 3.3 The least concentrated Turkish industries, by C4EMP
Rank ISIC Industry CR4EMP
1 5520 Restaurants, bars and canteens 0.3959
2 5232 Retail of textiles, clothing, footwear and leather goods 0.3892
3 5220 Retail of food, beverages and tobacco in specialist shops 0.3851
4 5233 Retail of household appliances, articles and equipment 0.3830
5 9302 Hairdressing and other beauty treatments 0.3745
6 2811 Manufacture of structural metal products 0.3743
7 5234 Retail of hardware, paint and glass 0.3657
8 7494 Photographic activities 0.3615
9 2930 Manufacture of domestic appliances n.e.c. 0.3580
10 1533 Manufacture of prepared animal feeds 0.3545
11 5260 Repair of personal and household goods 0.3459
12 2695 Manufacture of concrete, cement and plaster articles 0.3397
13 2921 Manufacture of agricultural and forestry machinery 0.3278
14 5211 Non-specialized retail shops 0.3270
15 8520 Veterinary activities 0.3168
16 2010 Sawmilling and planing of wood 0.3122
17 1541 Manufacture of bakery products 0.3095
18 5020 Maintenance and repair of motor vehicles 0.3093
19 5050 Retail of automotive fuel 0.3018
20 5040 Sale, maintenance and repair of motorcycles and parts 0.2967
21 6022 Non-scheduled passenger land transport 0.2780
22 1410 Quarrying of stone, sand and clay 0.2589
23 1531 Manufacture of grain mill products 0.2547
24 4010 Production, collection and distribution of electricity 0.2542
25 2022 Manufacture of builders’ carpentry and joinery 0.2026
52 Clusters and Competitive Advantage
environs have historically been the leading location for industrial activity in
Turkey, followed by Izmir, Ankara, Bursa and Adana. In fact the geographical
concentration of economic activity in major metropolitan areas and regional
centres has become more pronounced in recent years (ibid.).
Geographic concentration and competitiveness
Although the information provided in Tables 3.1–3.3 is helpful, a more
detailed analysis is needed to establish a link between geographic concentration
and international competitiveness. Our data set has allowed us to conduct
simple statistical tests to investigate whether internationally competitive
Table 3.4 The most populated Turkish provinces
Province Population Share of total
Istanbul 7195773 0.127420
Ankara 3236378 0.057308
Izmir 2694770 0.047718
Konya 1752658 0.031035
Adana 1549233 0.027433
Bursa 1546327 0.027382
Içel 1267253 0.022440
Samsun 1161207 0.020562
Manisa 1154418 0.020442
Antalya 1132211 0.020049
Hatay 1109754 0.019651
Diyarbakir 1096447 0.019415
Gaziantep 1010396 0.017892
Sanliurfa 1001455 0.017733
C4POP 0.263481
C8POP 0.361298
Table 3.5 Cumulative C4EMP totals for the industries examined
C4EMP range Number of industries Cumulative total
1.000 17 17
0.9–0.999 32 49
0.8–0.899 36 85
0.7–0.799 40 125
0.6–0.699 30 155
0.5–0.599 30 185
0.4–0.499 20 205
0.3–0.399 20 225
0.2–0.299 6 231
53
Istanbul
Textiles/apparel
Leather/fur
Jewellery
Glass
Financial services
Media and entertainment
Tekirdag
Wine
Çanakkale
Fish and fish products
Ceramics
Kütahya
Ceramics
Usak
Leather tanning
Carpets
Mugla
Construction and repair of boats
Tourism
Denizli
Textiles
Antalya
Tourism
Afyon
Ceramics
Isparta
Carpets
Nevsehir
Ceramics
Wine
Kayseri
Carpets
Furniture
Gaziantep
Carpets
Adiyaman
Carpets
Trabzon
Fish products
Ship building
Sinop
Fish and fish products
Ankara
Construction
Furniture
Bartin
Ship building
Bursa
Textiles
Furniture
Bolu
Leather tanning
Figure 3.3 Selected examples of highly concentrated industries in Turkey
54 Clusters and Competitive Advantage
industries are any more concentrated than uncompetitive ones and the
constituents of the economy as a whole. These tests have failed to reject
(D 0.1) the null hypotheses that the mean of C4EMP is the same for com-
petitive industries and the economic constituents as a whole, and that there
is no difference between the mean concentration of competitive versus
uncompetitive industries.
11
The fact that we cannot find a statistically significant difference between
competitive and uncompetitive industries in respect of geographic concen-
tration, however, may be related to data problems. Specifically the data used
to measure international competitiveness (SITC-based) and geographic
concentration (ISIC-based) are not exactly compatible, making it infeasible
to employ conventional statistical methods apart from the simple tests used
in this case. A possible solution to this problem would be to employ a less
conventional technique using fuzzy logic and fuzzy membership scores
(Ragin, 2000).
12
This would enable varying degrees of competitiveness and
geographic concentration to be taken into account.
If industries that are not covered in the SITC system and suspect cases are
eliminated,
13
80 of the 231 industries remain to be analysed by means of
fuzzy-set methods. To estimate the degree of membership of these 80 industries
in the set of competitive industries, assessments of competitiveness based
on world export share are translated into fuzzy membership scores. This is
done by taking the cut-off rate as the cross-over point and arraying the
remaining cases according to their world export shares, as shown in Table 3.6.
Specifically, cases with the highest world export shares (more than double
the cut-off rate) are assigned full membership of the set, while competitive
cases with world export shares that are higher than the cut-off rate but lower
than double that rate are assigned strong but less than full membership of the
set. The same rationale is used to assess the fuzzy membership categories of
the relatively less competitive cases. In a similar vein, the degree of fuzzy
membership of a given industry in the set of geographically concentrated
industries is assessed by means of its C4EMP ratio, as shown in Table 3.7.
Table 3.6 International competitiveness, fuzzy membership categories
Raw score in
(%) Membership position
Fuzzy membership
score (F)
>2.08 Fully in F 1
1.05–2.08 Mostly in 0.751 < F <0.999
0.53–1.04 More or less in 0.501 < F <0.750
0.52 Neither in nor out F 0.500
0.26–0.51 More or less out 0.251 < F <0.499
0.13–0.25 Mostly out 0.001 < F <0.250
<0.13 Fully out F 0
Industrial Clusters in Turkey 55
Having determined the fuzzy membership scores for both variables, the
FS/QCA algorithm (Drass and Ragin, 1999), which was specifically prepared
to implement the techniques developed by Ragin (2000), is employed to
perform the necessary analyses. The results indicate that geographic concen-
tration is neither a necessary nor a sufficient condition for competitiveness
if 0.80 (D 0.05) is taken as the benchmark proportion.
14
If, however, the
benchmark proportion is reduced to 0.60 (D 0.1), we obtain the interesting
finding that geographic concentration is usually necessary for international
competitiveness. In other words, making full use of the information at hand
and fuzzy-set methods provides some evidence (though not particularly
strong) of a positive relationship between geographic concentration and
international competitiveness since the former has been found to be usually
necessary for the latter.
Finding a suitable methodology for the analysis of clusters
Once the relatively more competitive and concentrated industries (as well
as the relatively less competitive and concentrated ones) are identified, a
method is needed to choose and analyse the clusters in-depth. This section
will outline and discuss the method that will be used in the rest of this study.
Although there is no clear consensus on methodology used for measuring
geographic concentration, a number of standard measures are used widely.
When it comes to analyzing how and why a cluster has become or could not
become internationally competitive, and also whether a cluster has been able
to maintain its competitiveness, the methodological approaches are rather
diverse, ranging from mathematical models
15
to surveys
16
and qualitative
case studies
17
.
Using qualitative case studies to analyse clusters is well justified because if
a cluster is viewed as a highly complex interaction of several factors it is very
difficult to measure the causal relations in a robust manner. In the following
chapters, case studies will be used to determine how and why competitive
advantage is created in a specific cluster, as well as to identify the processes
that are associated with the subsequent upgrading and/or loss of the
Table 3.7 Geographic concentration, fuzzy membership categories
Raw score
(%) Membership position
Fuzzy membership
score (F)
>0.8 Fully in F 1.0
0.6–0.8 Mostly but not fully in 0.5 < F <1.0
0.6 Neither in nor out F 0.5
0.4–0.6 Mostly but not fully out 0 < F <0.5
<0.4 Fully out F 0