Process or Product Monitoring and Control_14 doc
Bạn đang xem bản rút gọn của tài liệu. Xem và tải ngay bản đầy đủ của tài liệu tại đây (1.11 MB, 22 trang )
4. Subgroup analysis.
1. Generate a moving mean control
chart.
2. Generate a moving range control
chart.
3. Generate a mean control chart
for WAFER.
4. Generate a sd control chart
for WAFER.
5. Generate a mean control chart
for CASSETTE.
6. Generate a sd control chart
for CASSETTE.
7. Generate an analysis of
variance. This is not
currently implemented in
DATAPLOT for nested
datasets.
8. Generate a mean control chart
using lot-to-lot variation.
1. The moving mean plot shows
a large number of out-of-
control points.
2. The moving range plot shows
a large number of out-of-
control points.
3. The mean control chart shows
a large number of out-of-
control points.
4. The sd control chart shows
no out-of-control points.
5. The mean control chart shows
a large number of out-of-
control points.
6. The sd control chart shows
no out-of-control points.
7. The analysis of variance and
components of variance
calculations show that
cassette to cassette
variation is 54% of the total
and site to site variation
is 36% of the total.
8. The mean control chart shows one
point that is on the boundary of
being out of control.
6.6.1.5. Work This Example Yourself
(3 of 3) [5/1/2006 10:35:54 AM]
6. Process or Product Monitoring and Control
6.6. Case Studies in Process Monitoring
6.6.2.Aerosol Particle Size
Box-Jenkins
Modeling of
Aerosol
Particle Size
This case study illustrates the use of Box-Jenkins modeling with aerosol
particle size data.
Background and Data1.
Model Identification2.
Model Estimation3.
Model Validation4.
Work This Example Yourself5.
6.6.2. Aerosol Particle Size
[5/1/2006 10:35:54 AM]
6. Process or Product Monitoring and Control
6.6. Case Studies in Process Monitoring
6.6.2. Aerosol Particle Size
6.6.2.1.Background and Data
Data Source The source of the data for this case study is Antuan Negiz who
analyzed these data while he was a post-doc in the NIST Statistical
Engineering Division from the Illinois Institute of Technology.
Data
Collection
These data were collected from an aerosol mini-spray dryer device. The
purpose of this device is to convert a slurry stream into deposited
particles in a drying chamber. The device injects the slurry at high
speed. The slurry is pulverized as it enters the drying chamber when it
comes into contact with a hot gas stream at low humidity. The liquid
contained in the pulverized slurry particles is vaporized, then
transferred to the hot gas stream leaving behind dried small-sized
particles.
The response variable is particle size, which is collected equidistant in
time. There are a variety of associated variables that may affect the
injection process itself and hence the size and quality of the deposited
particles. For this case study, we restrict our analysis to the response
variable.
Applications Such deposition process operations have many applications from
powdered laundry detergents at one extreme to ceramic molding at an
important other extreme. In ceramic molding, the distribution and
homogeneity of the particle sizes are particularly important because
after the molds are baked and cured, the properties of the final molded
ceramic product is strongly affected by the intermediate uniformity of
the base ceramic particles, which in turn is directly reflective of the
quality of the initial atomization process in the aerosol injection device.
6.6.2.1. Background and Data
(1 of 14) [5/1/2006 10:35:55 AM]
Aerosol
Particle Size
Dynamic
Modeling
and Control
The data set consists of particle sizes collected over time. The basic
distributional properties of this process are of interest in terms of
distributional shape, constancy of size, and variation in size. In
addition, this time series may be examined for autocorrelation structure
to determine a prediction model of particle size as a function of
time such a model is frequently autoregressive in nature. Such a
high-quality prediction equation would be essential as a first step in
developing a predictor-corrective recursive feedback mechanism which
would serve as the core in developing and implementing real-time
dynamic corrective algorithms. The net effect of such algorthms is, of
course, a particle size distribution that is much less variable, much
more stable in nature, and of much higher quality. All of this results in
final ceramic mold products that are more uniform and predictable
across a wide range of important performance characteristics.
For the purposes of this case study, we restrict the analysis to
determining an appropriate Box-Jenkins model of the particle size.
Case study
data
115.36539
114.63150
114.63150
116.09940
116.34400
116.09940
116.34400
116.83331
116.34400
116.83331
117.32260
117.07800
117.32260
117.32260
117.81200
117.56730
118.30130
117.81200
118.30130
117.81200
118.30130
118.30130
118.54590
118.30130
117.07800
116.09940
6.6.2.1. Background and Data
(2 of 14) [5/1/2006 10:35:55 AM]
118.30130
118.79060
118.05661
118.30130
118.54590
118.30130
118.54590
118.05661
118.30130
118.54590
118.30130
118.30130
118.30130
118.30130
118.05661
118.30130
117.81200
118.30130
117.32260
117.32260
117.56730
117.81200
117.56730
117.81200
117.81200
117.32260
116.34400
116.58870
116.83331
116.58870
116.83331
116.83331
117.32260
116.34400
116.09940
115.61010
115.61010
115.61010
115.36539
115.12080
115.61010
115.85471
115.36539
115.36539
115.36539
115.12080
6.6.2.1. Background and Data
(3 of 14) [5/1/2006 10:35:55 AM]
114.87611
114.87611
115.12080
114.87611
114.87611
114.63150
114.63150
114.14220
114.38680
114.14220
114.63150
114.87611
114.38680
114.87611
114.63150
114.14220
114.14220
113.89750
114.14220
113.89750
113.65289
113.65289
113.40820
113.40820
112.91890
113.40820
112.91890
113.40820
113.89750
113.40820
113.65289
113.89750
113.65289
113.65289
113.89750
113.65289
113.16360
114.14220
114.38680
113.65289
113.89750
113.89750
113.40820
113.65289
113.89750
113.65289
6.6.2.1. Background and Data
(4 of 14) [5/1/2006 10:35:55 AM]
113.65289
114.14220
114.38680
114.63150
115.61010
115.12080
114.63150
114.38680
113.65289
113.40820
113.40820
113.16360
113.16360
113.16360
113.16360
113.16360
112.42960
113.40820
113.40820
113.16360
113.16360
113.16360
113.16360
111.20631
112.67420
112.91890
112.67420
112.91890
113.16360
112.91890
112.67420
112.91890
112.67420
112.91890
113.16360
112.67420
112.67420
112.91890
113.16360
112.67420
112.91890
111.20631
113.40820
112.91890
112.67420
113.16360
6.6.2.1. Background and Data
(5 of 14) [5/1/2006 10:35:55 AM]
113.65289
113.40820
114.14220
114.87611
114.87611
116.09940
116.34400
116.58870
116.09940
116.34400
116.83331
117.07800
117.07800
116.58870
116.83331
116.58870
116.34400
116.83331
116.83331
117.07800
116.58870
116.58870
117.32260
116.83331
118.79060
116.83331
117.07800
116.58870
116.83331
116.34400
116.58870
116.34400
116.34400
116.34400
116.09940
116.09940
116.34400
115.85471
115.85471
115.85471
115.61010
115.61010
115.61010
115.36539
115.12080
115.61010
6.6.2.1. Background and Data
(6 of 14) [5/1/2006 10:35:55 AM]
115.85471
115.12080
115.12080
114.87611
114.87611
114.38680
114.14220
114.14220
114.38680
114.14220
114.38680
114.38680
114.38680
114.38680
114.38680
114.14220
113.89750
114.14220
113.65289
113.16360
112.91890
112.67420
112.42960
112.42960
112.42960
112.18491
112.18491
112.42960
112.18491
112.42960
111.69560
112.42960
112.42960
111.69560
111.94030
112.18491
112.18491
112.18491
111.94030
111.69560
111.94030
111.94030
112.42960
112.18491
112.18491
111.94030
6.6.2.1. Background and Data
(7 of 14) [5/1/2006 10:35:55 AM]
112.18491
112.18491
111.20631
111.69560
111.69560
111.69560
111.94030
111.94030
112.18491
111.69560
112.18491
111.94030
111.69560
112.18491
110.96170
111.69560
111.20631
111.20631
111.45100
110.22771
109.98310
110.22771
110.71700
110.22771
111.20631
111.45100
111.69560
112.18491
112.18491
112.18491
112.42960
112.67420
112.18491
112.42960
112.18491
112.91890
112.18491
112.42960
111.20631
112.42960
112.42960
112.42960
112.42960
113.16360
112.18491
112.91890
6.6.2.1. Background and Data
(8 of 14) [5/1/2006 10:35:55 AM]
112.91890
112.67420
112.42960
112.42960
112.42960
112.91890
113.16360
112.67420
113.16360
112.91890
112.42960
112.67420
112.91890
112.18491
112.91890
113.16360
112.91890
112.91890
112.91890
112.67420
112.42960
112.42960
113.16360
112.91890
112.67420
113.16360
112.91890
113.16360
112.91890
112.67420
112.91890
112.67420
112.91890
112.91890
112.91890
113.16360
112.91890
112.91890
112.18491
112.42960
112.42960
112.18491
112.91890
112.67420
112.42960
112.42960
6.6.2.1. Background and Data
(9 of 14) [5/1/2006 10:35:55 AM]
112.18491
112.42960
112.67420
112.42960
112.42960
112.18491
112.67420
112.42960
112.42960
112.67420
112.42960
112.42960
112.42960
112.67420
112.91890
113.40820
113.40820
113.40820
112.91890
112.67420
112.67420
112.91890
113.65289
113.89750
114.38680
114.87611
114.87611
115.12080
115.61010
115.36539
115.61010
115.85471
116.09940
116.83331
116.34400
116.58870
116.58870
116.34400
116.83331
116.83331
116.83331
117.32260
116.83331
117.32260
117.56730
117.32260
6.6.2.1. Background and Data
(10 of 14) [5/1/2006 10:35:55 AM]
117.07800
117.32260
117.81200
117.81200
117.81200
118.54590
118.05661
118.05661
117.56730
117.32260
117.81200
118.30130
118.05661
118.54590
118.05661
118.30130
118.05661
118.30130
118.30130
118.30130
118.05661
117.81200
117.32260
118.30130
118.30130
117.81200
117.07800
118.05661
117.81200
117.56730
117.32260
117.32260
117.81200
117.32260
117.81200
117.07800
117.32260
116.83331
117.07800
116.83331
116.83331
117.07800
115.12080
116.58870
116.58870
116.34400
6.6.2.1. Background and Data
(11 of 14) [5/1/2006 10:35:55 AM]
115.85471
116.34400
116.34400
115.85471
116.58870
116.34400
115.61010
115.85471
115.61010
115.85471
115.12080
115.61010
115.61010
115.85471
115.61010
115.36539
114.87611
114.87611
114.63150
114.87611
115.12080
114.63150
114.87611
115.12080
114.63150
114.38680
114.38680
114.87611
114.63150
114.63150
114.63150
114.63150
114.63150
114.14220
113.65289
113.65289
113.89750
113.65289
113.40820
113.40820
113.89750
113.89750
113.89750
113.65289
113.65289
113.89750
6.6.2.1. Background and Data
(12 of 14) [5/1/2006 10:35:55 AM]
113.40820
113.40820
113.65289
113.89750
113.89750
114.14220
113.65289
113.40820
113.40820
113.65289
113.40820
114.14220
113.89750
114.14220
113.65289
113.65289
113.65289
113.89750
113.16360
113.16360
113.89750
113.65289
113.16360
113.65289
113.40820
112.91890
113.16360
113.16360
113.40820
113.40820
113.65289
113.16360
113.40820
113.16360
113.16360
112.91890
112.91890
112.91890
113.65289
113.65289
113.16360
112.91890
112.67420
113.16360
112.91890
112.67420
6.6.2.1. Background and Data
(13 of 14) [5/1/2006 10:35:55 AM]
112.91890
112.91890
112.91890
111.20631
112.91890
113.16360
112.42960
112.67420
113.16360
112.42960
112.67420
112.91890
112.67420
111.20631
112.42960
112.67420
112.42960
113.16360
112.91890
112.67420
112.91890
112.42960
112.67420
112.18491
112.91890
112.42960
112.18491
6.6.2.1. Background and Data
(14 of 14) [5/1/2006 10:35:55 AM]
6. Process or Product Monitoring and Control
6.6. Case Studies in Process Monitoring
6.6.2. Aerosol Particle Size
6.6.2.2.Model Identification
Check for
Stationarity,
Outliers,
Seasonality
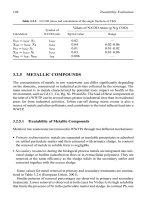
The first step in the analysis is to generate a run sequence plot of the
response variable. A run sequence plot can indicate stationarity (i.e.,
constant location and scale), the presence of outliers, and seasonal
patterns.
Non-stationarity can often be removed by differencing the data or
fitting some type of trend curve. We would then attempt to fit a
Box-Jenkins model to the differenced data or to the residuals after
fitting a trend curve.
Although Box-Jenkins models can estimate seasonal components, the
analyst needs to specify the seasonal period (for example, 12 for
monthly data). Seasonal components are common for economic time
series. They are less common for engineering and scientific data.
Run Sequence
Plot
6.6.2.2. Model Identification
(1 of 5) [5/1/2006 10:35:56 AM]
Interpretation
of the Run
Sequence Plot
We can make the following conclusions from the run sequence plot.
The data show strong and positive autocorrelation.1.
There does not seem to be a significant trend or any obvious
seasonal pattern in the data.
2.
The next step is to examine the sample autocorrelations using the
autocorrelation plot.
Autocorrelation
Plot
Interpretation
of the
Autocorrelation
Plot
The autocorrelation plot has a 95% confidence band, which is
constructed based on the assumption that the process is a moving
average process. The autocorrelation plot shows that the sample
autocorrelations are very strong and positive and decay very slowly.
The autocorrelation plot indicates that the process is non-stationary
and suggests an ARIMA model. The next step is to difference the
data.
6.6.2.2. Model Identification
(2 of 5) [5/1/2006 10:35:56 AM]
Run Sequence
Plot of
Differenced
Data
Interpretation
of the Run
Sequence Plot
The run sequence plot of the differenced data shows that the mean of
the differenced data is around zero, with the differenced data less
autocorrelated than the original data.
The next step is to examine the sample autocorrelations of the
differenced data.
Autocorrelation
Plot of the
Differenced
Data
6.6.2.2. Model Identification
(3 of 5) [5/1/2006 10:35:56 AM]
Interpretation
of the
Autocorrelation
Plot of the
Differenced
Data
The autocorrelation plot of the differenced data with a 95%
confidence band shows that only the autocorrelation at lag 1 is
significant. The autocorrelation plot together with run sequence of
the differenced data suggest that the differenced data are stationary.
Based on the autocorrelation plot, an MA(1) model is suggested for
the differenced data.
To examine other possible models, we produce the partial
autocorrelation plot of the differenced data.
Partial
Autocorrelation
Plot of the
Differenced
Data
Interpretation
of the Partial
Autocorrelation
Plot of the
Differenced
Data
The partial autocorrelation plot of the differenced data with 95%
confidence bands shows that only the partial autocorrelations of the
first and second lag are significant. This suggests an AR(2) model for
the differenced data.
6.6.2.2. Model Identification
(4 of 5) [5/1/2006 10:35:56 AM]
Akaike
Information
Criterion (AIC
and AICC)
Information-based criteria, such as the AIC or AICC (see Brockwell
and Davis (2002), pp. 171-174), can be used to automate the choice
of an appropriate model. When available, the AIC or AICC can be a
useful tool for model identification.
Many software programs for time series analysis will generate the
AIC or AICC for a broad range of models. At this time, Dataplot
does not support this feature. However, based on the plots in this
section, we will examine the ARIMA(2,1,0) and ARIMA(0,1,1)
models in detail.
Note that whatever method is used for model identification, model
diagnostics should be performed on the selected model.
6.6.2.2. Model Identification
(5 of 5) [5/1/2006 10:35:56 AM]
6. Process or Product Monitoring and Control
6.6. Case Studies in Process Monitoring
6.6.2. Aerosol Particle Size
6.6.2.3.Model Estimation
Dataplot
ARMA
Output
for the
AR(2)
Model
Based on the differenced data, Dataplot generated the following estimation output for the
AR(2) model:
#############################################################
# NONLINEAR LEAST SQUARES ESTIMATION FOR THE PARAMETERS OF #
# AN ARIMA MODEL USING BACKFORECASTS #
#############################################################
SUMMARY OF INITIAL CONDITIONS
MODEL SPECIFICATION
FACTOR (P D Q) S
1 2 1 0 1
DEFAULT SCALING USED FOR ALL PARAMETERS.
##STEP SIZE
FOR
######PARAMETER
##APPROXIMATING
#################PARAMETER DESCRIPTION STARTING VALUES
#####DERIVATIVE
INDEX #########TYPE ##ORDER ##FIXED ##########(PAR)
##########(STP)
1 AR (FACTOR 1) 1 NO 0.10000000E+00
0.77167549E-06
2 AR (FACTOR 1) 2 NO 0.10000000E+00
0.77168311E-06
3 MU ### NO 0.00000000E+00
0.80630875E-06
NUMBER OF OBSERVATIONS (N) 559
MAXIMUM NUMBER OF ITERATIONS ALLOWED (MIT)
500
MAXIMUM NUMBER OF MODEL SUBROUTINE CALLS ALLOWED
1000
CONVERGENCE CRITERION FOR TEST BASED ON THE
FORECASTED RELATIVE CHANGE IN RESIDUAL SUM OF SQUARES (STOPSS)
6.6.2.3. Model Estimation
(1 of 5) [5/1/2006 10:35:56 AM]