Báo cáo hóa học: " Research Article Robust Speech Watermarking Procedure in the Time-Frequency Domain" docx
Bạn đang xem bản rút gọn của tài liệu. Xem và tải ngay bản đầy đủ của tài liệu tại đây (1.65 MB, 9 trang )
Hindawi Publishing Corporation
EURASIP Journal on Advances in Signal Processing
Volume 2008, Article ID 519206, 9 pages
doi:10.1155/2008/519206
Research Article
Robust Speech Watermarking Procedure in
the Time-Frequency Domain
Srdjan Stankovi
´
c, Irena Orovi
´
c, and Nikola
ˇ
Zari
´
c
Electrical Engineering Department, University of Montenegro, 81000 Podgorica, Montenegro
Correspondence should be addressed to Irena Orovi
´
c,
Received 18 January 2008; Accepted 16 April 2008
Recommended by Gloria Menegaz
An approach to speech watermarking based on the time-frequency signal analysis is proposed. As a time-frequency representation
suitable for speech analysis, the S-method is used. The time-frequency characteristics of watermark are modeled by using speech
components in the selected region. The modeling procedure is based on the concept of time-varying filtering. A detector form that
includes cross-terms in the Wigner distribution is proposed. Theoretical considerations are illustrated by the examples. Efficiency
of the proposed procedure has been tested for several signals and under various attacks.
Copyright © 2008 Srdjan Stankovi
´
c et al. This is an open access article distributed under the Creative Commons Attribution
License, which permits unrestricted use, distribution, and reproduction in any medium, provided the original work is properly
cited.
1. INTRODUCTION
Digital watermarking has been developed as an effective
solution for multimedia data protection. Watermarking
usually assumes embedding of secret signal that should
be robust and imperceptible within the host data. Also,
reliable watermark detection must be provided. A number
of proposed watermarking techniques refer to the speech
and audio signals [1]. Some of them are based on spread-
spectrum method [2–4], while the others are related to
the time-scale method [5, 6], or fragile content features
combined with robust watermarking [7].
The existing watermarking techniques are mainly based
on either the time or frequency domain. However, in both
cases, the time-frequency characteristics of watermark do
not correspond to the time-frequency characteristics of
speech signal. It may cause watermark audibility, because
the watermark will be present in the time-frequency regions
where speech components do not exist. In this paper, a
time-frequency-based approach for speech watermarking is
proposed. The watermark in the time-frequency domain is
modeled to follow specific speech components in the selected
time-frequency regions. Additionally, in order to provide
its imperceptibility, the energy of watermark is adjusted to
the energy of speech components. In image watermarking,
an approach based on the two-dimensional space/spatial
frequency distribution has already been proposed in [8].
However, it is not appropriate in the case of speech signals.
Among all time-frequency representations, the spectro-
gram is the simplest one. However, it has a low time-
frequency resolution. On the other hand, the Wigner
distribution, as one of the commonly used, produces a
large amount of cross-terms in the case of multicomponent
signals. Thus, the S-method, as a cross-terms free time-
frequency representation, can be used for speech analysis.
The watermark is created by modeling time-frequency
characteristics of a pseudorandom sequence according to
the certain time-frequency speech components. The main
problem in these applications is the inversion of the time-
frequency distributions. A procedure based on the time-
varying filtering has been proposed in [9]. The Wigner
distribution has been used to create time-varying filter that
identifies the support of a monocomponent chirp signal.
However, it cannot be used in the case of multicomponent
speech signals. Also, some interesting approaches to signal’s
components extraction from the time-frequency plane have
been proposed in [10, 11].
In this work, the time-varying filtering, based on the
cross-terms free time-frequency representation, is adapted
for speech signals and watermarking purpose. Namely, this
concept is used to identify the support of certain speech
components in the time-frequency domain and to model the
2 EURASIP Journal on Advances in Signal Processing
watermark according to these components. The basic idea of
this approach has been introduced in [12]. The time-varying
filtering is also used to overcome the problem of inverse
mapping from the time-frequency domain. Additionally, a
reliable procedure for blind watermark detection is provided
by modifying the correlation detector in the time-frequency
domain. It is based on the Wigner distribution, because
the presence of cross-terms improves detection results [13].
Therefore, the main advantage of the proposed method is in
providing efficient watermark detection with low probabili-
ties of error for a set of strong attacks. Payload provided by
this procedure is suitable for various applications [1].
The paper is organized as follows. Time-frequency
representations and the concept of time-varying filtering are
presented in Section 2. A proposal for watermark embedding
anddetectionisgiveninSection 3. The evaluation of the
proposed procedure is performed by the various examples
and tests in Section 4. Concluding remarks are given in
Section 5.
2. THEORETICAL BACKGROUND
Time-frequency representations of speech signal and the
concept of time-varying filtering will be considered in this
Section.
2.1. Time-frequency representation of speech signals
Time-frequency representations have been used for speech
signal analysis. The Wigner distribution, as one of the com-
monly used time-frequency representations, in its pseudo-
form is defined as
WD(n, k)
= 2
N/2
m=−N/2
w(m)w
∗
(−m) f (n + m)
× f
∗
(n −m)e
−j2π2mk/N
,
(1)
where f represents a signal (
∗ denotes the conjugated
function), w is the window function, N is the window length,
while n and k are discrete time and frequency variables,
respectively. However, if we represent a multicomponent
signal(suchasspeech)asasumofM components f
i
(n), that
is, f (n)
=
M
i
=1
f
i
(n), its Wigner distribution produces a large
amount of cross-terms:
WD
f
(n, k) =
M
i=1
WD
i
f
(n, k)+2Real
M
i=1
M
j>i
WD
ij
f
(n, k)
,
(2)
where WD
i
f
(n, k) are the autoterms, while WD
ij
f
(n, k),
for i
/
= j, represent the cross-terms. In order to preserve
autoterms concentration as in the Wigner distribution, and
to reduce the presence of cross-terms, the S-method (SM)
has been introduced [14]:
SM(n, k)
=
L
l=−L
P(l)STFT(n, k + l)STFT
∗
(n, k − l), (3)
where P(l) is a finite frequency domain window with length
2L + 1, while STFT is the short-time Fourier transform
defined as STFT(n,k)
=
N/2
m
=−N/2
w(m) f (n + m)e
−j2πmk/N
,
with window function w(m). Thus, the SM of the multi-
component signal, whose components do not overlap in the
time-frequency plane, represents the cross-terms free Wigner
distribution of the individual signal components. By taking
the rectangular window P(l), the discrete form of SM can be
written as
SM(n, k)
=
STFT(n, k)
2
+2Real
L
l=1
STFT(n, k + l)STFT
∗
(n, k − l)
.
(4)
Note that the terms in summation improve the quality
of spectrogram (square module of the short-time Fourier
transform) toward the quality of the Wigner distribution.
The window P(l) should be wide enough to enable
the complete summation over the autoterms. At the same
time, to remove the cross-terms, it should be narrower
than the distance between the autoterms. The convergence
within P(l) is very fast, so that high autoterms concentration
is obtained with only a few summation terms. Thus, in
many applications L < 5canbeused[14]. Unlike the
Wigner distribution, the oversampling in time domain is not
necessary since the aliasing components will be removed in
the same way as the cross-terms. More details about the S-
method can be found in [14, 15].
Comparing to other quadratic time-frequency distri-
butions, the S-method provides a significant saving in
computation time. The number of complex multiplications
for the S-method is N(3 + L)/2, while the number of
complex additions is N(6 + L)/2 [14](N is the number of
samples within the window w(m)). In the case of Wigner
distribution, these numbers are significantly larger: N(4
+log
2
N)/2 for complex multiplications and Nlog
2
2N for
complex additions. It is important to note that the S-method
allows simple and efficient hardware realization that has
already been done [16, 17].
2.2. Time-varying filtering
Time-varying filtering is used in order to obtain watermark
with specific time-frequency properties as well as to provide
the inverse transform from the time-frequency domain. In
the sequel, the general concept of the time-varying filtering
is presented.
For a given signal x, the pseudoform of time-varying
filtering, suitable for numerical realizations, has been defined
as [18]
Hx(t)
=
∞
−∞
h
t +
τ
2
, t
−
τ
2
w(τ)x(t + τ)dτ,(5)
where w is a lag window, τ is a lag coordinate, while h
represents impulse response of the time-varying filter. Time-
varying transfer function, that is, support function, has been
Srdjan Stankovi
´
cetal. 3
defined as Weyl symbol mapping of the impulse response
into the time-frequency domain [18]:
L
H
(t, ω) =
∞
−∞
h
t +
τ
2
, t
−
τ
2
e
−jωτ
dτ,(6)
where t and ω are time and frequency variables, respectively.
Thus, by using the support function (6), the filter output
canbeobtainedas[18]
Hx(t)
=
1
2π
∞
−∞
L
H
(t, ω)STFT
x
(t, ω)dω. (7)
The discrete form of the above relation can be written as
Hx(n)
=
1
N
N/2
k=−N/2
L
H
(n, k)STFT
x
(n, k), (8)
where STFT
x
is the STFT of an input signal x, while N is
the length of window w(m). According to (8), by using the
STFT of a pseudorandom sequence and a suitable support
function, the watermark with specific time-frequency char-
acteristics will be obtained [12]. The support function will be
defined in the form of time-frequency mask that corresponds
to certain speech components.
3. WATERMARKING PROCEDURE USING
TIME-FREQUENCY REPRESENTATION
A method for time-frequency-based speech watermarking
is proposed in this section. The watermark is embedded
in the components of a voiced speech part. It is modeled
to follow the time-frequency characteristics of significant
speech formants. Furthermore, the procedure for watermark
detection in the time-frequency domain is proposed.
3.1. Watermark sequence generation
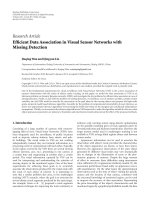
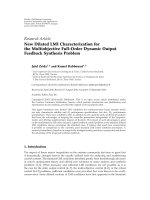
In order to select the speech components for watermarking,
the region D in the time-frequency plane, that is, D
=
{
(t, ω):t ∈ (t
1
, t
2
), ω ∈ (ω
1
, ω
2
)}, is considered (see
Figure 1). The time instances t
1
and t
2
correspond to the start
and the end of voiced speech part. The voice activity detector,
that is, word end-points detector [19–21], is used to select
the voiced part of speech signal. The strongest formants are
selected within the frequency interval ω
∈ (ω
1
, ω
2
).
The time-frequency characteristics of the watermark
within the region D can be modeled by using the support
function defined as
L
M
(t, ω) =
⎧
⎨
⎩
1, for (t, ω) ∈ D,
0, for (t, ω)
/
∈D.
(9)
Thus, the support function L
M
will be used to create a
watermark with specific time-frequency characteristics. In
order to use the strongest formants components, the energy
floor ξ is introduced. Thus, the function L
M
can be modified
as
L
M
(t, ω) =
⎧
⎨
⎩
1, for (t, ω) ∈ D,andSM
x
(t, ω) >ξ,
0, for (t, ω)
/
∈D,orSM
x
(t, ω) ≤ ξ,
(10)
0
0.5
1
1.5
2
2.5
3
3.5
4
Frequency (kHz)
0 200 400 600 800 1000 1200
Time (ms)
Figure 1: Illustration of the region D.
where SM
x
(t,ω) represents the SM of speech signal. Since
the energy floor ξ is used to avoid watermarking of weak
components, an appropriate expression for ξ is given by
ξ
= λ ·10
λ ·log
10
(max(SM
x
(t,ω)))
,wheremax(SM
x
(t, ω)) is a
maximal value of signal’s S-method in the region D, while
λ is a parameter with values between 0 and 1. The higher
λ means that stronger components are taken. It is assumed
that the significant components within the region are
approximately of the same strength. It means that only a
few closest formants should be considered within the region
D. Therefore, if different time-frequency regions are used
for watermarking, each energy floor should be adapted to
the strength of maximal component within the considered
region. It is important to note that generally, the value ξ is not
necessary for the detection procedure, as it will be explained
latter.
The pseudorandom sequence p is an input of the time-
varying filter. According to (8), the watermark is obtained as
w
key
(n) =
1
N
N/2
k=−N/2
L
M
(n, k) ·STFT
p
(n, k), (11)
where STFT
p
(n,k) is the discrete STFT of the sequence p.
Since the watermark is modeled by using the function L
M
,
it will be present only within the specified region where the
strong signal components exist.
Finally, the watermark embedding is done according to
x
w
(n) = x(n)+w
key
(n). (12)
3.2. Watermark detection
The watermark detection is performed in the time-frequency
domain by using the correlation detector. The time instances
t
1
and t
2
are determined by using voice activity detector. It
is not necessary that the detector contains the information
about the frequency range (ω
1
,ω
2
) of the region D.Namely,
the correlation can be performed along the entire frequency
range of signal, but it is only effective within (ω
1
,ω
2
)(region
D), where watermark components exist. By the way, the
information about the range (ω
1
,ω
2
)canbeextractedfrom
the watermark time-frequency representation.
4 EURASIP Journal on Advances in Signal Processing
The detector responses must satisfy the following:
D
STFT
x
w
(t, ω) ·STFT
w
key
(t, ω) >T, (13)
where STFT
x
w
(t,ω), STFT
w
key
(t,ω) represent the short-time
Fourier transform of watermarked signal and the short-
time Fourier transform of watermark, respectively, while T
is a threshold. The detector response for any wrong trial
(sequence created in the same manner as watermark) should
not be greater than the threshold value.
The support function L
M
and the energy floor ξ are not
required in the detection procedure. The function L
M
can
be extracted from the watermark and used to model other
sequences that will act as wrong trials, or simply it does not
have to be used. Namely, detection can be performed even
by using STFT of nonmodeled pseudorandom sequence p
(used to create watermark). The watermark is included in
the sequence p, and correlation will take effect only on the
time-frequency positions of watermark. The remaining parts
of the sequence p have the same influence on detection as in
the case of wrong trials.
A significant improvement of watermark detection is
obtained if the cross-terms in the time-frequency plane are
included. Namely, for the calculation of SM in the detection
stage, a large window length L can be chosen. For the window
length greater than the distance between the autoterms,
cross-terms appear:
M
i,j=1
j>i
N/2
l=L
min
+1
Real
STFT
i
(n, k + l)STFT
∗
j
(n, k − l)
/
=0, (14)
where L
min
is the minimal distance between the autoterms.
Thus, by increasing L in (4), the SM approaches the
Wigner distribution (for L
= N/2 Wigner distribution is
obtained). An interesting approach to signal detection, based
on the Wigner distribution, is proposed in [13], where the
presence of cross-terms increases the number of components
used in detection. Namely, apart from the autoterms, the
watermark is included in the cross-terms as well. Therefore,
by using the time-frequency domain with the cross-terms
included, watermark detection can be significantly relaxed
and improved, since the watermark is spread over a large
number of components within the considered region. If the
cross-terms are considered, the correlation detector in the
time-frequency domain can be written as
Det
=
N
i=1
SM
i
w
key
·SM
i
x
w
+
N
i,j=1
i
/
=j
SM
i,j
w
key
·SM
i,j
x
w
, (15)
where the first summation includes autoterms, while the
second one includes cross terms.
Since the cross-terms contribute in watermark detection,
they should be included in other existing detectors struc-
tures. For example, the locally optimal detector based on
the generalized Gaussian distribution of the watermarked
coefficients, in the presence of cross terms in the time-
frequency domain, can be written as
Det
=
N
i=1
SM
i
w
key
sgn
SM
i
x
w
SM
i
x
w
β−1
+
N
i,j=1
i
/
= j
SM
i,j
w
key
sgn
SM
i,j
x
w
SM
i,j
x
w
β−1
.
(16)
The performance of the proposed detector is tested by
using the following measure of detection quality [22, 23]
R
=
D
w
r
−D
w
w
σ
2
w
r
+ σ
2
w
w
, (17)
where
D and σ
2
represent the mean value and the standard
deviation of the detector responses, respectively, while
indexes w
r
and w
w
indicate the right and wrong keys (trials).
The watermarking procedure has been done for different
right keys (watermarks). For each of the right keys, a certain
number of wrong trials are generated in the same manner as
right keys.
The probability of error P
err
is calculated by using
P
err
= p
Dw
w
∞
T
P
Dw
w
(x) dx + p
Dw
r
T
−∞
P
Dw
r
(x) dx, (18)
where the indexes w
r
and w
w
have the same meaning as in the
previous relation, T is a threshold, while equal priors p
Dw
w
=
p
Dw
r
= 1/2 are assumed. By considering normal distribution
for P
Dw
w
and P
Dw
r
and σ
2
w
r
= σ
2
w
w
, the minimization of P
err
leads to the following relation:
P
err
=
1
4
erfc
R
2
−
1
4
erfc
−
R
2
+
1
2
. (19)
By increasing the value of R, the probability of error
decreases. For example, P
err
(R = 2) = 0.0896, P
err
(R = 3) =
0.0169, while P
err
(R = 4) = 0.0023.
4. EXAMPLES
Efficiency of the proposed procedure is demonstrated on
several examples, where signals with various maximal
frequencies and signal to noise ratios (SNRs) are used.
The successful detection in the time-frequency domain is
performed in the case without attack as well as with a set of
strong attacks.
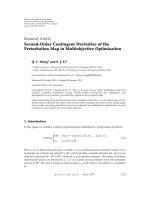
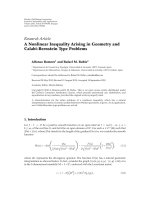
Example 1. The speech signal with f
max
= 4 kHz is consid-
ered. This maximal frequency is used to provide an appro-
priate illustration of the proposed method. The STFT was
calculated by using rectangular window with 256 samples
for time-varying filtering. Zero padding up to 1024 samples
was carried out, and the parameter L
= 5 is used in the
SM calculation. The region D (Figure 2(a)) is selected to
cover the first three low-frequency formants of voiced speech
part. The corresponding support function L
M
(Figure 2(b))
is created by using the value ξ with parameter λ
= 0.7.
Srdjan Stankovi
´
cetal. 5
0
0.2
0.4
0.6
0.8
Frequency (kHz)
450 500 550 600 650 700
Time (ms)
(a)
0
0.2
0.4
0.6
0.8
Frequency (kHz)
450 500 550 600 650 700
Time (ms)
(b)
Figure 2: (a) Region D of analyzed speech signal, (b) support
function.
Selection of the voiced speech part is done by using the
word end-points detector based on the combined Teager
energy and energy-entropy features [20, 21](anonoverlap-
ping speech frames of length 8 milliseconds are used). The
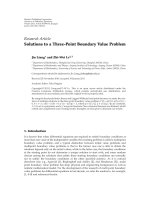
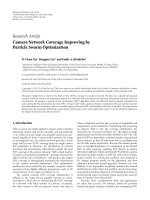
original and watermarked signals are given in Figure 3(a).
The obtained SNR is higher than 20 dB, which fulfills the
constraint of watermark imperceptibility [24]. The water-
mark imperceptibility has also been proven by using the ABX
listening test, where A, B, and X are original, watermarked,
and original or watermarked signal, respectively. The listener
listens to A and B. Then, listener listens to X and decides
whether X is A or B. Since A, B, and X are few seconds
long, the entire signals are listened to, not only isolated
segments. Three female and seven male listeners with normal
hearing participated in the listening test. The test was
performed few times, and from the obtained statistics it
was concluded that the listeners cannot positively distinguish
between watermarked and original signals.
Inordertoillustratetheefficiency of the proposed
detector form, an isolated watermarked speech part is
considered. However, it is not limited to this particular
speech part but, depending on the required data payload,
various voiced speech parts can be used to embed and
detect watermark. Detection is performed by using 100 trials
with wrong keys. The responses of the standard correlation
detector for STFT coefficients are given in Figure 3(b), while
the responses of the detector defined by (15) are shown in
Figures 3(c) and 3(d) (for window length L
= 10 and L =
32, resp.). The detector response for right key is normalized
to the value 1, while the responses for wrong keys are
proportionally presented.
Observe that for the same right key and the same set
of wrong trials, the improvement of detection results is
achieved by increasing parameter L (see Figure 3). Thus,
it is obvious that the detector performance increases with
the number of cross terms. In the following experiments,
L
= 32 has been used to provide reliable detection. Further
increasing of L does not improve results significantly. Note
that a window width N +1(forL
= N/2), like in the
Wigner distribution, can cause the presence of cross-terms
that do not contain watermark, since they could result from
two nonwatermarked autoterms. These cross-terms are not
desirable in watermark detection procedure.
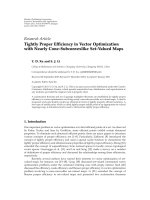
Additionally, we have performed experiments with few
other speech signals. For each signal, the low-frequency
formants are used, and the watermark has been embedded
with approximately the same SNR (around 24 dB). The
detection is performed by using (15)withL
= 32. We present
the results for three of them in Figure 4. Note that the
obtained results are very similar to the ones in Figure 3(d).
Thus, the detection performance is insensitive to different
signals tested under same conditions.
Example 2. In the previous example, the low-frequency for-
mants have been considered. However, different frequency
regions can be used. Thus, the procedure is also tested
for watermark modeled according to the middle-frequency
formants. The detection results are given in Figure 5(a)
( f
max
= 4 kHz and L = 32). The ratio between detector
responses for right key and wrong trials is lower than in
the previous example, with low-frequency formants, but
still satisfactory. The obtained SNR is 28dB. In addition,
the middle frequency formants of a signal with f
max
=
11.025 kHz have been considered. The results of watermark
detection are given in Figure 5(b) (L
= 32, and SNR =
32 dB). Extended frequency range enables more space for
watermarking. Thus, it allows embedding watermark with
lower strength, providing higher SNR.
Example 3 (evaluation of detection efficiency and robustness
to attacks). In order to evaluate the efficiency of the
proposed procedure by using the measure of detection
quality defined by (17), we repeated the procedure for 50
trials (for 50 right keys—watermarks). They are modeled
corresponding to the low-frequency formants. For each of
the right keys, a number of 60 wrong keys (trials) are
generated in the same manner as right keys. The average
6 EURASIP Journal on Advances in Signal Processing
Non-watermarked speech signal×10
4
2
0
−2
0 1000 2000 3000 4000 5000 6000
Watermarked speech signal
×10
4
2
0
−2
0 1000 2000 3000 4000 5000 6000
(a)
−0.4
−0.2
0
0.2
0.4
0.6
0.8
1
0 20 40 60 80 100
Right key
100 wrong trials
(b)
0
0.2
0.4
0.6
0.8
1
0 20 40 60 80 100
Right key
100 wrong trials
(c)
−0.2
0
0.2
0.4
0.6
0.8
1
0 20 40 60 80 100
Right key
100 wrong trials
(d)
Figure 3: (a) Original and watermarked signals, (b) detection results for STFT coefficients, (c) detection results for SM coefficients and L =
10, (d) detection results for SM coefficients and L = 32 (SNR = 24 dB).
SNR is around 27 dB. The watermark imperceptibility has
been proven by using ABX listening test as in the first
example. Again, the watermarked signal is perceptibly similar
to the original one. The detection is performed by using
correlation detector that includes cross-terms in the time-
frequency domain (L
= 32). The responses of the proposed
detector for right and wrong keys are shown in Figure 6.
The threshold is set as T
= (D
w
r
+ D
w
w
)/2, where D
w
r
and
D
w
w
represent the mean values of the detector responses for
right keys (watermarks) and wrong trials, respectively. The
calculated measure of detection quality is R
= 7.5, this means
that the probability of detection error is equal to 5
·10
−8
.
The obtained probabilities of error for other signals (tested
in Example 1) are of order 10
−8
as well.
In the sequel, the procedure is tested on various attacks,
such as Mp3 compression for different bit rates, time scaling,
Srdjan Stankovi
´
cetal. 7
−0.2
0
0.2
0.4
0.6
0.8
1
0 50 100
Right key
100 wrong trials
(a)
−0.2
0
0.2
0.4
0.6
0.8
1
0 50 100
Right key
100 wrong trials
(b)
−0.2
0
0.2
0.4
0.6
0.8
1
0 50 100
Right key
100 wrong trials
(c)
Figure 4: Detection results for three out of all tested signals.
−0.4
0
0.52
1
0 20406080100
Right key
100 wrong trials
(a)
0.4
0
1
0 20406080100
Right key
100 wrong trials
(b)
Figure 5: Detection results for watermark modeled to follow
middle frequency formants (a) f
max
= 4 kHz, (b) f
max
= 11.025 kHz.
pitch scaling, echo, amplitudes normalization, and so forth.
The results of detection in terms of quality measure R,
and corresponding probabilities of detection error P
err
are
given in Tab le 1 . The most of attacks are realized by using
CoolEditPro v2.0, while the rest of the processing is done in
Matlab 7.
Note that a plenty of considered attacks are strong, and
they introduce a significant signal distortion. For example,
in the existing audio watermarking procedures, usually
applied time scaling is up to 4%, wow and flutter up to
0.5% or 0.7%, echo 50 milliseconds or 100 milliseconds
[4, 25]. We have applied stronger attacks to show that,
even in this case, the proposed method provides high
robustness with very low probabilities of detection error (see
Ta ble 1). Note that these results were obtained with a higher
watermark bit rate (more details will be provided in the
8 EURASIP Journal on Advances in Signal Processing
−0.5
0
0.5
1
1.5
2
2.5
3
3.5
4
×10
26
0 500 1000 1500 2000 2500 3000
Right keys
Wrong trials
Figure 6: The responses of the proposed detector for 50 right keys
and 3000 wrong trials.
Table 1: Measures of detection quality and probabilities of error for
different attacks.
Attack
R P
err
No attack
7.5 10
−8
Mp3 (constant bit rate:
8Kbps)
6.92 10
−7
Mp3 (variable bit rate
75–120 Kbps)
6.8 10
−7
Mp3 (variable bit rate
40–50 Kbps)
6.23 10
−6
Delay: mono light echo
(180 ms, mixing 20%)
6.9 10
−7
Echo (200 ms)
6.8 10
−7
Time stretch (±15%)
6.2 10
−6
Wow (delay 20%)
6.3 10
−6
Bright flutter (deep 10,
sweeping rate 5 Hz)
6.8 10
−7
Deep flutter (central freq.
1000 Hz, sweeping rate 5 Hz,
modes-sinusoidal, filter
type-low pass)
6.82 10
−7
Amplitude: normalize (100%)
6.95 10
−7
Wow (delay 10%) and bright
flutter
6.72 10
−6
Pitch scaling ±5%
5.6 10
−5
Additive Gaussian noise (SNR
= −35 dB)
6.9 10
−7
next subsection). The time-scale modification (TSM) is one
of the challenging attacks in audio watermarking that has
specially been considered in the recentliterature [24]. Very
few algorithms can resist these desynchronization attacks
[24]. Here, we have applied TSM—time stretch up to
±15%
by using software tool CoolEditPro v2.0. However, the low
probability of detection error is still maintained. Only in the
case of pitch scaling the obtained probability of error was
lower (see Ta ble 1), but still satisfying.
Apart from the very low probabilities of detection
error, an additional advantage of the proposed detection is
in providing more flexibility related to desynchronization
between frequencies of the watermark sequence embedded
in the signal and watermark sequence used for detection.
The correlation effects are enhanced since the detection is
performed within the whole time-frequency region covered
with a large number of cross-terms apart from the autoterms.
In the sequel, the achieved payload and some related
applications are given.
4.1. Data payload
In this example, we have used a single voiced part to embed
a pseudorandom sequence that represents one bit of infor-
mation. The approximate length of watermark, obtained as
modeled pseudorandom sequences, is 1000 samples (125
milliseconds for a signal sampled at 8000 Hz). Data payload
varies between 4 bps and 8 bps, depending on the duration of
voiced speech regions. In the case of speech signal sampled
at 44100 Hz, the achievable data payload is 22 bps. In this
way we have provideda required compromise between data
payload and robustness. Thus, the proposed algorithm can
be efficiently used for copyright and ownership protection,
copy and access control [1].
Note that the data payload can be increased by using
shorter sequences. If we consider the watermark sequence
with 500 samples (that correspond to 62.5 milliseconds of
signal sampled at 8000 Hz) the data payload is increased
twice (up to 16 bps). However, the probability of detection
error increases to 10
−4
. On the other hand, the probability of
detectionerrorcandecreaseevenbellow10
−8
by considering
lower watermark bit rates.
5. CONCLUSION
An efficient approach to watermarking of speech signals in
the time-frequency domain is presented. It is based on the
cross-terms free S-method and the time-varying filtering
used for watermark modeling. The watermark impercepti-
bility is provided by adjusting the location and the strength
of watermark to the selected speech components within
the time-frequency region. Also, the efficient watermark
detection based on the use of cross-terms in time-frequency
domain is provided. The number of cross-terms employed
in the detection procedure is controlled by the window
length used in the calculation of S-method. The experimental
results demonstrate that the procedure assures convenient
and reliable watermark detection providing low probability
of error. The successful watermark detection has been
demonstrated in the case of various attacks.
Srdjan Stankovi
´
cetal. 9
ACKNOWLEDGMENT
This work is supported by the Ministry of Education and
Science of Montenegro.
REFERENCES
[1] N. Cveji
´
c, Algorithms for audio watermarking and steganog-
raphy, Academic Dissertation, University of Oulu, Oulu,
Finland, 2004.
[2] H. J. Kim, “Audio watermarking techniques,” in Proceedings
of the Pacific Rim Workshop on Digital Steganography,Kyushu
Institute of Technology, Kitakyushu, Japan, July 2003.
[3] I. J. Cox, J. Kilian, F. T. Leighton, and T. Shamoon, “Secure
spectrum watermarking for multimedia,” IEEE Transactions
on Image Processing, vol. 6, no. 12, pp. 1673–1687, 1997.
[4] D. Kirovski and H. S. Malvar, “Spread-spectrum watermarking
of audio signals,” IEEE Transactions on Signal Processing, vol.
51, no. 4, pp. 1020–1033, 2003.
[5] C P. Wu, P C. Su, and C C. Jay Kuo, “Robust and efficient
digital audio watermarking using audio content analysis,” in
Security and Watermarking of Multimedia Contents II, vol.
3971 of Proceedings of SPIE, pp. 382–392, San Jose, Calif, USA,
January 2000.
[6] M. F. Mansour and A. H. Tewfik, “Audio watermarking by
time-scale modification,” in Proceedings of the IEEE Intern-
tional Conference on Acoustics, Speech, and Signal Processing
(ICASSP ’01), vol. 3, pp. 1353–1356, Salt Lake City, Utah, USA,
May 2001.
[7] M. Steinebach and J. Dittmann, “Watermarking-based digital
audio data authentication,” EURASIP Journal on Applied
Signal Processing, vol. 2003, no. 10, pp. 1001–1015, 2003.
[8] S. Stankovi
´
c, I. Djurovi
´
c, and L. Pitas, “Watermarking in
the space/spatial-frequency domain using two-dimensional
Radon-Wigner distribution,” IEEE Transactions on Image
Processing, vol. 10, no. 4, pp. 650–658, 2001.
[9] S. Kay and G. Boudreaux-Bartels, “On the optimality of
the Wigner distribution for detection,” in Proceedings of the
IEEE International Conference on Acoustics, Speech, and Signal
Processing (ICASSP ’85), vol. 10, pp. 1017–1020, Tampa, Fla,
USA, April 1985.
[10] B. Barkat and K. Abed-Meraim, “Algorithms for blind com-
ponents separation and extraction from the time-frequency
distribution of their mixture,” EURASIP Journal on Applied
Signal Processing, vol. 2004, no. 13, pp. 2025–2033, 2004.
[11] C. Ioana, A. Jarrot, A. Quinquis, and S. Krishnan, “A
watermarking method for speech signals based on the time-
warping signal processing concept,” in Proceedings of the
IEEE International Conference on Acoustics, Speech and Signal
Processing (ICASSP ’07), vol. 2, pp. 201–204, Honolulu,
Hawaii, USA, April 2007.
[12] S. Stankovi
´
c, I. Orovi
´
c, N.
ˇ
Zari
´
c, and C. Ioana, “An approach
to digital watermarking of speech signals in the time-
frequency domain,” in Proceedings of the 48th International
Symposium ELMAR Focused on Multimedia Signal Processing
and Communications, pp. 127–130, Zadar, Croatia, June 2006.
[13] B. Boashash, “Time-frequency signal analysis,” in Advances in
Spectrum Analysis and Array Processing, S. Haykin, Ed., chapter
9, pp. 418–517, Prentice Hall, Englewood Cliffs, NJ, USA,
1991.
[14] L. Stankovi
´
c, “A method for time-frequency signal analysis,”
IEEE Transactions on Signal Processing, vol. 42, no. 1, pp. 225–
229, 1994.
[15] I. Djurovi
´
c and L. Stankovi
´
c, “A virtual instrument for time-
frequency analysis,” IEEE Transactions on Instrumentation and
Measurement, vol. 48, no. 6, pp. 1086–1092, 1999.
[16] D. Petranovi
´
c, S. Stankovi
´
c, and L. Stankovi
´
c, “Special purpose
hardware for time frequency analysis,” Electronics Letters, vol.
33, no. 6, pp. 464–466, 1997.
[17] S. Stankovi
´
c, L. Stankovi
´
c, V. Ivanovi
´
c, and R. Stojanovi
´
c,
“An architecture for the VLSI design of systems for time-
frequency analysis and time-varying filtering,” Annales des
Telecommunications, vol. 57, no. 9-10, pp. 974–995, 2002.
[18] S. Stankovi
´
c, “About time-variant filtering of speech signals
with time-frequency distributions for hands-free telephone
systems,” Signal Processing, vol. 80, no. 9, pp. 1777–1785, 2000.
[19] Q. Li, J. Zheng, A. Tsai, and Q. Zhou, “Robust endpoint
detection and energy normalization for real-time speech and
speaker recognition,” IEEE Transactions on Speech and Audio
Processing, vol. 10, no. 3, pp. 146–157, 2002.
[20] G. S. Ying, C. D. Mitchell, and L. H. Jamieson, “Endpoint
detection of isolated utterances based on a modified Teager
energy measurement,” in Proceedings of the IEEE International
Conference on Acoustics, Speech, and Signal Processing (ICASSP
’93), vol. 2, pp. 732–735, Minneapolis, Minn, USA, April 1993.
[21] L. Gu and S. Zahorian, “A new robust algorithm for isolated
word endpoint detection,” in Proceedings of the IEEE Interna-
tional Conference on Acoustics, Speech, and Signal Processing
(ICASSP ’02), vol. 4, pp. 4161–4164, Orlando, Fla, USA, May
2002.
[22] S. Stankovi
´
c, I. Djurovi
´
c, R. Herpers, and L. Stankovi
´
c, “An
approach to optimal watermark detection,” AEU International
Journal of Electronics and Communications,vol.57,no.5,pp.
355–357, 2003.
[23] B S. Ko, R. Nishimura, and Y. Suzuki, “Time-spread echo
method for digital audio watermarking,” IEEE Transactions on
Multimedia, vol. 7, no. 2, pp. 212–221, 2005.
[24] S. Xiang and J. Huang, “Histogram-based audio watermarking
against time-scale modification and cropping attacks,” IEEE
Transactions on Multimedia, vol. 9, no. 7, pp. 1357–1372, 2007.
[25] N. Cveji
´
candT.Sepp
¨
anen, “Improving audio watermarking
scheme using psychoacoustic watermark filtering,” in Pro-
ceedings of the 1st IEEE International Symposium on Signal
Processing and Information Technology, pp. 169–172, Cairo,
Egypt, December 2001.