Báo cáo hóa học: " Research Article Reiterative Robust Adaptive Thresholding for Nonhomogeneity Detection in Non-Gaussian Noise" pot
Bạn đang xem bản rút gọn của tài liệu. Xem và tải ngay bản đầy đủ của tài liệu tại đây (951.5 KB, 11 trang )
Hindawi Publishing Corporation
EURASIP Journal on Advances in Signal Processing
Volume 2008, Article ID 786136, 11 pages
doi:10.1155/2008/786136
Research Article
Reiterative Robust Adaptive Thresholding for
Nonhomogeneity Detection in Non-Gaussian Noise
A. Younsi,
1
A. M. Zoubir,
2
and A. Ouldali
1
1
Department of Elctronics, Ecole Militaire Polytechnique, BP 17, 16112 Bordj El Bahri, Algier s, Algeria
2
Signal Processing Group, Darmstadt University of Technology, Merckstraße 25, 64283 Darmstadt, Germany
Correspondence should be addressed to A. Younsi,
Received 24 October 2007; Revised 4 April 2008; Accepted 23 June 2008
Recommended by Satya Dharanipragada
A robust and data-dependent adaptive thresholding algorithm for nonhomogeneity detection in non-Gaussian interference is
addressed. The algorithm is to be used as a preprocessing technique to select a set of homogeneous data from a bulk of
nonhomogeneous compound-Gaussian secondary data employed for adaptive radar. An iterative version of the algorithm is also
suggested in situations of multiple outliers in the secondary data. Performance analysis is conducted with simulated data as well as
with real sea clutter data.
Copyright © 2008 A. Younsi et al. This is an open access article distributed under the Creative Commons Attribution License,
which permits unrestricted use, distribution, and reproduction in any medium, provided the original work is properly cited.
1. INTRODUCTION
The deleterious impact of nonhomogeneous secondary
data in covariance estimation for adaptive radar systems
has been widely reported [1–6]. Typically, the unknown
interference covariance matrix is estimated from a set of
identically and independently distributed (iid) target-free
data, which is representative for the interference statistics in
a cell under test (CUT). Frequently, the secondary data is
subject to contamination by discrete scatterers or interfering
targets (outliers). In both events, the training data becomes
nonhomogeneous, leading to a nonrepresentative set for the
interference in the CUT. Estimates of the covariance matrix
from nonhomogeneous training data result in under-nulled
clutter. Consequently, constant false alarm rate (CFAR) and
detection performance are greatly degraded. This has led to
the development of improved training data selection tech-
niques, seeking to discard bins that are nonhomogeneous
from the bulk of training data, and using the resulting
outlier-free data for covariance matrix estimation.
Recently, several algorithms for outlier removal have
been proposed [7–9]. The works of [7, 9] addressed the
use of the nonhomogeneity detector (NHD) based on the
generalized inner product (GIP) measure involving Gaussian
interference scenarios. However, in most practical situations,
the Gaussian model is no longer valid. In particular, for
high-resolution radars operating at low grazing angles,
or in a maritime environment, a satisfactory fit of the
clutter amplitude probability density function (apdf) can be
achieved through families of non-Gaussian distributions [10,
11]. For this non-Gaussian interference, the corresponding
nonhomogeneity detection problem has received limited
attention. This is due to the fact that there is no unique model
for representing the joint probability density function (pdf)
ofasetofK-correlated non-Gaussian random variables.
In [12], the interference has been modeled by a spherically
invariant random process (SIRP) with the pdf of the texture
assumed to be known apriori. Also, in [12] the expectation
maximization (EM) algorithm is used to estimate the
interference covariance matrix from representative training
data, generally those in the neighborhood of the CUT,
sharing the covariance structure of the CUT. The estimated
covariance matrix is then used in a scale invariant test
for nonhomogeneity detection, where a data-independent
fixed threshold for excision is numerically calculated with
respect to a type-I error criterion. The type-I error, denoted
P
e
in this paper, is the probability of incorrectly excising
homogeneous data. In real-life situations, in addition to the
fact that the texture PDF is unknown, the methods cited
above suffer from masking effects. This problem appears
when, for example, one or multiple interfering targets are
present in the vicinity of the CUT.
In the process of outlier removal, the most important
issue is the setting of the threshold for excision. A survey
2 EURASIP Journal on Advances in Signal Processing
of previous works in this area reveals two basic approaches.
First, a prescribed number of bins corresponding to the
outlier values may be removed (see [8] and references
therein). This leads to an improved result, but it is not
clear how to optimally choose the number of bins to be
removed. In a second approach, the threshold setting is
based on the knowledge of the pdf of the test statistic used
for the NHD. This method works well if the assumed pdf
accurately represents the data. However, the presence of
nonhomogeneities can significantly alter this pdf, making the
set threshold inaccurate for practical use.
This paper presents a data-dependent adaptive thresh-
olding algorithm that can be used for nonhomogeneity
detection in compound-Gaussian noise. The proposed algo-
rithm does not require the knowledge of the texture pdf,
the noise, and the number of targets to be removed. We use
the bootstrap [13] to estimate the pdf of the test statistic
from which the threshold for excision is set according to
a prescribed type-I error P
e
= α. For multiple targets, an
iterative version of the algorithm is proposed. The test has
to be applied to nonhomogeneous secondary data in order
to select a homogeneous set. The latter is to be used for
estimating the noise covariance matrix in an adaptive radar
detector.
The paper is organized as follows: Section 2 presents
some preliminaries. In Section 3, we present the NHD
test statistic based on the bootstrap principle. Performance
analysis with simulated as well as real sea clutter data is
shown and discussed in Section 4. A comparison with other
existing methods is also included. Conclusion is given in
Section 5.
2. PRELIMINARIES
Let z
i
, i = 1, , K,denoteK identically and independently
distributed (iid) complex vectors from secondary data.
Under the compound-Gaussian model, z
i
= [
z
1
z
2
···z
N
]
T
can be written as [10, 11]
z
i
=
√
τ
i
x
i
(1)
with x
i
∼CN(0, R) is the speckle component following a com-
plex normal pdf with zero mean and unknown covariance
matrix R, τ
i
∼f
τ
i
(τ
i
), is a positive random variable called the
texture component and f
τ
1
(τ
1
) = ··· = f
τ
K
(τ
K
) = f
τ
(τ)
is the texture pdf, which is unknown in this paper. One of
the most popular high-resolution radar clutter models is the
K-distribution model which is obtained when assuming that
the texture is Gamma distributed, that is,
f
τ
(τ) =
1
Γ(ν)
ν
μ
ν
τ
ν−1
exp
−
ν
μ
τ
U(τ)(2)
with mean value E(τ)
= μ, which is also the average clutter
power, and shape parameter ν. The lower the value of ν, the
spikier is the clutter. The product model of (1) corresponds
to the case of texture completely correlated in azimuth.
This model accurately describes the scattering mechanism
for observation time intervals in the order of the coherent
processing interval of the radar system [14].
As mentioned before, an adaptive radar uses the K
training vectors, supposed to be homogeneous, to estimate
the covariance matrix of the noise in the cell under test [15].
If outliers resembling a target of interest are present in the
data, a preprocessing step is needed to excise them [16]. This
can be cast in the following statistical hypothesis test:
H
0
:datahomogeneous,
H
1
: data non-homogeneous.
(3)
Most of the methods used in the Gaussian case for this
purpose rely on the GIP given by
P
i
= z
H
i
R
−1
S
z
i
,(4)
where
R
S
=
1
K
K
i=1
z
i
z
H
i
(5)
is the sample covariance matrix which is also the maximum
likelihood estimate (ML) of R calculated from range bins
surrounding the CUT [15]. The cell bins corresponding
to P
i
>γare declared to be outliers and discarded. The
remaining ones are then used to estimate the covariance
matrix. The threshold γ is set according to a certain criterion
(see [8, 9] and references therein for more details).
For the compound-Gaussian case, the GIP statistic
cannot be directly applied since in this case, the sample
covariance matrix
R
S
does not estimate correctly the true
covariance matrix. Reference [17] contains relevant methods
to estimate the covariance matrix of heavy tailed noise.
Our aim is to detect the presence of interfering targets
in the secondary data. To this end, denote by p
i
the N-
dimensional complex vector representing these outliers and
z
i
the received signal from the ith range cell. The test for
nonhomogeneity can then be recast in the following test:
H
0
: z
i
=
√
τ
i
x
i
,
H
1
: z
i
= p
i
+
√
τ
i
x
i
.
(6)
Bearing in mind that we are concerned with training data
containing interfering targets, which share the same steering
vector as that of the desired target, we can model p
i
as: p
i
=
α
i
s,wheres is the steering vector of interest.
The test statistic, which is widely used for Gaussian as
well as non-Gaussian noise for this kind of problems, is given
by the adaptive coherence estimator (ACE) [12, 18–20]
T
z
i
=
s
H
R
−1
z
i
2
s
H
R
−1
s
z
H
i
R
−1
z
i
,(7)
where
R is an appropriate estimate of the covariance matrix.
Since the texture PDF is unknown, we should use an
estimate of R, which is robust or at least independent of this
PDF.
A. Younsi et al. 3
2.1. Robust estimation of the covariance matrix
In [18], a robust estimator of the covariance matrix, known
as the normalized sample covariance matrix (NSCM), was
proposed and given by
R
NSCM
=
1
K
K
j=1
j
/
=i
z
j
z
H
j
τ
j
,(8)
where
τ
j
is the estimate of the texture component in the jth
bin based on the method of moments given by
τ
j
=
z
H
j
z
j
N
. (9)
Inserting (9)in(8), we get
R
NSCM
=
N
K
K
j=1
j
/
=i
z
j
z
H
j
z
H
j
z
j
. (10)
The choice of the estimator in (10) is motivated by its easy
implementation. Other estimators of R can be used, such as
in [17, 21, 22], but they require much more computations.
It is interesting to note that the test statistic of (7)with
R given by the NSCM of (10) is independent of the texture
PDF. This is of great importance in practical situations where
this PDF is generally unknown and even if it were, the
corresponding parameters are always unknown and must be
estimated from the data. This requires a large number of
samples which is not always available. One notes that for the
obtained test statistic there is no closed-form expression for
its pdf. This means that we cannot set the excision threshold
analytically. We will use therefore an alternative way based on
the boostrap to set this threshold.
2.2. Bootstrap-based detection
In the next section, we will use the bootstrap to detect
nonhomogeneities in the secondary data. We therefore give a
brief review of the bootstrap-based detection. The bootstrap
is a general tool to solve difficult statistical problems. It is
extremely valuable in situations of unknown distributions
and where data sizes are too small to invoke asymptotic
results. Two principles are at its core: substituting estimates
for unknowns and replacing tedious mathematical analysis
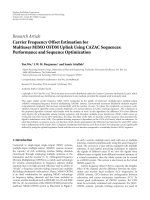
with computer simulations. Figure 1 gives the basic idea
of the general bootstrap detection procedure. Essentially,
the bootstrap provides a data-dependent threshold for the
detector. This threshold is computed from a large number
of realizations of T(x
∗
) based on data resampled (bootstrap
data) from one set of observations (original data). The
resampling procedure is usually done by using a pseudoran-
dom number generator to draw a new random sample X
∗
of
the same size as X, with replacement, from the original set X.
To e n s u r e a t y p e - I e r r o r P
e
= α, the threshold must be set as
the (1
− α) quantile of the empirical distribution of the test
T(x
∗
).
Compute threshold
1. Sort T
∗
1
, T
∗
2
, , T
∗
B
⇒ T
∗
(1)
, T
∗
(2)
, , T
∗
(B)
2. Set γ = T
∗
(q)
where
q
=(1 −α)(B +1)
H
0
H
1
γ
T(x)
x
Resample
T(x
∗
1
)
T(x
∗
2
)
T(x
∗
B
)
x
∗
1
x
∗
2
.
.
.
x
∗
B
Bootstrap
data
Measure
data
Original data
T
∗
1
T
∗
2
T
∗
B
Figure 1: General bootstrap detection procedure for a nominal
P
e
= α and B bootstrap resamples.
The bootstrap-based methods are generally computa-
tionally very expensive, but in an area of exponentially
declining computational costs, computer-intensive methods
such as the bootstrap are becoming increasingly attractive.
These methods have found wide applications in diverse
fields such as engineering, astronomy, biology, genetics,
economics, and finance [23–27]. It is not surprising that
in the near future, the bootstrap will gain considerable
attention. In a recently published text book [24], we found
this comment “The revolution [bootstrap and jacknife
procedures] has not yet become widespread Nevertheless,
the revolution is happening and you should be prepared for
its eventual results.”
3. THE NHD TEST
Our NHD method compares the test statistic (7)toa
threshold γ.IfT(z
i
) >γ, the ith cell is declared to
be nonhomogeneous and eliminated. Thus the remaining
bins are used to get a new estimate of R. The method is
repeated to remove possible outliers in the secondary data
set. At the end of the iterative process, the survival set is
declared homogeneous and can be used by any adaptive
radar detector.
We will present now the method to set the excision
threshold γ. If the true or an asymptotic distribution of
the test statistic is known, it is relatively simple to set
the threshold according to the prescribed P
e
(analytically
or numerically). But this is not the case here since the
distribution of the test is unknown and an asymptotic one
is not available because the number of secondary data is
limited. In such situations, the bootstrap is well motivated
[13]. At each iteration, the distribution of the test statistic is
estimated using the bootstrap [25]andγ is set to be equal to
the (1
− α) quantile, where α is the desired type-I error P
e
.
The algorithm is as shown in Algorithm 1.
At the end of the algorithm, the survival set is decided to
be homogeneous.
4 EURASIP Journal on Advances in Signal Processing
Step 0. Data collection: Get the matrix of secondary data Z = [
z
1
z
2
···z
K
]from
K range bins surrounding the CUT.
Step 1. Resampling: After centering the data, resample with replacement to obtain
Z
∗
= [
z
∗
1
z
∗
2
···z
∗
K
].
Step 2. Bootstrap test statistic:Compute
(a) The sample bootstrap normalized covariance matrix using (10)as
follows:
R
∗
= (N/K)
K
j
=1,j
/
=1
(z
∗
j
z
∗H
j
/z
∗H
j
z
∗
j
)
(b) Compute T
∗
(z
∗
i
) using (7) with
R
∗
replacing
R.
Step 3. Repetition: Repeat Steps 1 and 2, B times to obtain T
∗
1
, T
∗
2
, , T
∗
B
.
Step 4. Thresholding:SortT
∗
1
, T
∗
2
, , T
∗
B
in increasing order to obtain T
∗
(1)
≤ T
∗
(2)
≤···≤T
∗
(B)
.
Set the threshold γ
∗
=(1 −α)(B +1). From the initial set Z eliminate
the snapshots z
i
such that T(z
i
) >γ
∗
,toobtainanewsetZ(i).
Step 5. Iterate: With the new set Z(i), repeat Steps 1 until 4, N
it
times
Algorithm 1
The number of iterations N
it
depends on the convergence
criterion to be used. One can set aprioria small number
of iterations. Another way to proceed is to stop the iterative
process if after a given number of successive iterations, no
outliers are detected. In the next section we will investigate
the performance of these two methods in homogeneous
clutteraswellasinnonhomogeneousclutter.
4. PERFORMANCE ANALYSIS
In this section, we analyze the performance of our proposed
algorithm in simulated K-distributed clutter, which is well
motivated for sea clutter [28], as well as in real sea clutter
collected by IPIX radar in February 1998. To the best of our
knowledge, this is the first time the bootstrap is tested with
real sea clutter.
4.1. Simulated clutter
We first consider the case of simulated clutter. The secondary
data is generated according to the product model (1). The
texture follows the pdf as given in (2). The covariance matrix
of the speckle component is generated according to [R]
i,j
=
ρ
|i−j|
. The one-lag correlation coefficient ρ is 0.9 (common
value for sea clutter [17]). The steering vector is taken to be
s
= (1/
√
N)[
11···1
]
T
. We consider the homogeneous
as well as the nonhomogeneous secondary data (presence
of interfering targets) case. At the first stage, we set the
number of iterations N
it
= 1 for both the homogeneous
and nonhomogeneous situation. Later on, we will present an
automatic iterative version of the algorithm.
4.1.1. The homogeneous case
In all the following, when not stated otherwise, the number
of bootstrap resamples is B
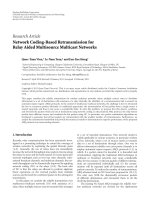
= 100, [29]. Figure 2 shows the
test statistic versus range in a homogeneous situation (no
interfering targets in the secondary cells) for spiky clutter
(ν
= 0.5) with the following test parameters: μ = 1,
N
= 8, K = 32, N
it
= 1, and P
e
= 0.025. We see that
the values of the test statistic do not exceed the threshold,
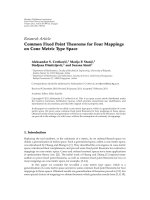
confirming homogeneity of the data. Figure 3 shows also
a homogeneous situation for a very spiky clutter (ν
=
0.1) with the same test parameters as before. Even if the
clutter is very spiky, the test does not exceed the threshold.
Figure 4 depicts the case of large data samples with P
e
=
0.01. One notes that, for a large number of secondary data,
it is necessary to choose low values of P
e
, because high
values of P
e
(corresponding to lower thresholds) lead to
erroneously discarded homogeneous data. This situation can
be avoided in practice if the number of secondary range
bins is not taken too large so as to avoid nonhomogeneities.
Experimental tests have demonstrated that the number of
homogeneous secondary data is often limited [30]. In a
practical radar system, P
e
is a design parameter which is set
by the operator according to a certain tolerable level of false
rejecting homogenous data. It is desirable to minimize this
error since we do not wish to edit out range bins that do not
contain interfering targets. On the other hand, relatively high
values of P
e
allowustodetectoutlierswithlowpowerlevel.
Therefore, the design of P
e
is always a compromise between
all these constraints.
Figure 5 plots the bootstrap and Monte Carlo cumulative
density functions (CDF) of the test statistic for different
values of N and K. One notes the negligible difference
between the Monte Carlo CDF and the estimated CDF using
the bootstrap.
To investigate the impact on P
e
,wesetaprescribedvalue
of P
e
0
= 0.025 and run 5000 Monte Carlo simulations on
homogeneous data and estimate the actual probability of
error P
e
. Tables 1, 2, 3,and4 show the ratio P
e
/P
e
0
for
different values of N, K,andν.Wehaveconsideredseveral
values of the shape parameter ν, starting from low values
corresponding to a spiky clutter to high values corresponding
A. Younsi et al. 5
51015202530
Range
0
0.2
0.4
0.6
0.8
1
1.2
Test statistic
N = 8, K = 32
P
e
= 0.025
Test statistic
Threshold
Figure 2: Test statistic versus range in K-distributed homogeneous
clutter, where ν
= 0.5, μ = 1, N = 8, K = 32, N
it
= 1, and P
e
=
0.025.
51015202530
Range
0
0.2
0.4
0.6
0.8
1
1.2
Test statistic
N = 8, K = 32
P
e
= 0.025
Test statistic
Threshold
Figure 3: Test statistic versus range in K-distributed homogeneous
clutter, where ν
= 0.1, μ = 1, N = 8, K = 32, N
it
= 1, and P
e
=
0.025.
to a less spiky clutter. It is worth observing that in a real-live
situation, the shape parameter varies from range cell to range
cell [28, 31, 32] leading to secondary data with different
measure of clutter spikiness. From the results, one can see
that the error ratio is approximately constant for a given N
to K ratio as a function of shape parameter.
4.1.2. The nonhomogeneous case
We now consider the nonhomogeneous case. We inject for
example an interfering target in the range bin number K/2,
and assess the capability of the algorithm to excise it (this
50 100 150 200 250
Range
0
0.02
0.04
0.06
0.08
0.1
0.12
0.14
0.16
Test statistic
N = 64, K = 256
N
it
= 1; P
e
= 0.01
Test statistic
Threshold
Figure 4: Test statistic versus range in K-distributed homogeneous
clutter, where ν
= 0.1, μ = 1, N = 64, K = 256, N
it
= 1, and
P
e
= 0.01.
00.20.40.60.81
x
0
0.1
0.2
0.3
0.4
0.5
0.6
0.7
0.8
0.9
1
CDF
Theoritical CDF
Bootstrap CDF
N
= 8, K = 32
N
= 16, K = 64
Figure 5: Theoretical and bootstrap CDF of the test statistic in
homogeneous K-distributed clutter, where ν
= 0.5, μ = 1, and
B
= 100.
cell acts here as a CUT). We use the range bins surrounding
this CUT (which are homogeneous in this case) to set
the adaptive threshold according to the algorithm. Figure 6
depicts the result where it is apparent that the algorithm
detects the nonhomogeneity.
The situation of Figure 6 is repeated 1000 times for N
= 8
and different values of K. Tab le 5 shows the number of times
the CUT exceeds the threshold. Similar results were also
obtained with different values of N and K but not reported
here.
Until now, we have considered that the range bins
surrounding the cell containing the nonhomogeneity used to
6 EURASIP Journal on Advances in Signal Processing
Table 1: The ratio P
e
/P
e
0
for μ = 1, ν = 0.5, and P
e
0
= 0.025 in
homogeneous clutter.
NK P
e
/P
e
0
832 0.40
848 0.48
864 0.72
16 48 0.22
16 64 0.46
16 128 0.78
32 128 0.36
32 256 0.60
32 512 0.72
Table 2: The ratio P
e
/P
e
0
for μ = 1, ν = 1.5, and P
e
0
= 0.025 in
homogeneous clutter.
NK P
e
/P
e
0
832 0.41
848 0.53
864 0.63
16 48 0.21
16 64 0.38
16 128 0.64
32 128 0.4
32 256 0.60
32 512 0.72
Table 3: The ratio P
e
/P
e
0
for μ = 1, ν = 2.5, and P
e
0
= 0.025 in
homogeneous clutter.
NK P
e
/P
e
0
832 0.33
848 0.59
864 0.66
16 48 0.36
16 64 0.44
16 128 0.60
32 128 0.39
32 256 0.61
32 512 0.72
set the adaptive threshold are themselves homogeneous. In
practical situations, this is not always true. For example, in
a dense target environment, two or more range bins, not far
from each other, can contain targets. Inevitably, this affects
the threshold setting and leads to the masking effect.
To illustrate this phenomenon, we consider the same
situation as in Ta bl e 5 , except that we inject randomly in
one or more range bins surrounding the CUT another
interfering target (outliers). Let n
i
denote the number of
injected outliers. Column 3 of Ta bl e 6 shows the performance
of the NHD detector for different situations with N
= 8,
μ
= 1, and ν = 0.5. The detection of the interfering target in
the CUT is seriously affected by the contamination number
n
i
,comparedtoTa bl e 5 .
Table 4: The ratio P
e
/P
e
0
for μ = 1, ν = 5, and P
e
0
= 0.025 in
homogeneous clutter.
NK P
e
/P
e
0
832 0.37
848 0.60
864 0.64
16 48 0.22
16 64 0.38
16 128 0.62
32 128 0.38
32 256 0.75
32 512 0.80
51015202530
Range
0
0.2
0.4
0.6
0.8
1
1.2
Test statistic
N = 8, K = 32
P
e
= 0.025
Test statistic
Threshold
Interfering target
Figure 6: Test statistic versus range in nonhomogeneous K-
distributed clutter with n
i
= 1 interfering target using N
it
= 1
iteration, where ν
= 0.5, μ = 1, N = 8, K = 32, and P
e
= 0.025.
Table 5: Performance of the NHD for μ
= 1andν = 0.5in
nonhomogeneous clutter.
NK Exceedences
8 32 903
8 48 909
8 64 912
16 48 932
16 64 941
16 128 945
To alleviate this problem, a heuristic solution can be
considered by increasing the number of iterations N
it
. But the
question is how to choose this number or equivalently, what
is the convergence criterion? Here we adopt an automatic
stopping rule as follows: if after two successive iterations no
outliers are detected, the algorithm is stopped. To check the
performance of this method, we consider again the same
situation as before. The results obtained are shown in column
A. Younsi et al. 7
Table 6: Performance of the NHD for N = 8, μ = 1, and ν = 0.5in
nonhomogeneous clutter.
Kn
i
N
it
= 1AutomaticN
it
32 1 621 874
32 2 470 850
48 1 713 906
48 2 523 901
Table 7: The ratio P
e
/P
e
0
of the automatic detector for μ = 1, ν =
0.5, and P
e
0
= 0.025 in homogeneous and nonhomogeneous clutter.
NK n
i
P
e
/P
e
0
8 32 0 0.41
8 48 0 1.08
864 0 1.4
8 32 1 0.49
8 48 1 1.16
864 1 1.4
4ofTa bl e 6 . We see that the detection of the interfering target
in the CUT is improved considerably.
To complete the performance analysis of this automatic
NHD, we must look at its influence on the probability of
error. As in Ta bl e 1 , we run 5000 Monte Carlo simulations
in homogeneous and nonhomogeneous clutter and estimate
the actual probability of error. The ratio P
e
/P
e
0
is shown in
Ta ble 7.
In Figure 7, we plot the NHD test used in [2, 3, 7]
which compares the GIP statistic z
H
i
R
−1
S
z
i
to its theoretically
mean value N.InFigure 8, we plot the NHD test proposed
in [9], comparing the normalized GIP z
H
i
R
−1
S
z
i
/K with
the threshold-setting determined according to [9,equation
(4.2)]. Here
R
S
is simply the sample covariance matrix. It
is evident that, for almost range bins, the GIP and the
normalized GIP statistics exceed the threshold, leading to
the declaration of nonhomogeneity, when in fact, the data
is homogeneous. For the same data set, the proposed test
statistic using the bootstrap and ACE decides for homogene-
ity of the set under test (see Figure 9). To confirm the results
of these Figures, we conduct a Monte carlo analysis with the
GIP and normalized GIP statistics. We found P
e
/P
e
0
= 15.5
for the GIP and P
e
/P
e
0
= 8.8 for the normalized GIP. We
observe a drastic degradation of P
e
with the two methods
allowing us to claim that the GIP and the normalized GIP
statistics cannot be used in non-Gaussian clutter.
4.2. Real sea clutter data
This section is devoted to the performance assessment of
the algorithm in the presence of real sea clutter collected
by the X-band McMaster university, Canada, IPIX radar
in February 1998 [33]. Tab le 8 shows the specifications of
the data files which are exploited here. The data is first
preprocessed in order to remove the DC offset and the phase
imbalance due to hardware imperfections and then stored
in an N
t
× N
c
complex matrix. A detailed statistical analysis
0 102030405060
Range
0
5
10
15
20
25
30
35
40
GIP statistic
N = 8, K = 64
P
e
= 0.025
Test statistic
Threshold
Figure 7: GIP statistic versus range in homogeneous K-distributed.
ν
= 0.5, μ = 1, N = 8, K = 64, and P
e
= 0.025.
0 102030405060
Range
0
0.1
0.2
0.3
0.4
0.5
0.6
0.7
Normalized GIP
N = 8, K = 64
P
e
= 0.025
Test statistic
Threshold
Figure 8: Normalized GIP statistic versus range in homogeneous
K-distributed clutter, where ν
= 0.5, μ = 1, N = 8, K = 64, and
P
e
= 0.025.
of adopted real data has been conducted in [31] for the file
19980204
−
220849 and [32] for the file 19980223
−
165836.
The results have shown that the former data set follows a
generalized K-distribution model and the later follows a K-
distribution.
The procedure used to assess the performances is now
described. We consider an N
× (K + 1) data window, where
N is the number of pulses and K the number of secondary
cells, the primary cell denoted by P
c
is set in the middle of
the window. The data window is slid in space from range
bin to range bin and in time from N samples to the next N
samples until the end of the data set. The total number of
8 EURASIP Journal on Advances in Signal Processing
0 102030405060
Range
0
0.1
0.2
0.3
0.4
0.5
0.6
0.7
0.8
0.9
1
Test statistic (bootstrap ACE)
Test statistic
Threshold
N
= 8, K = 64
P
e
= 0.025
Figure 9: Test statistic (using bootstrap ACE) versus range in
homogeneous K-distributed clutter, where ν
= 0.5, μ = 1, N = 8,
K
= 64, and P
e
= 0.025.
Table 8: Specifications of the sea clutter data.
File 19980204
−
220849 19980223
−
165836
Date 1998-02-04 1998-02-23
Time 22:08:49 16:58:36
Polarization Agility Agility
RF frequency 9.38 GHz 9.39 GHz
Pulse frequency PRF 1000 Hz 1000 Hz
Pulse length 200 ns 200 ns
Number of pulses N
t
60000 60000
Number of cells N
c
28 34
Azimuth angle 0.57129 degrees 342.2955 degrees
Grazing angle 0.23 degrees 0.38 degrees
Ranges 3201–4011 3000–3990m
Radar beam width 0.9 degrees 0.9 degrees
Range resolution 30 m 30 m
trials is N
trials
= (N
c
− K) × (N
t
/N). To evaluate the actual
probability of error P
e
, we perform the bootstrap-based
nonhomogeneity detector for each data window and count
the total number of times the test exceeds the threshold, say,
N
total
.TheactualP
e
is then P
e
= N
total
/N
trials
.
4.2.1. The homogeneous case
All the subsequent analyses assume that the steering vector
is s
= (1/
√
N)[1, exp(j2πf
d
T), ,exp(j2π(N −1) f
d
T)]
T
where T is the pulse repetition time and f
d
the Doppler
frequency which is chosen in order to coincide with the
peak of the clutter power spectral density (PSD) of the
considered data set. This is tantamount to considering the
worst case of a target embedded in deep clutter. We set the
prescribed probability of error to P
e
0
= 0.025. The results
Table 9: The ratio P
e
/P
e
0
for N = 8, K = 24, and B = 50.
File 19980204
−
220849 19980223
−
165836
Polarisation HH VV HH VV
fd(Hz)
−140 −140 −85 −85
P
e
/P
e
0
(N
it
= 1) 1.09 0.8 1.32 1.09
P
e
/P
e
0
(automatic) 1.25 1.12 1.92 1.49
51015202530
Range
0
0.2
0.4
0.6
0.8
1
1.2
Test statistic
Threshold
Figure 10: Test statistic in homogeneous real sea clutter from file
19980223
−
165836, with N = 8, K = 32, N
it
= 1, and P
e
0
= 0.025.
of the experiment are illustrated in Ta bl e 9 for different
polarization of the data set. The horizontally polarized data
shows a little increase in the P
e
because of the spiky nature of
the data on this polarization. The iterative algorithm using
the automatic stopping rule shows also a little increase in
the P
e
, this is due to the fact that in the homogeneous case,
increasing the number of iterations N
it
, we can discard some
cells even if they are homogeneous. This reduces the number
of homogenous secondary data to be used in covariance
estimation leading to an increased P
e
. One notes that P
e
is
approximately constant and very close to the prescribed value
for both the iterative and noniterative algorithm.
Figure 10 depicts the test statistic versus range in homo-
geneous real sea clutter.
4.2.2. The Nonhomogeneous case
We now inject an interfering target p
i
= α
i
s with an
interference to noise ratio defined as INR
= α
2
i
/E[z
2
] in the
primary cell P
c
. Figure 11 shows the test statistic versus range
where it is clear that the test in the primary cell exceeds the
threshold. In Figure 12, we plot the probability of correctly
rejecting (P
r
) this outlier, versus INR, following the same
procedure outlined before to estimate P
e
.
The situation of multiple outliers in the secondary data
is depicted in Figure 13, in addition to the interfering
target in P
c
, another interfering one with the same INR
A. Younsi et al. 9
51015202530
Range
0
0.2
0.4
0.6
0.8
1
1.2
Test statistic
Test statistic
Threshold
Interfering target
Figure 11: Test statistic versus range in real sea clutter. One
interfering target INR
= 10 dB. Data from file 19980223
−
165836,
with N
= 8, K = 32, N
it
= 1, and P
e
0
= 0.025.
0 5 10 15 20 25
INR (dB)
0
0.1
0.2
0.3
0.4
0.5
0.6
0.7
0.8
0.9
1
P
r
Figure 12: P
r
versus INR. Data from file 19980204
−
220849, with
N
= 8, K = 24, N
it
= 1, and P
e
0
= 0.025.
is injected randomly in the other cells. The figure shows
the performance of the algorithm using only one iteration
(N
it
= 1) and the algorithm using the automatic stopping
rule. One notes that with only one iteration the probability
of correctly rejecting the primary interfering target is highly
degraded (masking effect) while the iterative algorithm
improves considerably P
r
. Figure 14 shows another situation
where two interfering targets are present in the secondary
cells, here also the automatic algorithm gives the better P
r
.
In all the previous analysis, we have neglected the effect
of the receiver noise. This is often a realistic assumption since
in general, for radar systems with reliable detection perfor-
mance, the clutter power is much greater than the power
of the thermal noise. As an example, we have estimated the
0 5 10 15 20 25
INR (dB)
0.1
0.2
0.3
0.4
0.5
0.6
0.7
0.8
0.9
1
P
r
N
it
= 1
Automatic
Figure 13: P
r
versus INR. Data from file 19980204
−
220849, with
N
= 8, K = 24, P
e
0
= 0.025, and ni = 1.
0 5 10 15 20 25
INR (dB)
0.1
0.2
0.3
0.4
0.5
0.6
0.7
0.8
0.9
1
P
r
N
it
= 1
Automatic
Figure 14: P
r
versus INR. Data from file 19980204
−
220849, with
N
= 8, K = 24, P
e
0
= 0.025, and ni = 2.
clutter-to-thermal noise ratio (CNR) of the real data used
hereandwehavefoundCNR
6 dB and CNR 20 dB
for the file 19980204
−
220849 and the file 19980223
−
165836,
respectively. To investigate the effect of thermal noise on the
performance of our algorithm, we add an artificial noise to
the real data and estimate the actual probability of error.
The additional thermal noise is generated according to the
complex normal model CN(0, σ
2
I). Ta ble 10 shows the ratio
P
e
/P
e
0
versus the clutter-to-noise ratio CNR = μ/σ
2
.Wecan
conclude that for CNR
≥−5 dB the algorithm maintains
the probability of error approximately constant. This means
that the proposed algorithm is robust even in the presence of
high-level thermal noise. The degradation of P
e
grows with
the power of the additional noise.
10 EURASIP Journal on Advances in Signal Processing
Table 10: The ratio P
e
/P
e
0
versus CNR (dB) for N = 8, K = 24,
B
= 50, and HH polarization.
CNR (dB) File 19980223
−
165836 File 19980204
−
220849
51.2 1.1
0 1.1 1.03
−5 0.85 0.84
−10 0.63 0.66
02468101214161820222425
ICR (dB)
0
0.1
0.2
0.3
0.4
0.5
0.6
0.7
0.8
0.9
1
P
r
Clutter
Clutter + noise (CNR
= 0dB)
Clutter + noise (CNR
=−5dB)
Figure 15: P
r
versus INR. Data from file 19980204
−
220849 in the
presence of thermal noise, with N
= 8, K = 24, N
it
= 1, and P
e
0
=
0.025.
The impact of thermal noise on the probability of
correctly reject interfering targets is depicted in Figure 15 for
CNR
= 0 dB and CNR =−5 dB. For hight INRs, the effect of
thermal noise is insignificant. Elsewhere, the degradation of
P
r
is acceptable for CNR = 0 dB since the loss induced on the
INR is less than 2 dB but not for the case of CNR
=−5dB.
Finally, an other important point to consider is the
implementation issue. As all computer-intensive methods,
the bootstrap-based methods suffer from computational
complexity. The algorithm proposed here suffers also from
this problem since it requires an inversion of a data
matrix many times. It involves O(BN
it
KN
2
) floating point
operations, where we used the usual Landau notation O(n)
which means that an algorithm is O(n) if its implementation
requires a number of floating points operations (flops)
proportional to n. However, for some kinds of radar systems,
the parameters N and K are not very large, leading to a low-
dimension matrix to be inverted. N is the number of hits
during the time on target and it is dependant on the radar
parameters such as the scan rate, the bandwidth and the PRF.
As concerning the number of training data, in [34]anumber
K
= 5N was considered and in [35]aruleofthumbK ≥ 2N
was proposed. Also, some simplifications can be obtained in
practice by considering, for example, application of parallel
processing techniques since the supercomputing industry is
undergoing a significant resurgence in the development of
these techniques and in the development of processors with
very high speed. In addition to that, a suitable choice of
the matrix inversion algorithm (QR factorization techniques
are often employed in the matrix inversion) can significantly
reduce the computational burden.
5. CONCLUSION
We have presented a data adaptive thresholding algorithm
that can be used as a preprocessing stage for outlier removal
from secondary data, in an adaptive radar which uses an
estimate of the interference covariance matrix, from range
bins surrounding the cell under test. The noise is supposed
to follow the compound-Gaussian model. The proposed
algorithm does not require the knowledge of the pdf of
the spiky component of the clutter. It automatically adapts
the threshold according to the data it collects by means of
bootstrap estimation of the pdf of the test statistic. The
algorithm is tested with very spiky K-distributed simulated
clutter as well as with real sea clutter. In both cases, the
algorithm gives good results. For a critical situation with
multiple outliers in secondary data, an automatic iterative
version of the algorithm is suggested. The robustness of
the algorithm in the presence of thermal noise was also
considered and we found that the algorithm is robust even
in the presence of high-level thermal noise.
ACKNOWLEDGMENTS
The authors are grateful to Professor Maria Greco and
Professor Fulvio Gini from University of Pisa, Italy, for their
helpful comments and for providing the real sea clutter data.
Special thanks this to Dr. Said Aouada and Dr. Ramon Bercic
from the Signal Processing Group of Darmstadt University
of Technology, Germany, for their assistance. The comments
from the anonymous reviewers are also deeply appreciated.
REFERENCES
[1]L.J.Griffiths,P.M.Techau,J.S.Bergin,andK.L.Bell,
“Space-time adaptive processing in airborne radar systems,”
in Proceedings of the IEEE Radar International Conference,pp.
711–716, Alexandria, Va, USA, May 2000.
[2] W. L. Melvin and M. C. Wicks, “Improving practical space-
time adaptive radar,” in Proceedings of the IEEE Radar National
Conference, pp. 48–53, Syracuse, NY, USA, May 1997.
[3]W.L.Melvin,M.C.Wicks,andR.D.Brown,“Assessment
of multichannel airborne radar measurements for analysisand
design of space-time processing architectures and algorithms,”
in Proceedings of the IEEE Radar National Conference, pp. 130–
135, Ann Arbor, Mich, USA, May 1996.
[4] D. J. Rabideau and A. O. Steinhardt, “Improved adaptive
clutter cancellation through data-adaptive training,” IEEE
Transactions on Aerospace and Electronic Systems, vol. 35, no.
3, pp. 879–891, 1999.
[5] H. Wang and L. Cai, “On adaptive spatial-temporal processing
for airborne surveillance radar systems,” IEEE Transactions on
Aerospace and Electronic Systems, vol. 30, no. 3, pp. 660–670,
1994.
A. Younsi et al. 11
[6] J. Ward, “Space-time adaptive processing for airborne radar,”
Tech. Rep. 1015, MIT Lincoln Laboratory, Lexington, Mass,
USA, December 1994.
[7] P. Chen, W. L. Melvin, and M. C. Wicks, “Screening among
multivariate normal data,” Journal of Multivariate Analysis,
vol. 69, no. 1, pp. 10–29, 1999.
[8] K. R. Gerlach, “Outlier resistant adaptive matched filtering,”
IEEE Transactions on Aerospace and Electronic Systems, vol. 38,
no. 3, pp. 885–901, 2002.
[9] M. Rangaswamy, J. H. Michels, and B. Himed, “Statistical
analysis of the non-homogeneity detector for STAP applica-
tions,” DigitalSignalProcessing, vol. 14, no. 3, pp. 253–267,
2004.
[10] K. J. Sangston and K. R. Gerlach, “Coherent detection of radar
targets in a non-Gaussian background,” IEEE Transactions on
Aerospace and Electronic Systems, vol. 30, no. 2, pp. 330–340,
1994.
[11] S. Watts, Ed., “Special issue on radar clutter and multipath
propagation,” IEE Proceedings, Part F, vol. 138, no. 2, 1991.
[12] M. Rangaswamy, “Statistical analysis of the nonhomogeneity
detector for non-Gaussian interference backgrounds,” IEEE
Transactions on Signal Processing, vol. 53, no. 6, pp. 2101–2111,
2005.
[13] B. Efron and B. Tibshirani, An Introduction to the Bootstrap,
Chapman & Hall/CRC, Boca Barton, Fla, USA, 1993.
[14] K. D. Ward, C. J. Baker, and S. Watts, “Maritime surveillance
radar. I. Radar scattering from the ocean surface,” IEE
Proceedings F: Radar and Signal Processing, vol. 137, no. 2, pp.
51–62, 1990.
[15] E. J. Kelly, “An adaptive detection algorithm,” IEEE Transac-
tions on Aerospace and Electronic Systems,vol.22,no.2,pp.
115–127, 1986.
[16] M. C. Wicks, M. Rangaswamy, R. Adve, and T. B. Hale, “Space-
time adaptive processing: a knowledge-based perspective for
airborne radar,” IEEE Signal Processing Magazine, vol. 23, no.
1, pp. 51–65, 2006.
[17] F. Gini and M. Greco, “Covariance matrix estimation for
CFAR detection in correlated heavy tailed clutter,” Signal
Processing, vol. 82, no. 12, pp. 1847–1859, 2002.
[18] E. Conte, M. Lops, and G. Ricci, “Asymptotically optimum
radar detection in compound-Gaussian clutter,” IEEE Trans-
actions on Aerospace and Elect ronic Systems,vol.31,no.2,pp.
617–625, 1995.
[19] F. Gini, “Sub-optimum coherent radar detection in a mixture
of K-distributed and Gaussian clutter,” IEE Proceedings: Radar,
Sonar and Navigation, vol. 144, no. 1, pp. 39–47, 1997.
[20] S. Kraut, L. L. Scharf, and R. W. Butler, “The adaptive
coherence estimator: a uniformly most-powerful-invariant
adaptive detection statistic,” IEEE Transactions on Signal
Processing, vol. 53, no. 2, part 1, pp. 427–438, 2005.
[21] E. Conte, A. De Maio, and G. Ricci, “Covariance matrix esti-
mation for adaptive CFAR detection in compound-Gaussian
clutter,” IEEE Transactions on Aerospace and Electronic Systems,
vol. 38, no. 2, pp. 415–426, 2002.
[22] E. Conte, A. De Maio, and G. Ricci, “Recursive estimation of
the covariance matrix of a compound-Gaussian process and
its application to adaptive CFAR detection,” IEEE Transactions
on Signal Processing, vol. 50, no. 8, pp. 1908–1915, 2002.
[23] M. R. Chernick, Bootstrap Methods: A Practitioner’s Guide,
John Wiley & Sons, New York, NY, USA, 1999.
[24] A. R. Feinstein, Principles of Medical Statistics, Chapman &
Hall/CRC, Boca Barton, Fla, USA, 2002.
[25] A. M. Zoubir and B. Boashash, “The bootstrap and its appli-
cation in signal processing,” IEEE Signal Processing Magazine,
vol. 15, no. 1, pp. 56–76, 1998.
[26] A. M. Zoubir and D. R. Iskander, Bootstrap Techniques for
Signal Processing, Cambridge University Press, Cambridge,
UK, 2004.
[27] A. M. Zoubir and D. R. Iskandler, “Bootstrap methods in
signal processing,” IEEE Signal Processing Magazine, vol. 24,
no. 4, pp. 7–8, 2007.
[28] A. Farina, F. Gini, M. V. Greco, and L. Verrazzani, “High
resolution sea clutter data: statistical analysis of recorded live
data,” IEE Proceedings: Radar, Sonar and Navigation, vol. 144,
no. 3, pp. 121–130, 1997.
[29] P. Hall, “On the number of bootstrap simulations required to
constract a confident interval,” The Annals of Statistics, vol. 14,
no. 4, pp. 1453–1462, 1986.
[30] B. Himed and W. L. Melvin, “Analyzing space-time adaptive
processors using measured data,” in Proceedings of the 31st
Asilomar Conference on Signals, Systems and Computers, vol.
1, pp. 930–935, Pacific Grove, Calif, USA, November 1997.
[31] M. Greco, F. Gini, and M. Rangaswamy, “Statistical analysis
of measured polarimetric clutter data at different range
resolutions,” IEE Proceedings: Radar, Sonar and Navigation,
vol. 153, no. 6, pp. 473–481, 2006.
[32] E. Conte, A. De Maio, and C. Galdi, “Statistical analysis of
real clutter at different range resolutions,” IEEE Transactions
on Aerospace and Electronic Systems, vol. 40, no. 3, pp. 903–
918, 2004.
[33] />[34] E. J. Kelly, “Performance of an adaptive detection algorithm;
rejection of unwanted signals,” IEEE Transactions on Aerospace
and Electronic Systems, vol. 25, no. 2, pp. 122–133, 1989.
[35] I. S. Reed, J. D. Mallett, and L. E. Brennan, “Rapid convergence
rate in adaptive arrays,” IEEE Transactions on Aerospace and
Electronic Systems, vol. 10, no. 6, pp. 853–863, 1974.