Báo cáo hóa học: " Research Article Binocular Image Sequence Analysis: Integration of Stereo Disparity and Optic Flow for Improved Obstacle Detection and Tracking" pptx
Bạn đang xem bản rút gọn của tài liệu. Xem và tải ngay bản đầy đủ của tài liệu tại đây (2.22 MB, 10 trang )
Hindawi Publishing Corporation
EURASIP Journal on Advances in Signal Processing
Volume 2008, Article ID 843232, 10 pages
doi:10.1155/2008/843232
Research Article
Binocular Image Sequence Analysis: Integration of
Stereo Disparity and Optic Flow for Improved Obstacle
Detection and Tracking
Yingping Huang
1
and Ken Young
2
1
International Automotive Research Centre (IARC), Warwick Manufacturing Group, University of Warwick, Coventry CV4 7AL, UK
2
International Manufacturing Research Centre, Warwick Manufacturing Group, University of Warwick, Coventry CV4 7AL, UK
Correspondence should be addressed to Yingping Huang, huang
Received 28 August 2007; Revised 15 February 2008; Accepted 28 March 2008
Recommended by Ati Baskurt
Binocular vision systems have been widely used fordetecting obstacles in advanced driver assistant systems (ADASs). These systems
normally utilise disparity information extracted from left and right image pairs, but ignore the optic flows able to be extracted
from the two image sequences. In fact, integration of these two methods may generate some distinct benefits. This paper proposes
two algorithms for integrating stereovision and motion analysis for improving object detection and tracking. The basic idea is to
fully make use of information extracted from stereo image sequence pairs captured from a stereovision rig. The first algorithm
is to impose the optic flows as extra constraints for stereo matching. The second algorithm is to use a Kalman filter as a mixer
to combine the distance measurement and the motion displacement measurement for object tracking. The experimental results
demonstrate that the proposed methods are effective for improving the quality of stereo matching and three-dimensional object
tracking.
Copyright © 2008 Y. Huang and K. Young. This is an open access article distributed under the Creative Commons Attribution
License, which permits unrestricted use, distribution, and reproduction in any medium, provided the original work is properly
cited.
1. INTRODUCTION
Driving safety is a serious issue for our society. Statistical data
shows about 40 million road accidents happen every year in
Europe, and 1.5 million peoples are killed by these accidents.
Analysis of these accidents indicates that about 70 percent of
serious injury accidents are caused by lack of driver attention.
This fact necessitates developing advanced driver assistance
systems (ADAS) for modern vehicles. The target of ADAS is
to make the vehicle aware of its surroundings and allow it to
take proper action in response to dangerous situations.
Vision-based sensing systems have been widely adapted
for object detection in modern intelligent vehicles. Stereovi-
sion and motion analysis are two common computer vision
techniques for extracting objects from sets of images. In
stereovision, two images captured at the same time but from
different positions are used to compute depth information of
objects [1–4]. The motion analysis method segments objects
according to their optic flows (motion vectors) by analysing
two or more consecutive images taken with the same camera
[5–8]. These two methods have been researched separately,
but very little attention has been paid to integrating them.
In fact, integration of these two methods may generate some
distinct benefits. This paper proposes two fusion algorithms
for improving object detection and tracking. The basic idea
is to fully make use of two pairs of image sequences captured
from a stereovision rig, that is disparity from left and right
pair images and optic flows from consecutive images.
For a stereovision-based object detection system, a key
task is locating the image of a scene point in the left and right
image pair, that is correspondence matching. This process
generates a disparity map which has a crucial effect on the
detection performance. In our previous stereovision work
[1, 2], the correspondence matching is achieved in terms
of the greyscale similarity of two image blocks centred at
the points to be matched. The greyscale similarity of two
window blocks is assessed by the sum of absolute differences
(SAD) [2] or by the normalised cross correlation coefficient
[1] between them. However, the correspondence matching
obtained by this method is not enough to guarantee a true
2 EURASIP Journal on Advances in Signal Processing
correspondence matching and may generate a number of
false matching points because there are often many points
in an image that have the same or very similar intensities.
In this paper, we propose a method to improve the quality
of correspondence matching. In this method, optic flows
obtained from the left and right image sequences are used
as extra constraints for correspondence matching.
In addition, object tracking is important to achieve
more accurate object speeds in both longitudinal and lateral
directions. Use of a Kalman filter is an effective method
for object tracking and requires measurements to update
prediction results. It is known that stereovision is able to
measure object longitudinal distance while motion analysis is
capable of measuring the lateral displacements of an object.
This implies that a Kalman filter provides a natural way
to fuse stereovision and motion analysis by using them as
measurement tools. In this paper, we will also examine how
stereovision and motion analysis can be fused by a Kalman
filter for object tracking.
Stereomotion integration has been studied in a theoret-
ical manner for extracting the relationship between them.
Waxman and Duncan [9] claimed that “stereovision and
motion analyses can be combined in such a way that each can
help “to overcome the other’s shortcomings” and proposed a
5-step fusion strategy for extracting shape information. One
important result was a correlation between relative image
flow (i.e., binocular difference flow) and stereo disparity.
Their implementations were limited and based on scenes
consisting of white objects covered by black dots. Li et al.
[10, 11] presented a method for recovering 3D translational
motion and structure from binocular image flows. Transla-
tion motion parameters were first determined from a group
of linear equations generated from measured optical flows of
a number of image points. The estimated motion parameters
were then used to find the correspondence between binoc-
ular image pairs. Results were presented upon laboratory
scenes consisting of surfaces covered with either grids or
regular patterns of black dots. Zhang and Kambhamettu
[12] have proposed twoalgorithms for computing dense
three-dimensional scene flow and structure from multiview
image sequences. Stereo constraints under a multiview
camera setup were investigated and utilized in model-based
algorithms and extended gradient-based algorithms. Sudhir
et al. [13]andCliffordandNasrabadi[14] used Markov
random fields to combine the stereo and motion. In Sudhir’s
method, the discontinuities are used to predict and enforce
the preservation of stereo correspondences through the
motion estimates. They presented the computed optical
flow and stereo disparity on some tailored images. These
researches did not consider object grouping issues, and
therefore are difficult to apply in real scenarios. Tirumalai et
al. [15] presented an approach for incremental refinement of
disparity maps for a mobile robot. They utilized the motion
vectors calculated from a least median of squares (LMS)-
based algorithm for recursive disparity prediction and
refinement. More recently, Dang et al. [16] proposed using
a Kalman filter for fusing optical flow and stereo disparity
for object tracking. In their method, a complicated extended
Kalman filter is used for the iteration process. In our study,
we propose a decoupling filtering method by decomposing
the state vector into three groups. The decomposed Kalman
filter for each group of vectors has a linear relation, leading
to a greatly simplified computation. In addition, the Kalman
filter proposed by Dang et al. used a simplified motion
prediction equation by considering accelerations as noise.
This approach can reduce the computational complexity of
the extended Kalman filter, but will bring a bigger error to
the tracking results when the car is moving with acceleration.
In our work, we use a complete motion equation as the
prediction equation. The experimental results demonstrate
that our Kalman filter is able to effectively track the distance
and speed for all dynamic cases.
This paper consists of four sections. Section 2, following
this introduction, describes fusion algorithm I that is fusing
optic flows to stereo matching for improving the quality
of the disparity map. Section 3 presents fusion algorithm II
that introduces how stereovision and motion analysis can be
fused by a Kalman filter for object tracking. Section 4 gives
the conclusions.
2. INTEGRATING OPTIC FLOWS WITH
STEREO MATCHING
For a stereovision-based object detection system, two images
(left and right) sequences can be simultaneously acquired.
This enables acquisition of a pair of motion fields by
analyzing the left and right image sequences. Since true
motion fields are not accessible, optical flow representing the
displacement of corresponding points in consecutive images
is used as an approximation. Optic flows for the same target
calculated from the left and right image sequences should
be similar. This similarity of optic flows can be taken as
extra matching constraints. To fulfill this, we firstly need
to calculate the optic flows for the left and right image
sequences.
2.1. Optic flows of moving obstacles
Many approaches have been designed for obtaining optic
flowsformovingobjectsfromimagesequences[17]. Basi-
cally, these approaches can be split into two categories, that
is, spatiotemporal gradient-based techniques and correspon-
dence matching techniques. The spatiotemporal gradient-
based techniques calculate optic flows based on assumptions
such as globe smoothness or direction smoothness, and the-
oretical mathematical derivation. These assumptions cannot
be guaranteed to be true in practical situations. The cor-
respondence matching-based techniques detect optic flows
by searching for correspondence points between consecutive
images. These are, therefore, more suitable for dynamic road
scene images. In this research, we employ a correspondence
matching approach based on greyscale similarity to acquire
optic flows.
In our previous work [2], we have designed an edge
indexed stereo matching method. A summary for this
method is as follows.
(i) Only conduct correspondence matching for edge
points.
Y. Huan g a nd K . Youn g 3
50
100
150
200
50 100 150 200 250 300
50
100
150
200
50 100 150 200 250 300
(a) The stereo image pair at frame 60
50
100
150
200
50 100 150 200 250 300
50
100
150
200
50 100 150 200 250 300
(b) The stereo image pair at frame 61
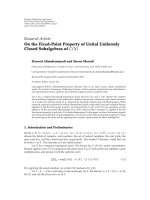
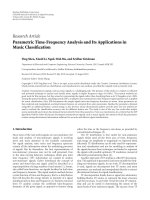
Figure 1: Consecutive stereo image sequence pairs.
(ii) Normalized cross correlation coefficients are used
as a measure of greyscale similarity of two window
blocks centred at the points to be assessed. The
correspondence points are considered as those with
the maximum cross correlation coefficients, which
must be greater than a predefined threshold.
(iii) A quadratic interpolation was introduced to achieve
a subpixel disparity estimation. This is to improve
the depth resolution so that a higher depth detection
accuracy can be achieved.
In this research, we also use the same method to calculate
optic flows for the left and right image sequences. Some
alterationshavebeenmadeasfollows.
(i) The correspondence searching is conducted in con-
secutive images rather than left and right image pairs.
(ii) No epipolar constraint can be applied, therefore the
range of correspondence searching is within a square
area centred at the seed point position.
(iii) For the right image sequence, the optic flows will be
calculated on all candidate points to be matched with
the seed points in the left image.
Figure 1 shows two stereo image pairs captured at consec-
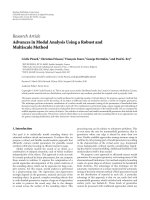
utive time frames. A Canny edge detector has been used to
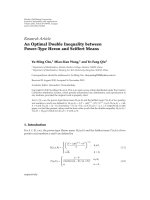
achieve edge information as detailed as possible. Figure 2
shows the Canny detection results of the stereo image pair
at frame 60. The edge points in these two edge images are
used as seed points to search the correspondence points in
the second stereo image pair. That is, the stereo image pair
at frame 60 is used as the reference images to determine
the optic flows. The threshold of the Canny filter has an
influence on the amount of points to be matched. In this
research, only edge points have been selected to conduct
the stereo matching in order to reduce the computational
burden. Actually, conducting matching on all points is ideal
for object segmentations because it gives a dense disparity
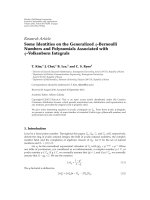
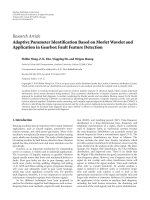
map. Calculated optic flows are shown in Figure 3 where
the optic flows for each edge point are decomposed into
displacements in horizontal (X) and vertical (Y) directions.
Figures 3(a) and 3(b) show the horizontal displacements for
the left and right images while Figures 3(c) and 3(d) show
vertical displacements. A colour scheme is used to visualise
the displacement vector fields. The colour bars indicate
the quantitative relationship between the displacement and
the colour. The maximum displacement, that is matching
4 EURASIP Journal on Advances in Signal Processing
50
100
150
200
50 100 150 200 250 300
Left image edge
(a)
50
100
150
200
50 100 150
200
250 300
Right image edge
(b)
Figure 2: Edge image of the stereo image pair in Figure 1(a).
50
100
150
200
50 100 150 200 250 300
7
5
3
1
−1
−3
−5
−7
Left velocity X map
(a) Horizontal motion displacement of left images
50
100
150
200
50 100 150 200 250 300
7
5
3
1
−1
−3
−5
−7
Right velocity X map
(b) Horizontal motion displacement of right images
50
100
150
200
50 100 150 200 250 300
7
5
3
1
−1
−3
−5
−7
Left velocity Y map
(c) Vertical motion displacement of right images
50
100
150
200
50 100 150 200 250 300
7
5
3
1
−1
−3
−5
−7
Right velocity Y map
(d) Vertical motion displacement of right images
Figure 3: Optic flows for left and right images using edge-indexed crosscorrelation matching.
search range, was set to 8 in both directions. For a zero
displacement, the colour is set to black. Actually, the
calculated displacements have subpixel accuracy. Comparing
Figure 3(a) to 3(b) and 3(c) to 3(d), we can find the motion
displacements of the left and right image sequences have
very similar distributions even if some noisy matching has
occurred, which implies that the optic flows can be used as
extra constraints for stereo matching.
Y. Huan g a nd K . Youn g 5
2.2. Using optic flows as extra constraints for
stereo matching
Our previous work only used the normalized cross correla-
tion coefficient as a measure to assess the correlation of the
point pair. The point pair with the maximum correlation
coefficient is considered as the correspondence points. In
fact, this is not always true because of an intensity difference
between the two images caused by lighting angle, iris or
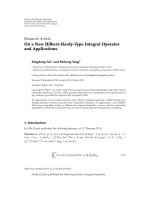
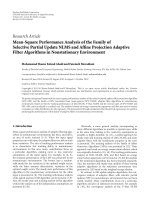
exposure gain of the cameras. The disparity map generated
by this method for the image pair at frame 60 is shown in
Figure 4(a). It can be seen that some colour discontinuity
occurs in the same object indicating mismatching points.
By introducing optic flows as extra constraints, we are
defining multiple measures for stereo matching. As well
as the normalized cross correlation coefficient, two other
measures are defined as the differences of the horizontal and
vertical displacements of two points to be assessed. Actually,
texture measure is also very important to assess the matching
quality in some nontextured regions of the image [1]. In this
study, we only conduct stereo matching for edge points where
the image patches are normally textured. Furthermore, as we
only want to assess the effect of optic flows on the stereo
matching, we do not consider the texture measure.
Applying the epipolar line constraint, we can search the
correspondence point in the same row. For a seed point at
position (i
l
, j) in the left edge image and a candidate point
at position (i
r
, j) in the right image, the differences of the
motion displacements in horizontal and vertical directions,
MVD
x
(i
l
, j)andMVD
y
(i
l
, j) , are defined as
MVD
x
i
l
, j
=
MV
x
i
l
, j
−
MV
x
i
r
, j
,
MVD
y
i
l
, j
=
MV
y
i
l
, j
−
MV
y
i
r
, j
,
(1)
where MV
x
and MV
y
are the horizontal and vertical motion
displacements obtained in Section 2.1.
Accordingly, we define a three-dimensional measure
vector M(i
l
, j) as follows:
M
i
l
, j
=
MVD
x
i
l
, j
MVD
y
i
l
, j
1 −coef
i
l
, j
T
,
(2)
where coef(i, j) is the normalized cross correlation coefficient
for the seed point at position (i
l
, j) in the left image.
To achieve the best matching, MVD
x
(i, j)andMVD
y
(i, j)
should be minimised while coef(i, j) should be maximised.
The matching error E(i
l
, i
r
, j) between pixel (i
l
, j) in the
left image and pixel (i
r
, j) in the right image is defined as a
weighted sum of the individual measures
E
i
l
, i
r
, j
=
k
w
k
M
i
l
, j
k
,(3)
where k represents the measure vector index. The selection of
the weighting is objective and empirical. The weighting for
the third measure (1
− coef(i, j)) should have a greater value
than the motion displacement differences. For an edge point
(x
l
, y) in the left image, the correspondence point in the
50
100
150
200
50 100 150 200 250 300
20
18
16
14
12
10
8
6
4
2
Disparity map
(a) No fusion
50
100
150
200
50 100 150 200 250 300
20
18
16
14
12
10
8
6
4
2
Disparity map
(b) With fusion
Figure 4: Disparity maps with fusion and no fusion with optic
flows.
right image is the one (xm
r
, ym) generating the minimum
matching error, and x
l
− xm
r
gives out the disparity. The
disparity map generated by this method for the image
pair at frame 60 is shown in Figure 4(b).Thecomparison
between Figures 4(a) and 4(b) indicates that the disparity
map obtained from the fusion method is much cleaner with
many false matching points eliminated.
3. FUSION USING A KALMAN FILTER FOR
3D OBJECT TRACKING
3.1. Modelling
For a point P(XYZ) in the world coordinate,
the state vector to be tracked is defined by SV
=
[XX
X
YY
Y
ZZ
Z
]
2
,whereX
, Y
, Z
are
the first-order derivative of X, Y, Z thatis3Dspeedsof
the point, X
, Y
, Z
are the second-order derivative of
X, Y, Z, that is 3D accelerations of the point. Assuming the
point to be tracked follows a purely translational movement,
the prediction equation of the Kalman filter can be defined
6 EURASIP Journal on Advances in Signal Processing
as the object motion equation
SV
k+1
= A·SV
k
+ ξ
k
,(4)
where k is the sampling index, ξ
k
process noise,
A
=
⎡
⎢
⎢
⎢
⎢
⎢
⎢
⎢
⎢
⎢
⎢
⎢
⎢
⎢
⎢
⎢
⎢
⎢
⎢
⎢
⎣
1 T 0.5T
2
00 0 00 0
01 T 00 0 00 0
00 1 00 0 00 0
00 0 1T 0.5T
2
00 0
00 0 01 T 00 0
00 0 00 1 00 0
00 0 00 0 1T 0.5T
2
00 0 00 0 01 T
0
00000001
⎤
⎥
⎥
⎥
⎥
⎥
⎥
⎥
⎥
⎥
⎥
⎥
⎥
⎥
⎥
⎥
⎥
⎥
⎥
⎥
⎦
,(5)
and T the sampling interval. The Kalman filter also needs a
measurement vector and measurement equations to update
the prediction.
For an ideal pinhole camera model, the projection point
p(xy) of the point P(XYZ) in the image plane can be
expressed as
x
y
=
⎡
⎢
⎢
⎣
m·
X
Z
m
·
Y
Z
⎤
⎥
⎥
⎦
,(6)
where m is the camera constant regarding the focal length
and the pixel size. This equation indicates the relationship
between real 3D world coordinates and 2D image coordi-
nates. It can be seen from (6) that three variables x, y,
and Z are crucial for updating prediction equation (4).
Therefore, we can define the measurement vector as MV
=
[xyZ]
T
. It is known that the distance Z can be measured
from the stereovision technique. Horizontal and vertical
coordinates (x, y) can be measured because horizontal and
vertical displacements Δx and Δy between the imagescan be
measured by the motion analysis, and the initial position
(x
c
, y
c
) of the tracking point are known from (17). Thus, the
Kalman filter provides a natural way to fuse stereovision with
motion analysis for three-dimensional object tracking.
The measurement equation can be written as
MV
k
= C·SV
k
+ η
k
,(7)
where η
k
is the measurement noise,
C
=
⎡
⎢
⎢
⎢
⎢
⎣
m
Z
00 0 00000
000
m
Z
00000
000000100
⎤
⎥
⎥
⎥
⎥
⎦
. (8)
Equation (4) forms a complete object motion equation. The
process estimation noise only comes from X
, Y
, Z
, that
is 3D accelerations. Therefore, the process noise ξ
k
in (4)can
be modelled as ξ
k
= [
00a
x
00a
y
00a
z
]
T
. a
x
, a
y
,
and a
z
are considered as Gaussian white noise with a mean
value of zero. Their variances are ∂
2
ax
, ∂
2
ay
,and∂
2
az
.The
processing noise covariance Q
k
is
Q
k
= E
ξ
k
·ξ
T
k
=
⎡
⎢
⎢
⎢
⎢
⎢
⎢
⎢
⎢
⎢
⎢
⎢
⎢
⎢
⎢
⎢
⎢
⎢
⎢
⎣
000000000
000000000
00∂
2
ax
000000
000000000
000000000
00000∂
2
ay
00 0
000000000
000000000
00000000∂
2
az
⎤
⎥
⎥
⎥
⎥
⎥
⎥
⎥
⎥
⎥
⎥
⎥
⎥
⎥
⎥
⎥
⎥
⎥
⎥
⎦
. (9)
The measurement noise η
k
consists of ηx
k
, ηy
k
,andηZ
k
.
Their variance ∂
2
x
, ∂
2
y
, ∂
2
Z
can be calculated from measure-
ment data. Measurement noise covariance R
k
are
R
k
= E
η
k
·η
T
k
=
⎡
⎢
⎢
⎣
∂
2
x
00
0 ∂
2
y
0
00∂
2
Z
⎤
⎥
⎥
⎦
.
(10)
The state vector SV contains three groups of state variables
(XX
X
), (YY
Y
), and (ZZ
Z
) , which are not
directly related to each other. Thus, we decouple the state
vector SV into three groups; each group with two state
variables. Correspondingly, (4)and(7) are also split into
three groups. Each group forms a linear Kalman filter with
the computation reduced from 6
3
to 3
∗
2
3
.Forexample,for
the third group, the longitudinal distance and speed, the state
vector is SV
= [ZZ
Z
]
T
, and the measurement vector is
MV
= [Z]. The prediction and measurement equations keep
the same format as (4)and(7) with some changes in matrix
A and C, that is
A
3
=
⎡
⎢
⎢
⎣
1 T 0.5T
2
01 T
00 1
⎤
⎥
⎥
⎦
,
C
3
=
100
.
(11)
Kalman filtering is an iteration process, and can be described
with five equations consisting of two time update and three
measurement update equations. The time update equations
for the filter are
SV
−
k+1
= A·SV
k
,
P
−
k+1
= A·P
k
·A
T
+ Q
k
,
(12)
where P
k
is the variance of the estimation error. The three
measurement update equations are
K
k+1
=
P
−
k+1
·C
T
C·P
−
k+1
·C
T
+ R
k
,
(13)
SV
k+1
= SV
−
k+1
+ K
k+1
MV
k+1
− C·SV
−
k+1
,
(14)
P
k+1
=
1 − K
k+1
·C
P
−
k+1
, (15)
Y. Huan g a nd K . Youn g 7
15
14.5
14
13.5
13
12.5
12
0 102030405060708090100
Distance Z (m)
Distance tracking results
Frames
(a) The longitudinal distance
15
10
5
0
−5
−10
0 102030405060708090100
Longitudinal speed Z’(m/s)
Longitudinal speed tracking results
Frames
(b) The longitudinal speed
7
6
5
4
3
2
1
0
−1
−2
−3
0 102030405060708090100
Lateral speed X’(m/s)
Lateral speed tracking results
Frames
(c) The lateral speed
8
6
4
2
0
−2
−4
0 102030405060708090100
Vertical speed Y’(m/s)
Vertical speed tracking results
Frames
(d) The vertical speed
Figure 5: Experiment 1: tracking results by using a Kalman filter as a mixer (red: the true state of the system, green: the measurement results,
blue: the estimation of the Kalman filter).
where K is the Kalman gain, R
k
= ∂
2
Z
,and
Q
k
=
⎡
⎢
⎢
⎣
00 0
00 0
00∂
2
az
⎤
⎥
⎥
⎦
. (16)
SV
k+1
gives the tracking results for the longitudinal distance
and speed.
The other two groups of state variables, the lateral and
vertical movements, have the same iteration equations with
a small change in matrix C, that is, C
1
= C
2
= [
m/Z 00
],
which requires knowing the longitudinal distance Z. There-
fore, in practice, we first calculate the third group of the
variables and then use the obtained results for the other two
groups of variables.
3.2. Experiments
Object longitudinal distance (Z) is detected by the stereovi-
sion method explained in [1, 2]. In this method, an object to
be detected is segmented as a point cluster in the depth map.
The point cluster is then remapped back into the original
image, which generates an object image region R
obj
.The
centroid point of an object detected is selected as the tracking
point. The centroid point (x
c
, y
c
)isdefinedas
x
c
=
i∈R
obj
j∈R
obj
i·G(i, j)
i∈R
obj
j∈R
obj
G(i, j)
,
y
c
=
i∈R
obj
j∈R
obj
j·G(i, j)
i∈R
obj
j∈R
obj
G(i, j)
,
(17)
8 EURASIP Journal on Advances in Signal Processing
35
30
25
20
15
10
5
0 102030405060708090100
Distance Z (m)
Distance tracking results
Frames
(a) The longitudinal distance
12
10
8
6
4
2
0
−2
−4
0 102030405060708090100
Longitudinal speed Z’(m/s)
Longitudinal speed tracking results
Frames
(b) The longitudinal speed
16.5
16
15.5
15
14.5
14
13.5
0 102030405060708090100
Measured horizontal coordinate x (pixel)
Measured horizontal coordinate x
Frames
(c) Measured horizontal coordinate x
5
4.5
4
3.5
3
2.5
2
1.5
1
0.5
0 10 20 30 40 50 60 70 80 90 100
Lateral distance X(m)
Lateral distance tracking results
Frames
(d) The lateral distance X
15
10
5
0
−5
−10
−15
0 102030405060708090100
Lateral speed X
(m/s)
Lateral speed tracking results
Frames
(e) The lateral speed X
Figure 6: Experiment 2: tracking results by using Kalman filter as a mixer (red: the true state of the system, green: the measurement results,
blue: the estimation of the Kalman filter).
where
G(i, j)
=
⎧
⎨
⎩
1ifi ∈ R
obj
∩ j ∈ R
obj
,
0 other.
(18)
Actually, we only need to locate the centroid point the first
time the object has been detected. Consequently, this point
will have been used to calculate the optic flows of the object.
Two experiments have been conducted to verify the
algorithms. Each experiment captures a pair of image
Y. Huan g a nd K . Youn g 9
sequences containing 100 frames as shown in Figure 1.
When using (12)–(15) to calculate the optimal estimation,
two parameters, the measurement noise covarianceand the
processing noise covariance must be prespecified. In this
work, the measurement covariance noise was evaluated
from the measurement data ∂
2
x
= ∂
2
y
= 0.04 and ∂
2
Z
=
0.05. The process noise was modelled as a Gaussian
white noise with a mean value of zero and a standard
deviation of 0.03, therefore, processing noise covariance
∂
2
ax
= ∂
2
ay
= ∂
2
az
≈ 0.001. Initial values of the state
vector SV and the variance of the estimation error P
k
required by the iteration process were randomly set. Our
experiments demonstrate that the tracking results are not
very sensitive to the settings of the process noise or the initial
values.
Experiment 1 gives the simplest scenario where the car
under detection is moving 12.8 m ahead of the equipped
car at a relative speed of zero in both longitudinal and
lateral directions. Thus, the longitudinal and lateral distances
between the two cars are kept constant. The tracking results
of the longitudinal distance and relative speed are shown in
Figures 5(a) and 5(b). The lateral and vertical relative speeds
are shown in Figures 5(c) and 5(d). In the figures, the red line
is the true state of the system, the green curve measurement
results, and the blue curve the estimation of the Kalman filter.
It can be seen that after about 10 frames, the estimation
converges on the true values. Furthermore, we find that the
tracking results are more stable and closer to the true values
than the measurement results.
Experiment 2 covers a more generic case where the
car under detection is moving away from the equipped
car with a constant acceleration of 0.4 m/s
2
and an initial
speed of 0.556 m/s in the longitudinal direction. In the
lateral direction, the car under detection is moving from
the equipped car at a speed of 0.4 m/s. Figures 6(a) and
6(b) shows the tracking results of the longitudinal distance
and speed. The longitudinal distance between the two cars
varies from 6.8 m to 32.1 m in a form of a parabolic curve.
The longitudinal speed increases linearly from 0.556 m/s to
4.556 m/s. Figure 6(c) shows the measured horizontal coor-
dinate x. Correspondingly, the lateral distance X between the
two cars and the tracking results are shown in Figure 6(d).
It can be seen that the horizontal coordinate varies around
a mean value of 15 pixel while the lateral distance varies
in a form of an approximate parabolic curve, affected by
the measured longitudinal distance. Lateral speed tracking
results are displayed in Figure 6(e). As in the previous
experiment, all estimation values converge on the true
values after about 10 frames. Furthermore, we also find
that the tracking results are more stable and closer to the
true values than the measurement results, which indicates
the designed Kalman filter is able to generate an optimal
estimation. The results of experiment 2 demonstrate that
the designed Kalman filter is able to dynamically track
the distance and speed in both longitudinal and lateral
directions while the car under detection is accelerating
away.
4. CONCLUSIONS
In this paper, we proposed two algorithms for fusing stereo-
vision and motion analysis. The first algorithm is to fuse the
optic flows into stereo matching, where the optic flows are
used as extra constraints for stereo matching. The matching
error is defined as the weighted sum of multiple measures
including the normalized cross correlation coefficient, and
differences of horizontal and vertical motion displacements.
The experimental results demonstrated that the disparity
map obtained from the fusion method is much cleaner
than the normal method with many false matching points
eliminated. The second fusion algorithm is to use a Kalman
filter as a mixer to combine the measurements generated
from stereovision and motion analysis for 3-dimensional
object tracking. A decoupling strategy has been designed
to achieve a simplified linear Kalman filter, which greatly
reduces the computation complexity and burden. The exper-
imental results have demonstrated that the tracking results
converge on the true values. Furthermore, the tracking
results are more stable and closer to the true values than
the raw measurement results, indicating that the proposed
Kalman filter is able to generate optimal estimations for 3D
object motion parameters.
REFERENCES
[1] Y. Huang, S. Fu, and C. Thompson, “Stereovision-based object
segmentation for automotive applications,” EURASIP Journal
on Applied Signal Processing, vol. 2005, no. 14, pp. 2322–2329,
2005.
[2] Y. Huang, “Obstacle detection in urban traffic using stereovi-
sion,” in Proceedings of the 8th IEEE International Conference
on Intelligent Transportation Systems (ITSC ’05), pp. 357–362,
Vienna, Austria, September 2005.
[3] U. Franke and A. Joos, “Real-time stereo vision for urban
traffic scene understanding,” in Proceedings of IEEE Intelligent
Vehicles Symposium (IV ’00), pp. 273–278, Dearborn, Mich,
USA, October 2000.
[4] Y. Kimura, T. Kato, and M. Ohta, “Stereo vision for obstacle
detection,” in Proceedings of the 13th World Congress &
Exhibition on Intelligent Transportation Systems and Services,
London, UK, October 2006.
[5] T. Suzuki and T. Kanada, “Measurement of vehicle motion
and orientation using optical flow,” in Proceedings of the
IEEE/IEEJ/JSAI International Conference on Intelligent Trans-
portation Systems (ITSC ’99), pp. 25–30, Tokyo, Japan, October
1999.
[6] Z. Hu and K. Uchimura, “Tracking cycle: a new concept
for simultaneous tracking of multiple moving objects in a
typical traffic scene,” in Proceedings of IEEE Intelligent Vehicles
Symposium (IV ’00), pp. 233–239, Dearborn, Mich, USA,
October 2000.
[7] N. Ancona, “A fast obstacle detection method based on
optical flow,” in Proceedings of the 2nd European Conference on
Computer Vision (ECCV ’92), pp. 267–271, Santa Margherita
Ligure, Italy, May 1992.
[8] D. Willersinn and W. Enkelmann, “Robust obstacle detection
and tracking by motion analysis,” in Proceedings of IEEE
International Conference on Intelligent Transportation Systems
(ITSC ’97), pp. 717–721, Boston, Mass, USA, November 1997.
10 EURASIP Journal on Advances in Signal Processing
[9] A. M. Waxman and J. H. Duncan, “Binocular image flows:
steps towards stereo-motion fusion,” IEEE Transactions on
Pattern Analysis and Machine Intelligence, vol. 8, no. 6, pp. 715–
729, 1986.
[10] L. Li and J. H. Duncan, “3-D translational motion and
structure from binocular image flows,” IEEE Transactions on
Pattern Analysis and Machine Intelligence, vol. 15, no. 7, pp.
657–667, 1993.
[11] W. Wang and J. H. Duncan, “Recovering the three-
dimensional motion and structure of multiple moving objects
from binocular image flows,” Computer Vision and Image
Understanding, vol. 63, no. 3, pp. 430–446, 1996.
[12] Y. Zhang and C. Kambhamettu, “On 3-D scene flow and
structure recovery from multiview image sequences,” IEEE
Transactions on Systems, Man, and Cybernet ics B, vol. 33, no.
4, pp. 592–600, 2003.
[13] G. Sudhir, S. Banarjee, K. Biswas, and R. Bahl, “Cooperative
integration of stereopsis and optical flow computation,”
Journal of the Optical Society of America A, vol. 12, no. 12, pp.
2564–2572, 1995.
[14] S. P. Clifford and N. M. Nasrabadi, “Integration of stereo
vision and optical flow using Markov randomfields,” in Pro-
ceedings of IEEE International Conference on Neural Networks,
vol. 1, pp. 577–584, San Diego, Calif, USA, July 1988.
[15] A. P. Tirumalai, B. G. Schunck, and R. C. Jain, “Dynamic stereo
with self-calibration,” IEEE Transactions on Pattern Analysis
and Machine Intelligence, vol. 14, no. 12, pp. 1184–1189, 1992.
[16] T. Dang, C. Hoffmann, and C. Stiller, “Fusing optical flow
and stereo disparity for object tracking,” in Proceedings of the
5th IEEE International Conference on Intelligent Transportation
Systems (ITSC ’02), pp. 112–117, Singapore, September 2002.
[17] B. McCane, K. Novins, D. Crannitch, and B. Galvin, “On
benchmarking optical flow,” Computer Vision and Image
Understanding, vol. 84, no. 1, pp. 126–143, 2001.