Báo cáo hóa học: " Research Article Smart Antenna UKM Testbed for Digital Beamforming System" potx
Bạn đang xem bản rút gọn của tài liệu. Xem và tải ngay bản đầy đủ của tài liệu tại đây (2.82 MB, 8 trang )
Hindawi Publishing Corporation
EURASIP Journal on Advances in Signal Processing
Volume 2009, Article ID 128516, 8 pages
doi:10.1155/2009/128516
Research Article
Smart Antenna UKM Testbed for Digital B eamforming System
Mohammad Tariqul Islam,
1
Norbahiah Misran,
1, 2
and Baharudin Yatim
1
1
Institute of Space Science (ANGKASA), National University of Malaysia, 43600 UKM Bangi, Selangor Darul Ehsan, Malaysia
2
Department of Electrical, Electronics & System Engineer ing, National University of Malaysia, 43600 UKM Bangi,
Selangor Darul Ehsan, Malaysia
Correspondence should be addressed to Mohammad Tariqul Islam,
Received 4 May 2008; Revised 11 November 2008; Accepted 6 January 2009
Recommended by Jiri Jan
A new design of smart antenna testbed developed at UKM for digital beamforming purpose is proposed. The smart antenna
UKM testbed developed based on modular design employing two novel designs of L-probe fed inverted hybrid E-H (LIEH)
array antenna and software reconfigurable digital beamforming system (DBS). The antenna is developed based on using the
novel LIEH microstrip patch element design arranged into 4
× 1 uniform linear array antenna. An interface board is designed
to interface to the ADC board with the RF front-end receiver. The modular concept of the system provides the capability to test the
antenna hardware, beamforming unit, and beamforming algorithm in an independent manner, thus allowing the smart antenna
system to be developed and tested in parallel, hence reduces the design time. The DBS was developed using a high-performance
TMS320C6711
TM
floating-point DSP board and a 4-channel RF front-end receiver developed in-house. An interface board is
designed to interface to the ADC board with the RF front-end receiver. A four-element receiving array testbed at 1.88–2.22 GHz
frequency is constructed, and digital beamforming on this testbed is successfully demonstrated.
Copyright © 2009 Mohammad Tariqul Islam et al. This is an open access article distributed under the Creative Commons
Attribution License, which permits unrestricted use, distribution, and reproduction in any medium, provided the original work is
properly cited.
1. Introduction
Smart antenna with digital beamforming (DBF) is regarded
as one of the key components to meet the ever increasing
appetite for higher data rates. Smart antenna technology
dramatically improves the interference-suppression capa-
bility and greatly increases frequency reuse, resulting in
increased capacity. Smart antenna with its beamforming
capability optimizes the signal-to-noise performance or
power consumption at both ends of the links. Advancement
in powerful low-cost digital signal processor (DSP), general-
purpose processors, field programmable gate array (FPGA),
application-specific integrated circuits (ASICs), as well
as innovative software-based signal processing techniques
(algorithms) or software-defined radio (SDR), has allowed
the development of smart antenna system to progress
rapidly and make the smart antennas practical for cellular
communications systems [1].
The beamforming is a key technology in smart antenna
system which is a process in which each user signal is
multiplied with a complex weight vectors that adjust the
magnitude and phase of the signal from each antenna
element [2–5]. Hence, the array forms a transmit beam
in the desired direction and minimizes the output in the
interferer directions. A beamformer appropriately combines
the signals received by different elements of an antenna
array to form a single output. The DBF system provides
several advantages over analog beamforming techniques.
First, analog array system uses expensive microwave phase
shifters and attenuators for each element. Second, the signal
processing capability, such as adaptive beamforming, is
limited. However, there are still challenges in the practical
implementation of high-performance DBF array system [6].
Classically, this is achieved by minimizing the mean square
error (MSE) between the desired output and the actual
array output. This principle has its roots in the tradi-
tional beamforming employed in sonar and radar systems
[7–13].
Investigating the performance of highly sophisticated
wireless systems, in particular the smart antenna systems, is
adifficult task. In most cases, this can only be performed
via simulation, which means modeling complex behavior
2 EURASIP Journal on Advances in Signal Processing
by simpler mathematical descriptions. Software simulation,
for example, MATLAB software with its highly accurate
double-precision numerical environment is on the one
hand a perfect tool for the investigation of algorithms.
On the other hand, many imperfections of the re al-
world are neglected [14]. A testbed is generally used for
research which is a vehicle for further development, for
verification of algorithms, or ideas under real-world or
real-time conditions. This results in the requirement for
scalability, modularity, and extendibility [14]. The advantage
of testbed is to reduce the investment risk of the new
product in case the new technology would hide unforeseen
challenges.
Recently, there has been a great effort to build the
smart antenna system testbed (SATB) to meet the ever
demanding channel capacity for the future generation
broadband mobile communication systems [15–17]. There
are testbeds reported in the literature focusing on various
wireless technologies. The TSUNAMI project [18]inEurope
was aimed at promoting research and development in
adaptive antennas. The testbed reported by Virginia Tech
lab [19]isa2
× 2 broadband MIMO. Iospan Wireless
Inc. and Stanford University also reported in [14] a smart
antenna testbed one in downlink and another in uplink.
These SATBs are designed based on narrowband antennas
employing conventional dipole, slots, TEM horns, reflectors
antenna, and so forth that made the antennas bulky and
heavy. Aesthetic appearances of these structures are adversely
affected by big bulky antennas. Microstrip technology meets
the requirement of a compact and low-profile system due to
its light weight, low production cost, ease of fabrication, and
conformability with RF circuitry [20, 21]. However conven-
tional microstrip antenna or array suffers from very narrow
bandwidth. This set the design challenges of developing a
broadband microstrip antenna that can cover the radio band
(1.88–2.22 GHz).
The objective of this work is to reduce the antenna size
and complexity of the system without compromising the
digital beamforming capability. Furthermore, microstrip slot
antennas are selected for the design of the array due to
their compactness. The remainder of the paper is organized
as follows. Section 2 describes the system architecture and
hardware implementation. Section 3 discusses the UKM
testbed measurement results, and finally Section 4 concluded
the paper.
2. System Architecture and Hardware
Implementation
The novel SATB developed at UKM (UKM testbed) is
developed based on modular concept employing two novel
designs of four-element microstrip patch antenna array and
DSP-based DBS, which allows the exploitation of digital
beamforming. The testbed is designed as a receiver unit. A
block diagram of UKM testbed receiver system architecture
is shown in Figure 1. The testbed receiver system composed
of antenna system, radio unit, and digital signal processing
baseband section.
Custom
designed
interface
board
RF
section
RF
section
ADC
THS1206
ADC
THS1206
5–6 K
interface
board
C6711
DSP board
Figure 1: Block diagram of UKM testbed receiver.
Table 1: The LIEH-shaped MPA design specification.
RF parameter
Val ue s
Superstrate
RT 5880 (ε
r1
= 2.2, h
1
= 1.5748 mm)
Substrate
Air (ε
0
= 1, h
0
= 16 mm)
Rectangular patch
Width and Length,
{W, L}={79, 41}mm
Feed position
fp
= 8.5mmfrombottomedgeof
the patch
Slots parameters (E)
{ls,s,ws}={37, 16, 1}mm
Slots parameters (H)
{lh,wh,sh}={18, 19, 2}mm
Probe length
h
p
= 14 mm along y axis l
p
= 25 mm
along x axis
The radiating element, the LIEH-shaped microstrip
patch antenna (MPA), is arranged in a 4
× 1 linear array
configuration and with interelement spacing of 68 mm (or
0.50 λ) at 2.2 GHz. The total dimension of the array is
120 mm (width) by 285 mm (length) with the size of the
ground plane equals to 370 mm
× 200 mm × 1 mm. The
design parameters for the LIEH-shaped MPA are shown
in Table 1. The LIEH array antenna is constructed using
two dielectric layer arrangements, where a thick air-filled
substrate was sandwiched between top-loaded dielectric
substrate or superstrate with inverting radiating patch and
an aluminum ground plane [22]. The array antenna is
designed based on LIEH-shaped microstrip patch which
used contemporary design techniques, namely, the L-
probe feeding, inverted patch, and slotted patch techniques
to meet the design requirement. The geometry of the
4
× 1 uniform linear LIEH array antenna is shown in
Figure 2.
A commercial electromagnetic simulator Sonnet Suite em
simulator was used to simulate the design. The fabricated
antennas were measured using the Agilent PNA E8358A
network analyzer, Agilent ESG-DP series E4436B signal
generator, Advantest R3131A spectrum analyzer, and the
standard gain LPDA-0803 log periodic dipole antenna.
Measurement was conducted in the open field. The array
achieves an impedance bandwidth of 17.32% (at VSWR
≤
1.5), maximum achievable gain of 11.9 ± 1dBi and 20dB
crosspolarization level [22].
EURASIP Journal on Advances in Signal Processing 3
Centreline
Inter element spacing
Inverted hybrid E-H
shaped patch
y, H
x, E
(a)
h
1
h
0
SMA
Superstrate (ε
r1
)
Air (ε
0
)
L-probe
Silicon
Ground
Radiating patch
(b)
Figure 2: (a) Top view and (b) side view of the 4 × 1 LIEH patch elements.
The radiation characteristics of the LIEH patch antenna
measured in free space range are shown in Figure 3.It
shows the E-plane and H-plane radiation patterns of the
hybrid patch at resonance frequency of 1.92 GHz and
2.15 GHz. The experimental results agree well with the
simulation results (not shown in this paper). In the E-
plane, the 3 dB beam width is 60
◦
at 1.92 GHz and 50
◦
at
2.15 GHz. The peak crosspolarization is
−25 dB at 1.91 GHz
and
−30 dB at 2.15 GHz. The radiation pattern is virtually
symmetry in the H-plane but asymmetries in the E-plane.
The asymmetry characteristic of the copolarization pattern
is clearly shown in Figure 3. The LIEH patch antenna shows
that the cross-polarization level increases with resonant
frequency and thickness [23]. The H-plane radiation pattern
shows a slightly broader 3dB beamwidth about 75
◦
.The
peak cross-polarizations are
−11.87 dB and −9.82 dB at the
respected resonant frequencies. The improvement in the
crosspolarization characteristics of the patch is due to the
embedded parallel slot which reduces the current flow in H-
plane direction as observed earlier. Noted in this figure, the
crosspolarization in the H-plane is considerably higher than
the E-plane. Similar observations have been reported in the
literature [24]. This cross-polarization is generated by the
leaky radiation of the slots [24] and also due to the substrate
thickness [25].
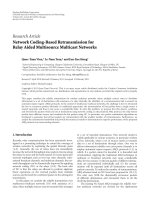
Figure 4 shows the measured coupling between the
elements S
12
, S
13
,andS
14
of the 4 × 1 LIEH array antenna,
with element 1 taken as the reference element. It can be
seen that the coupling between the reference element and
other elements decays over elements spacing. As shown in
the figure, the magnitude of S
12
, S
13
,andS
14
remains flat over
the pass band, and the maximum mutual coupling is between
element 1 and element 2 (S
12
) with the maximum value of
−12.2 dB in the operating bandwidth. The minimum mutual
coupling is
−41.83 dB between element 1 and element 4
(S
14
). Ta ble 2 shows the simulated and measured values of
the interelement coupling between all elements of the array.
One of the fastest floating-point platforms available,
the Texas Instruments (TI) TMS320C67 DSP capable of
900 MFLOPS, was selected as the computational platform
for the DBS. The radio frequency (RF) receiver front-ends
accommodate a multichannel two-stage down conversion
0
−5
−10
−15
−20
−25
−30
−35
Gain, G (dB)
−180 −120 −60 0 60 120 180
Angles (deg)
1.92 GHz, copolarization
2.15 GHz, copolarization
1.92 GHz, crosspolarization
2.15 GHz, crosspolarization
Figure 3: Measured E- and H-plane normalized radiation patterns
at two resonant frequencies of 1.92 GHz and 2.15 GHz.
Table 2: Interelement coupling for each element of 4
×1LIEH.
S
12
(2 GHz) S
13
(2 GHz) S
14
(2 GHz)
Simulated 15dB 23dB 34dB
Measured 12 dB 21 dB 30 dB
between the RF section and the baseband section. Center
frequency of 2040 MHz is used in the custom designed front-
ends due to the propagation similarities compared to the
worldwide 3G radio band (1.88 GHz–2.22 GHz) and the
availability of standard components at this frequency. The
DBS front-end is composed of four parallel RF channels
which filtered, amplified, and downconverted the incoming
signal from the antenna into eight complex baseband signals
(I&Q) using the I&Q demodulators. These signals are fed
to the analog-to-digital conversion (ADC) board for data
conversion.
Figure 5 shows the simplified block diagram of RF
front-end of the UKM testbed. The RF section of the
testbed composes of four parallel RF channels which
are filtered and amplified by Trilithic RF BPFs centered
4 EURASIP Journal on Advances in Signal Processing
0
−10
−20
−30
−40
−50
Magnitude (dB)
1.86 1.93 2 2.06 2.13 2.22.27 2.33 2.4
Frequency, f (GHz)
S
12
S
13
S
14
Figure 4: Measured coupling between element 1 and other
elements of the 4
×1 LIEH-shaped array.
at 2040 MHz and MiniCircuits ZHL-1724HLN low-noise
amplifiers, respectively. The incoming signal is downcon-
verted by MiniCircuits ZEM-4300 MHz double-balanced
mixers and Trilithic IF BPFs centered at 68 MHz. The eight
complex baseband signals are generated using the ZFMIQ-
70D demodulator. The LNA and IF amplifiers run on 15 volts
DC, and the power consumption per channel is measured at
15.8 watts, which provided a combined power consumption
of 63.2 watts for the four-element RF front-end. The LO
signal for the mixers (13 dBm drive level) is driven from a
single source to keep the phase relationship constant between
the branches. An Agilent E4436B ESG series signal generator
is utilized to generate the 1972 MHz LO signal. The 1 to 4
Mini-Circuits ZN4PD1-50 power splitter is used to deliver
the signal to the mixer. The Agilent 6653A DC power supply
is used to drive the amplifier.
The ADC is performed with the multichannel TI
THS1206M EVM, which is mated to the Texas Instruments
C67 DSP board through TI 5-6 K Interface board. Since an
8-channel ADC board was not available on a single board,
two 4-channel TI THS1206M EVM boards were placed on
top of another. The ADC board has been modified for
stacking the two ADC boards to get eight baseband channels.
Custom-designed boards were developed to interface with
ADC board. Figure 6 shows the developed RF front-end
for UKM testbed. The DBS consists of a four-layer rake.
The dimension of each layer is 24 inches
× 14 inches and
mountedonanaluminummetalplateabovethePerspexfor
grounding and mechanical support. The bottom three layers
are used to accommodate all the components and the top
layer for the screening purpose only. The power connections
are run beside the board from the DC power supply.
The demodulated antenna signals are received from
SMA connector of MiniCircuits low-pass filter (LPF), but
the analog input of the ADC board is the combination
of header/socket. To feed the LPF signal into the analog
input of ADC, the header/socket connector is required to
be modified for complying with SMA connector of the
LPF filter. The analog input of the THS1206M EVM is a
20-pin male header (2 rows
× 10 pos). There is a 20-pin
socket on the bottom side and a 20-pin male header on
the top side of the THS1206M EVM. These are passing-
through connectors (shorted top to bottom). The only
output available from analog signal sources is from SMA
male connectors. Therefore, a female SMA connector is
required to adapt to breakout the signal for THS1206M
EVM board. A shielded ribbon cable is utilized with mating
header that fits on the 20-pin male header. These two male
header connectors remain the same when THS1206M EVM
is stacked on the 5-6 K Interface board. A 20-pin female
socket which is connected by ribbon cable is used to plug into
the connector of the 5-6 K interface board. The other end of
theribboncableissolderedtomateSMAconnector.
In order to get the proper voltage level between 1.5 V
to 3.5 V for THS1206 M EVM, the voltage signal is shifted
to 2.50 V (REFM + REFP/2). Figure 7 shows the circuit
diagram of voltage level shifter circuit. The analog input
signal is shifted to the analog input range of THS1206 (1.5 V
to 3.5 V) by using this circuit board. The op-amp is config-
ured with a resistor divider as an inverting amplifier with a
unity gain. Two units of 4-input TL084CN are employed in
order to get the 8 input signals. The output of the voltage
divider circuit is tapped into the noninverting input of the
TL084CN op-amp. A high-resolution THS 1206 ADC and
Nyquist sampling technique are employed to solve signal dig-
itization error. Figure 8 shows the developed UKM testbed
system.
The developed UKM testbed is composed of 4
× 1
LIEH array antenna, four RF branches, eight-channel ADC,
TMS320C6711 DSP board, and Pentium host PC. The UKM
testbed receiver system implemented the DBF which is based
on the constant modulus algorithm (CMA) [8]. The DSP
with its beamforming algorithms generates the required
weight vector based on the angle of arrival of the intended
user. The CMA algorithm is simpler to implement and does
not require any synchronization and reference signal. The
beamforming algorithm is implemented on C67 floating
point DSP for the low-cost noncoherent testbed system.
It does not waste the bandwidth for the training signal.
A host PC is used to collect data in real-time and offline
processing. The data received from LIEH array antenna and
the processed RF front-end signal is recorded online utilizing
host PC. The data collected by the host PC is passed to
the MATLAB environment for postprocessing and display
in offline. Ta ble 3 summarizes the specification of the UKM
testbed receiver.
3. Measurement Results and Discussions
A testbed is set up in the microwave lab to evaluate system
performance. The DBF measurement result is presented
in this section. A single-tone test is performed for the
evaluation of the UKM testbed performance. An Agilent
54622 D-mixed signal digital oscilloscope is used after the
LPF to observe the baseband signal waveform. Figure 9 shows
the experimental setup for the evaluation of beamforming
algorithm.
EURASIP Journal on Advances in Signal Processing 5
TMS320C6711 DSP
interface board
Ch1
Ch2
Ch3
Ch4
Ch1
Ch2
Ch3
Ch4
THS1206ADC
THS1206ADC
Custom-designed board
SLP1.9
SLP1.9
LPF
LPF
LPF
LPF
ZHL-
1724HLN
ZFL-
1000GH
ZFL-
1000H
ZEM-
4300MH
ZHL-
1724HLN
ZFL-
1000GH
ZFL-
1000H
ZEM-
4300MH
Splitter
ZN4PD1-50
Splitter
ZMSC-4-1
I/Q demod
ZFMIQ -70D
I/Q demod
ZFMIQ -70D
I
1
I
4
Q
1
Q
4
5–6 K
.
.
.
.
.
.
.
.
.
×
×
68 MHz
1972 MHz
1972 MHz
10 MHz
ref
BPF
68 MHz
BPF
68 MHz
BPF
2040 MHz
BPF
2040 MHz
2040 MHz
2040 MHz
Figure 5: Simplified system block diagram of DBS system for the UKM testbed.
Analog input
connector
Voltage level
shifter circuit
board
2ADCboard
Splitter
TMS
6711DSP
board
5–6 K
interface
board
RF component
Figure 6: The developed RF front-end for UKM testbed.
Output 1
Output 2
Output 3
Output 4
Input 1
U2
TL084
R6
+ V1
5V
R3
R5
+ V2
5V
Input 2
Input 3
Input 4
R2
R1
U1
TL071
R10
R9
R8
R7
U3
TL084
R11
R12
U4
TL084
R13
R14
R15
R16
R17
R18
U5
TL084
10 k
10 k
10 k
10 k
10 k
10 k
10 k
10 k
10 k
10 k
10 k
10 k
10 k
10 k
10 k
10 k
10 k
−
+
−
+
+
−
+
−
+
−
Figure 7: Voltage level shifter circuit board.
6 EURASIP Journal on Advances in Signal Processing
PC
DSP based
beamformer
4
×1LIEH
array antenna
Figure 8: Constructed UKM testbed receiver system.
Table 3: Specification of UKM testbed receiver.
RF parameter Values
Antenna 4 × 1 uniform linear array
Antenna element
LIEH-shaped MPA
DSP
TMS320C6711 (Texas
Instruments)
Operating frequency
2035–2070 MHz
Maximum signal
bandwidth
750 KHz
ADC resolution 12 bit
IF frequency 68 MHz
Sampling period
1.1 1 μs (900 KHz)/channel
Transmitting antenna
power (without amplifier)
10 dBm
Receiver output 130 mV
Modulation CW (unmodulated signal)
Receiver input impedance 50 Ω
A continuous wave of 2040.010 MHz RF signal is trans-
mitted by transmitting the antenna. The signal is received
by the 4
× 1 LIEH array at the front end of UKM testbed
receiver. The multichannel signal splitter is used to give input
to the mixer from LO. The RF tone is downconverted into
a 10 kHz baseband signal with an LO set at 1972 MHz. The
I and Q signals for different channels are recorded using
Agilent 54622 D digital oscilloscope from the LPF before they
are sent down to the ADC board.
Ta bl e 4 summarizes the amplitudes of I and Q signals
for all four channels. In the measurement the phase of I
signal of channel 1 is considered as zero and the well-aligned
phase front demonstrates a good broad side reception.
The baseband signal is recorded as 10.10 kHz. There is no
disruption observed in the signal.
The signal received by the ADC after conversion using
code composer studio (CCS) [26] is presented in Figure 10.
In this figure, the first signal is I signal and the second signal
is Q signal before DBF. These signals share the same shape
since both signals are from the same types of demodulator
Table 4: Measured I and Q signals amplitudes for 4 channels.
I (mV) Q (mV)
Channel 1 125 127
Channel 2 127 122
Channel 3 125 119
Channel 4 106 127
source. As can be seen from these figures, the amplitude of
both types of signal is constant, and the phase difference
between I and Q signal is 90
◦
. A small disruption is observed
in the signal due to the signal generators and interchannel
interference, which is caused by the RF component and RF
cable used for the measurement. There is no noticeable phase
difference observed between both channels. The original data
samples are shown along with the envelope.
The following results are carried out to demonstrate the
UKM testbed as a beamforming system. The resulted weight
vectors are used in MATLAB to plot the antenna response
pattern. The data is taken for a different angle of 0
◦
,30
◦
,
and
−30
◦
to plot the beampattern. The I and Q baseband
signals are digitized through ADCs and processed by DSP.
The architecture is designed to retain all the amplitude
and phase information for each antenna element through
downconversion and signal recovery, so that, DBF algorithms
can be applied. Once each channel data has been recovered,
the DBF algorithm is calculating the weight vectors to
form the antenna pattern. The DBF allows the antenna
radiation pattern to be scanned over a wide range of angles
without using the associated expensive RF attenuator and
phase shifter hardware. Complex weighting coefficients are
multiplied with each channel data to synthesize the pattern
at the desired position.
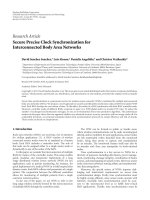
Figure 11 demonstrates the baseband DBF radiation
pattern at 0
◦
,30
◦
,and−30
◦
.The3dBbeamwidthisobserved
close to 25
◦
. The side lobe levels are distributed unequally
due to asymmetry of the modification introduce in the patch.
Thefirstsidelobelevelis
−20 dB at −50
◦
and at 0
◦
scanning
angle.Thepeaksidelobelevelis
−10 dB at −40
◦
for the
scanning angle of 30
◦
. For the scanning angle of −30
◦
, the
peak side lobe level is
−15 dB at 10
◦
correspondingly. The
antenna is used for a scan range as far as
±30
◦
. Beyond this
range, the array degrades the antenna pattern due to the
mutual coupling.
4. Conclusion
This design and development of UKM testbed, capable of
performing digital beamforming that employed LIEH array
antenna operating at 1.88 GHz–2.22 GHz and DSP based
DBS, have been presented in this paper. The UKM testbed
has been designed in a modular manner, which simplifies
the design, reduces the development time, eases hardware
update, and facilitates testing the various modules (e.g.,
antenna hardware, beamforming unit, and beamforming
algorithms) in an independent manner. Custom-designed
boards were developed to allow interface for the connector
EURASIP Journal on Advances in Signal Processing 7
Antenna array
Transmitting
antenna
RF
generator
Antenna 1
Custom hardware
interface
PC data
acquition
RF section
Multichannel ADC
TI DSP
TMS320C6711
Antenna 4
I
1
Q
1
I
4
Q
4
Figure 9: UKM testbed receiver experimental setup.
0.0703
0.0562
0.0422
0.0281
0.0141
0
−0.0141
−0.0281
−0.0422
−0.0563
−0.0703
0 237 474 711 948 1185 1422 1659 1896
Signal
disruption
(a)
0.0737
0.059
0.0442
0.0295
0.0147
0
−0.0147
−0.0295
−0.0442
−0.059
−0.0737
0 237 474 711 948 1185 1422 1659 1896
(b)
Figure 10: Channel 1 demodulated I and Q signals using CCS.
0
−5
−10
−15
−20
−25
−30
−35
−40
−45
Gain (dB)
−90 −60 −300 306090
Angle (deg)
0degree
30 degree
−30 degree
Figure 11: Baseband digital beamforming radiation pattern at the
angles
−30
◦
,0
◦
,and30
◦
.
and voltage level shifting for THS1206 EVM ADC board
to work properly. This paper also presented the antenna
beampattern of different scanning angles. The capability
of digital beamforming has been demonstrated successfully
on the UKM testbed. A DSP-based DBS system provided
reconfigurability, rapid prototyping, and low-cost imple-
mentation. The novel low-cost SATB with its modular
design and software reconfigurable approach provided a full
3G band with small footprint and less weight. The low-
cost implementation of the testbed system has proven to
be a small budget educational tool to enable researcher
to understand practical implementation issues regarding
smart antenna system and demonstrate the efficacy of the
approach.
Acknowledgments
The authors would like to thank the IRPA Secretariat, Min-
istry of Science, Technology and Environmental of Malaysia,
IRPA Grant 04-02-02-0029, Institute of Space Science UKM,
UKM Grant LL-001-2004, and Zamalah scheme of UKM for
sponsoring this work.
References
[1] S. Ponnekanti, “An overview of smart antenna technology for
heterogeneous networks,” IEEE Communication Surveys, vol.
2, no. 4, pp. 14–23, 1999.
[2] B. G. Agee, “Blind separation and capture of communication
signals using a multitarget constant modulus beamformer,”
in Proceedings of IEEE Military Communications Conference
(MILCOM ’89), vol. 2, pp. 340–346, Boston, Mass, USA,
October 1989.
[3] H. Krim and M. Viberg, “Two decades of array signal
processing research: the parametric approach,” IEEE Signal
Processing Magazine, vol. 13, no. 4, pp. 67–94, 1996.
8 EURASIP Journal on Advances in Signal Processing
[4]J.C.LibertiandT.S.Rappapoert,Smart Antenna for
Wireless Communications Is-95 and Third Generation CDMA
Applications, Prentice-Hall PTR, Englewood Cliffs, NJ, USA,
2002.
[5] S. Chen, N. N. Ahmad, and L. Hanzo, “Adaptive minimum
bit-error rate beamforming,” IEEE Transactions on Wireless
Communications, vol. 4, no. 2, pp. 341–348, 2005.
[6] M. C. Wells, “Increasing the capacity of GSM cellular radio
using adaptive antennas,” IEE Proceedings: Communications,
vol. 143, no. 5, pp. 304–310, 1996.
[7] J. D. Fredrick, Y. Wang, and T. Itoh, “A smart antenna receiver
array using a single RF channel and digital beamforming,”
IEEE Transactions on Microwave Theory and Techniques, vol.
50, no. 12, pp. 3052–3058, 2002.
[8]J.LitvaandT.K.Y.Lo,Digital Beamforming in Wireless
Communications, Artech House, London, UK, 1996.
[9] L. C. Godara, “Applications of antenna arrays to mobile
communications—part I: performance improvement, feasi-
bility, and system considerations,” Proceedings of the IEEE, vol.
85, no. 7, pp. 1031–1060, 1997.
[10] I. S. Reed, J. D. Mallett, and L. E. Brennan, “Rapid convergence
rate in adaptive arrays,” IEEE Transactions on Aerospace and
Electronic Systems, vol. 10, no. 6, pp. 853–863, 1974.
[11] M. W. Ganz, R. L. Moses, and S. L. Wilson, “Convergence of
the SMI and the diagonally loaded SMI algorithms with weak
interference [adaptive array],” IEEE Transactions on Antennas
and Propagation, vol. 38, no. 3, pp. 394–399, 1990.
[12] B. Widrow, P. E. Mantey, L. J. Griffiths,andB.B.Goode,
“Adaptive antenna systems,” Proceedings of the IEEE, vol. 55,
no. 12, pp. 2143–2159, 1967.
[13] L. J. Griffiths, “A simple adaptive algorithm for real-time
processing in antenna arrays,” Proceedings of the IEEE, vol. 57,
no. 10, pp. 1696–1704, 1969.
[14] S. Caban, C. Mehlf
¨
uhrer, R. Langwieser, A. L. Scholtz, and M.
Rupp, “Vienna MIMO testbed,” EURASIP Journal on Applied
Signal Processing, vol. 2006, Article ID 54868, 13 pages, 2006.
[15] F. Adachi, M. Sawahashi, and H. Suda, “Wideband DS-CDMA
for next-generation mobile communications systems,” IEEE
Communications Magazine, vol. 36, no. 9, pp. 56–69, 1998.
[16] S. Choi and D. Yun, “Design of an adaptive antenna array for
tracking the source of maximum power and its application
to CDMA mobile communications,” IEEE Transactions on
Antennas and Propagation, vol. 45, no. 9, pp. 1393–1404, 1997.
[17] S. Ohmori, Y. Yamao, and N. Nakajima, “The future gener-
ations of mobile communications based on broadband access
technologies,” IEEE Communications Magazine, vol. 38, no. 12,
pp. 134–142, 2000.
[18] C. M. Simmonds and M. A. Beach, “Downlink stability
evaluations of the TSUNAMI (II) adaptive antenna testbed,” in
Proceedings of the 3rd ACTS Mobile Communications Summit,
pp. 417–423, Rhodes, Greece, June 1998.
[19] R. Gozali, R. Mostafa, R. C. Palat, et al., “Virginia tech
space-time advanced radio (VT-STAR),” in Proceedings of the
Radio and Wireless Conferrence (RAWCON ’01), pp. 227–231,
Waltham, Mass, USA, August 2001.
[20] K L. Lau, K M. Luk, and K F. Lee, “Design of a circularly-
polarized vertical patch antenna,” IEEE Transactions on Anten-
nas and Propagation, vol. 54, no. 4, pp. 1332–1335, 2006.
[21] Y. P. Zhang and J. J. Wang, “Theory and analysis of
differentially-driven microstrip antennas,” IEEE Transactions
on Antennas and Propagation, vol. 54, no. 4, pp. 1092–1099,
2006.
[22] M. T. Islam, N. Misran, and N. K. Jiunn, “A 4
×1L-probefed
inverted hybrid E-H microstrip patch antenna array for 3G
application,” American Journal of Applied Sciences, vol. 4, no.
11, pp. 897–901, 2007.
[23] S. C. Gao, L. W. Li, M. S. Leong, and T. S. Yeo, “A novel dual-
polarized, wide-band microstrip patch antenna with aperture
coupling,” in Proceedings of IEEE Antennas and Propagation
Society International Symposium, vol. 4, pp. 78–81, Boston,
Mass, USA, July 2001.
[24] T. Huynh and K F. Lee, “Single-layer single-patch wideband
microstrip antenna,” Electronics Letters, vol. 31, no. 16, pp.
1310–1312, 1995.
[25] T. Huynh, K. F. Lee, and R. Q. Lee, “Crosspolarisation
characteristics of rectangular patch antennas,” Electronic s
Letters, vol. 24, no. 8, pp. 463–464, 1988.
[26] Texas Instruments, “Code Composer Studio IDE,” November
2008, />.html.