Báo cáo hóa học: " Research Article Multilayer Statistical Intrusion Detection in Wireless Networks" pptx
Bạn đang xem bản rút gọn của tài liệu. Xem và tải ngay bản đầy đủ của tài liệu tại đây (808.42 KB, 13 trang )
Hindawi Publishing Corporation
EURASIP Journal on Advances in Signal Processing
Volume 2009, Article ID 368589, 13 pages
doi:10.1155/2009/368589
Research Article
Multilayer Statistical Intrusion Detection in Wireless Networks
Mohamed Hamdi, Amel Meddeb-Makhlouf, and Noureddine Boudr iga
Communication Networks and Security Research Laboratory, School of Communication Engineering,
University of 7th of November at Carthage, 2083 Ariana, Tunisia
Correspondence should be addressed to Mohamed Hamdi,
Received 6 September 2007; Revised 15 May 2008; Accepted 16 September 2008
Recommended by Polly Huang
The rapid proliferation of mobile applications and services has introduced new vulnerabilities that do not exist in fixed wired
networks. Traditional security mechanisms, such as access control and encryption, turn out to be inefficient in modern wireless
networks. Given the shortcomings of the protection mechanisms, an important research focuses in intrusion detection systems
(IDSs). This paper proposes a multilayer statistical intrusion detection framework for wireless networks. The architecture is
adequate to wireless networks because the underlying detection models rely on radio parameters and trafficmodels.Accurate
correlation between radio and traffic anomalies allows enhancing the efficiency of the IDS. A radio signal fingerprinting
technique based on the maximal overlap discrete wavelet transform (MODWT) is developed. Moreover, a geometric clustering
algorithm is presented. Depending on the characteristics of the fingerprinting technique, the clustering algorithm permits to
control the false positive and false negative rates. Finally, simulation experiments have been carried out to validate the proposed
IDS.
Copyright © 2009 Mohamed Hamdi et al. This is an open access article distributed under the Creative Commons Attribution
License, which permits unrestricted use, distribution, and reproduction in any medium, provided the original work is properly
cited.
1. Introduction
Mobile applications and services relying on wireless commu-
nication infrastructures have dramatically expanded during
last years. Ad hoc networks, wireless local area networks
(WLANs), and WIMAX are just examples of a panoply of
technologies that are continuing to proliferate. In addition,
more sophisticated communication techniques are expected
to appear in the near future. The intrinsic features of wireless
mobile networks make them more vulnerable than wired
fixed networks. For instance, the nature of wireless radio
links renders the network vulnerable not only to passive
eavesdropping but also to active interfering. Moreover,
in many contexts, the network consists of autonomous
mobile nodes that are capable of acting independently.
Hence, without an appropriate physical protection, nodes
can be compromised and used to carry out malicious
activities.
The shortcomings of the security mechanisms used in
wireless networks exacerbate the need for new detection
techniques which should defend against sophisticated mobile
attacks. In the literature, many attempts have been done
to fulfill this need. Most of the existing approaches rely on
intrinsic signal characteristics to detect intrusion events.
In this paper, a novel multilayer intrusion detection
process for wireless networks is introduced. We consider a set
of detectors using heterogeneous features corresponding to
different network layers and collected by specific preproces-
sors. Four major layers are used in our context: the physical
layer, the link layer, the transport layer, and the application
layer. A set of parameters from each layer is collected,
preprocessed, and submitted to the corresponding detector
in order to state about the occurrence of malicious events.
A postprocessing module has also been designed in order
to refine the available information about the attacker by
accurately determining its position. The main contributions
of our work can be briefly described through the following
points.
(1) The physical layer preprocessor, aiming at gathering
intrinsic features of the wireless network interfaces, relies on
the maximal overlap discrete wavelet transform (MODWT)
and geometric unsupervised classification. It is shown to
ensure better performances than that in [1] essentially
because of its shift-preserving property. To our knowledge,
2 EURASIP Journal on Advances in Signal Processing
the MODWT has not been previously used in the intrusion
detection context.
(2) The transport and application layer detection mech-
anisms measure the deviation of the real-time trafficfrom
a preestablished model which is adaptively updated. This
allows detecting traffic pattern distortion attacks. In fact, we
introduce two novel traffic models corresponding to the TCP
protocol (transport layer) and video transmission (appli-
cation layer). We represent the traffic by a long memory
process. If the attacker attempts to embed forged packets
within a normal stream, our approach allows detecting his
activity.
(3) Our intrusion detection process is multilayer, mean-
ing that it can analyze a single-packet stream at different
layers, beginning by the physical layer. Furthermore, all of
the preprocessing, detection, and postprocessing techniques
are statistical. The fact that the proposed architecture is
purely statistical corroborates the idea stated in [2]and
stating that “statistical anomaly detection will be among
the most efficient intrusion detection techniques for wireless
networks.”
The rest of the paper is structured as follows. Section 2
reviews the most important intrusion detection techniques
for wireless networks. Section 3 briefly presents wavelet
theory fundamentals and highlights the difference between
the traditional DWT and the MODWT. The architecture
of the proposed IDS is described in Section 4. Section 5
designs the physical layer preprocessing components and
shows how network interfaces can be robustly authenticated
in a wireless environment. An antispoofing filter based on
geometric unsupervised classification of the data provided
by the physical and link layer preprocessors is detailed in
Section 6. The transport and application layer preprocessors
are addressed in Section 7. A technique based on the
estimation of the Hurst exponent is used for this pur-
pose. Section 8 describes the simulation environment and
discusses the results provided by the proposed techniques.
Finally, Section 9 concludes the paper.
2. Intrusion Detection in Wireless Networks
This section examines the state of intrusion detection in
wireless networks, with a particular emphasis on statistical
approaches. The wireless intrusion detection system is a
network component aiming at protecting the network by
detecting wireless attacks, which target wireless networks
having specific features and characteristics. Wireless intru-
sions can belong to two categories of attacks. The first
category targets the fixed part of the wireless network, such
as MAC spoofing, IP spoofing, and DoS; and the second
category of these attacks targets the radio part of the wireless
network, such as the access point (AP) rogue, noise flooding,
and wireless network sniffing. The latter attacks are more
complex because they are hard to detect and to trace back
[3, 4].
To detect such complex attacks, the WIDS deploys
approaches and techniques provided by intrusion detection
systems (IDSs) protecting wired networks [5]. Among these
approaches, one can find the signature-based and anomaly-
based approaches. The first approach consists in matching
user’s patterns with attack’s signatures. The second approach
aims at detecting any deviation of the “normal” behavior of
the network entities. The deployment of the aforementioned
approaches in wireless environment requires some modifi-
cations. Features and characteristics of wireless environment
make the use of traditional approaches of detection very
difficult. The major feature is mobility, where information
have to be gathered from different mobile sources, which may
require a real-time traffic analysis. Moreover, there are no
clear differences between “normal” and “abnormal” behavior
in mobile environment. Because of the mobility feature, a
node can send false information, which can be established
as an “abnormal” behavior.
Therefore, traditional approaches of detection have to be
revised. The signature-based approach in wireless networks
may require the use of a knowledge base containing the
wireless attack signatures while an anomaly-based approach
requires the definition of profiles specific to wireless entities
(mobile users and AP). The wireless intrusion detection
can be done by monitoring the active components of
the wireless network, such as the APs [6]. Generally, the
WIDS is designed to monitor and report on network
activities between communicating devices. To do this, the
WIDS has to capture and decode wireless network traffic
[7, 8]. While some WIDSs can only capture and store
wireless traffic. For example, WITS [9] retain multiple log
files that contain system statistics and sufficient network-
related data in order to trace back the intruder. Other
WIDSs are able to analyze signal fingerprints, which can
be useful in detecting and tracking rogue AP attack [10].
Moreover, due to their distributed nature, wireless networks,
especially ad hoc networks, are vulnerable to attacks. In
this case, wireless intrusion detection provides audit and
monitoring capabilities by deploying clustering algorithms to
collaboratively detect wireless intrusions [5, 11].
3. Wavelet Theory Fundamentals
Let X = [X
0
, , X
N−1
] be a vector of observations from a
stochastic process, the discrete wavelet transform (DWT) is
an orthonormal transform that maps X into a vector W
=
[W
0
, , W
N−1
]ataresolutionJ,where{W
0
, , W
N−1
}
denotes a set of reals, called the DWT coefficients, and N= 2
J
.
More accurately, the DWT can be expressed as follows:
W
= W X
T
,(1)
where T denotes the transposition operator, W is an N
× N
matrix defining the DWT and satisfying WW
T
= I
N
,andI
N
is the identity matrix of dimension N.
Obviously, orthonormality implies that X
= W
T
W
and
X
2
=W
2
. Moreover, the elements of W can be
decomposed into J + 1 subvectors such that
(i) the first J subvectors are denoted by (W
j
)
j=1, ,J
,and
the jth subvector contains all of the DWT coefficients
for scale τ
j
= 2
j
. This means that W
j
is a column
vector with N/τ
j
elements;
EURASIP Journal on Advances in Signal Processing 3
(ii) the final subvector is denoted as V
j
and contains only
the scaling coefficient W
N−1
.
Consequently, we obtain the multiresolution representation
of W given by:
W
=
⎡
⎢
⎢
⎢
⎢
⎢
⎢
⎣
W
1
W
2
.
.
.
W
J
V
J
⎤
⎥
⎥
⎥
⎥
⎥
⎥
⎦
. (2)
According to this reasoning, (1) can be rewritten as follows:
X
= W
T
W
=
J
j=1
W
T
j
W
j
+ V
T
J
V
J
,
(3)
where W
j
and V
J
are matrices defined by partitioning the
rows of W according to the partition of W into W
1
, , W
J
,
and V
J
.Thus,W
j
is a (N/τ
j
) × N matrix and V
J
is a row
vector of N elements.
Several variants of the DWT have been developed for
various contexts. In this paper, we use the maximal overlap
discrete wavelet transform that has been first proposed in
[12]. In contrast to the traditional DWT, the application
of the MODWT to a vector X at a given level J yields
the column vectors
W
1
,
W
2
, ,
W
J
, each of dimension N.
The vector
W
j
,foraspecificj in {1, , J}, contains the
MODWT wavelet coefficients associated with changes in
X on a scale τ
j
= 2
j−1
.ThevectorV
J
contains the DWT
coefficients the MODWT scaling coefficients associated with
variations at scale τ
J
= 2
J
. More concretely, for a given level
j, the components of the N dimensional vectors
W
j
and
V
j
are expressed as follows:
W
j,t
=
L
j
−1
l=0
h
j,l
X
t−l(mod N)
,
V
j,t
=
L
j
−1
l=0
g
j,l
X
t−l(mod N)
(4)
for t
= 0, , N − 1, where h is the wavelet filter, g is the
scaling filter, L denotes the width of h and g,
h
j,l
= h
j,l
/2
j/2
,
g
j,l
= g
j,l
/2
j/2
,andL
j
= (2
j
−1)(L − 1) + 1.
The most important properties of the MODWT are given
in the following.
(i) While the partial DWT of level J restricts the
vector size (representing the observations) to 2
J
, the
MODWT of level J is well defined for any sample size
N. When N is a multiple of 2
J
, the DWT can be com-
puted by a number of multiplications that is of O(N)
complexity using the pyramidal algorithm, whereas
the corresponding MODWT requires a number of
multiplications which is of O(N log
2
N) complexity.
(ii) As for the DWT, the MODWT can be used to
build a multiresolution analysis. On the opposite
to the traditional DWT, the details and smooths of
this multiresolution analysis are such that circularly
shifting the input vector by any amount will shift each
detail and smooth by a corresponding amount.
(iii) In contrast with the DWT, the MODWT details and
smooths are associated with zero-phase filters, thus
making it easy to line up features in a multiresolution
with original observation vector meaningfully.
(iv) The MODWT can be used to carry out an analysis of
variance based on the wavelet and scaling coefficients.
(v) Whereas a circular shift on the observation vector
results in modifying the DWT-based power spectra,
the corresponding MODWT-based spectra remain
unchanged. In fact, we can obtain the MODWT of a
circularly shifted time series by just applying a similar
shift to each of the components (
W
j
)
j∈{1, ,J}
and
V
J
of the MODWT of the original observation vector
The last property is crucial in the context of variance changes.
In fact, the signal is often shifted due to the lack of time
synchronization between the nodes of the wireless network.
The MODWT, therefore, seems to be more convenient than
the traditional DWT in this case because it preserves the time
shift.
4. A Multilayer Detection Process for
Wireless Networks
In this section, we discuss the architecture of the proposed
multilayer statistical intrusion detection approach. We con-
sider three major modules: (a) the preprocessor; (b) the
detector; and (c) the postprocessor. Each module can be
decomposed at a finer granularity into a set of submodules.
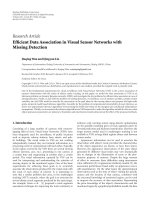
Figure 1 shows the basic architecture.
In the following, we discuss the functions implemented
by the three modules mentioned above.
(1) The physical and link layer preprocessors: the main
objective at this level is to extract several features from the
radio signals in order to determine whether the originating
transceiver effectively has the MAC address included in
the link-layer header of the corresponding data frames.
This allows detecting and identifying the attackers using
device impersonation or MAC address spoofing techniques
in order to hide their identities or gain unauthorized
privileges. To implement this module, we develop a Radio
Frequency Fingerprinting (RFF) technique (see Section 5).
RFF has been successfully applied in many fields including
wireless device localization, forensics, and radio frequency
identification (RFID). Roughly speaking, an RFF technique
should perform two fundamental tasks: transient detection
and feature extraction. One novelty of our preprocessor is
4 EURASIP Journal on Advances in Signal Processing
Geometric unsupervised
classification
Preprocessing
Transient detection Feature extraction
Mac address extraction
Tr an sie nt de te ct io n
Input
traffic
Alerts
Alerts
Detection
Change-point detection
Post-processing
Refined position
estimation
Figure 1: Architecture of the proposed multilayered intrusion detection process.
that it relies on the MODWT to detect the beginning of
the transient. We carried out simulations to highlight the
enhancement introduced by this wavelet-based technique.
The most important advantage of using MODWT is its shift-
invariance property. In fact, given that clock synchronization
can hardly be achieved in wireless networks, especially those
using ad hoc infrastructures, the signal emanating from
an emitting node will necessarily be time shifted when
reaching its destination. This can severely affect the transient
detection functionality, which is an important phase of the
fingerprinting process. The results of these simulations are
discussed in Section 8.
(2) Geometric unsupervised classification: typically, an
unsupervised classification approach takes as input a set
of unlabeled data and attempts to find specific events
buried within the data. In the antispoofing problem, we are
given a set of data, where it is unknown which originate
from authenticated transceivers and which originate from
impersonated devices. The goal is to identify the anomalous
elements. The main advantage of such approaches is that
they do not require the injection of a purely normal training
set. The algorithm can indeed perform over unlabeled data.
This is convenient with the anomaly detection context
because the antispoofing filter operating in a mobile wireless
environment should cope with a varying set of MAC
addresses (as nodes may join or leave the network). The key
characteristic of our framework (proposed in Section 6)is
a mapping the data provided by the physical and link layer
preprocessors to a feature space, which is basically a vector
space. Inside this vector space, the elements that are in low-
density regions of the probability distribution are labeled as
anomalous.
(3) Traffic model-based detection: techniques for detect-
ing previously unseen network intrusion attempts often
depend on finding anomalous behavior in network traffic
streams. It follows that there is a need to produce traffic
models that accurately reflect the characteristics of the
applications of interest. It has been noticed in [13, 14]
that a large number of superimposed heavy-tailed ON/OFF
processes can yield self-similar trafficwithdegreeofself-
similarity assessed by the Hurst parameter [15]. In Section 7,
we propose two models for the TCP protocol and for
video transmission. These models allow detecting abnormal
behavior (e.g., traffic pattern distortion).
In the following sections, we develop the detection mech-
anisms associated to the three aforementioned modules.
Section 5 shows how physical layer preprocessing is carried
out. The clustering algorithm allowing to discard spoofed
packets is introduced in Section 6. Section 7 proposes a
technique allowing to detect traffic injection attacks based on
self-similarity of TCP and video trafficbehavior.
5. Physical Layer Preprocessor Design
One problem associated with the application of the DWT for
transientdetectionisthatitsuffers from a lack of translation
invariance. This means that a time series will not necessarily
shift its DWT coefficients in a similar manner.
Let X
= [X
0
, , X
N−1
] be a time series representing the
amplitude of the signal generated by a wireless transceiver.
X can be regarded as a sequence of R random vari-
ables X
0
, , X
R−1
with zero means and different variances
σ
2
0
, , σ
2
R
−1
. Supposing that the beginning of the transient
corresponds to a variance change point, the transient detec-
tion problem can be modeled as a test statistic H involving
two hypotheses, H
0
and H
1
, expressed by
H
0
: σ
2
0
=···=σ
2
R
−1
,
H
1
: σ
2
0
=···σ
2
k
/
=σ
2
k+1
= σ
2
R
−1
.
(5)
EURASIP Journal on Advances in Signal Processing 5
This test corresponds to cumulative sums of squares test
given by H
= sup(H
+
, H
−
), where
H
+
= max
0≤k≤R−2
k
R −1
−C
k
,
H
−
= max
0≤k≤R−2
C
k
−
k
R −1
,
C
k
=
k
j=0
X
2
j
R−1
j
=0
X
2
j
.
(6)
It is noteworthy that C
k
measures the accumulation of
variance in the signal as a function of time.
According to the definitions given above, the variance
change point can be defined as
k
0
= argmax(H), (7)
where the operator argmax returns the integer k
0
for which
the k-dependent expression is maximal.
6. Geometric Unsupervised Classification
6.1. Feature Space Design. The objective of this phase is to
extract the features from the transient portion of the signal
using information from the time or frequency domain. In
order to cope with the nonstationarity of the transient, a
sliding window is considered. Supposing that the number of
samples in the transient signal is N
s
and that w is the width
of the sliding window, the number of feature samples per
transient N
t
equals
N
t
=
N
s
−w
s
+1, (8)
where s is the sliding factor for the windowing process.
Every time the window is slided by s, we compute the
average amplitude and frequency. For a frame φ
i
,anda
window j, a
ij
and f
ij
denote the average amplitude and
frequency of the corresponding transient, respectively. The
feature map allowing to represent the features of the captured
frame will be defined as follows:
μ
w,s
: Φ −→ R
2N
t
×M
φ
i
−→
a
1
, , a
N
t
, f
1
, , f
N
t
, m
i
,
(9)
where M is the set of MAC addresses and m
i
is the physical
address included in the link-layer header of frame φ
i
.
Moreover, we introduce an application δ on (
R
2N
t
×M)×
(R
2N
t
×M) such that, for every x
1
= [x
1
1
, , x
1
2N
t
+1
]andx
2
=
[x
1
2
, , x
2
2N
t
+1
], the image δ(x
1
, x
2
) is defined as follows:
δ
x
1
, x
2
=
x
1
− x
2
x
1
2N
t
+1
⊕x
2
2N
t
+1
10
, (10)
where
(i)
x
i
= [x
i
1
, , x
i
2N
t
]
T
for i ∈{1, 2} is the prefix of x
i
having 2N
t
components;
(ii)
⊕ denotes the “exclusive OR” operator on binary
strings;
(iii)
· denotes the complement operator on binary
strings;
(iv) (
·)
10
denotes the conversion of a binary string to the
decimal basis;
(v)
· denotes the l
2
-norm on R
2N
t
.
It can be easily proved that δ defines a distance on (
R
2N
t
×
M) ×(R
2N
t
×M). In the following, this distance will be used
to build the frame clusters. To this end, we extend δ to the set
of frames by defining a distance δ
φ
on Φ ×Φ as follows:
∀φ
1
, φ
2
, δ
φ
φ
1
, φ
2
=
δ
μ
w,s
φ
1
, μ
w,s
φ
2
. (11)
In the following subsection, we use the distance δ
φ
to
develop a clustering algorithm on the set of frames.
6.2. Distance-Based Clustering. The goal of this algorithm is
to compute the local density of the feature space. In other
terms, it should compute how many points are “near” each
point in the feature space. In our context, these points, also
referred to as elements, correspond to the captured network
frames. The principal parameter of the algorithm is a radius
r also referred to as cluster width. For any pair of points x
1
and x
2
in the feature space, we consider the two points “near”
each other if their distance is less than or equal to r,which
represents the typical cluster radius (i.e., δ(x
1
, x
2
) ≤ r).
For each point x,wedefineN(x) to be the number of
points that is within r of point x. More formally, N(x)is
expressed using the set cardinality function
|·| as follows:
N(x)
=
s | δ(x, s) ≤ r
. (12)
The straightforward computation of N(x) for all points has
a complexity of O(
|Φ|
2
), where |Φ| is the cardinality of
|Φ|. The reason is that we have to compute the pairwise
distances between all points. The approach that we develop in
Algorithm 1 allows to define N
c
clusters based on the distance
δ
φ
. The complexity of this algorithm is O(N
c
·|Φ|). This is
mainly because the construction of one cluster requires one
pass through the set Φ.
The clustering process is as follows. The first point in Φ
(i.e., φ
1
) is the center of the first cluster. For every subsequent
point, if it is within r of a cluster center, it is added to
that cluster. Otherwise, it is a center of a new cluster. Two
important remarks about this clustering algorithm should be
highlighted.
(1) Several points may be added to multiple clusters at
the same time. We will show that this fact does not
affect the anomaly detection process because it relies
essentially on the cardinality of every cluster and the
local density of the elements within the feature space.
(2) The first point in every cluster is the center of
the cluster meaning that an unclustered element
is assessed with respect to this point to determine
whether it should be appended to the cluster or not.
6 EURASIP Journal on Advances in Signal Processing
begin
N
c
= 1;
C
1
:= φ
1
;
∀i ∈{1, , |Φ|}
x := 0;
∀j ∈{1, ,N
c
}
if δ(φ
i
, c
j
1
) <rthen
C
j
:= C
j
∪{φ
i
};(where∪ is the list concatenation operator)
x :
= 1;
end
end
if x
= 0 then
N
c
:= N
c
+1;
c
N
c
1
:= φ
i
;
end
end
return (C
1
, ,C
N
c
)
end
Algorithm 1: (C
1
, ,C
N
c
) = clustering (Φ).
6.3. Spoofed Frame Detection. Having clustered the set of
captured frames, the IDS should identify the anomalous
samples. According to our approach, the anomalies cor-
responding to MAC address spoofing correspond to low-
density regions of the probability distribution in the feature
space. This is because the clustering algorithm presented in
the previous subsection intuitively clusters the set of frames
according to their source MAC addresses. The details of the
subsequent procedure are given in Algorithm 2. In addition
to the distance δ
φ
defined in (11), the algorithm uses the
Mahalanobis distance that has been introduced in [16]. We
use this distance to measure the intercluster correlation.
More theoretically, we define the distance δ
M
on Φ
× Φ
as follows:
∀φ
1
, φ
2
∈ Φ
, δ
M
φ
1
, φ
2
=
φ
1
−φ
2
T
R
φ
1
−φ
2
,
(13)
where R is the covariance matrix of φ
1
and φ
2
. If the
covariance matrix is diagonal, the Mahalanobis distance can
be expressed as a function of the distance δ
φ
introduced in
(11) as follows:
δ
M
φ
1
, φ
2
=
1
σ
2
φ
1
+
1
σ
2
φ
1
δ
φ
1
1
, φ
2
1
, (14)
where σ
φ
1
and σ
φ
2
stand for the standard deviations of φ
1
and
φ
2
,respectively.
Hence, we develop an anomaly detection algorithm that
characterizes an attack instance as a frame φ verifying one
among the following properties.
(1) φ belongs to a cluster C
k
which is “far,” in terms
of Mahalanobis distance, from the most populated
cluster.
(2) φ is far from the centroid of the cluster to which it
belongs.
In the following, we discuss informally the anomaly
detection algorithm.
(1) Find the largest cluster, that is, the one with the
highest number of elements. This cluster is by default
labeled as normal. Its centroid is labeled as c
π(1)
1
.
(2) Sort the remaining clusters in descending order of the
Mahalanobis distance from each cluster to C
π(1)
.
(3) Within every cluster, sort the elements in descending
order according to their distance δ
φ
from c
π(1)
1
.
(4) Select the first ε
1
N
c
clusters and label them as
potentially normal.
(5) Within every cluster C
k
, select the first ε
2
|C
k
| ele-
ments and label them as normal.
(6) All the elements that have not been labeled as normal
are labeled as attacks.
Clearly, the efficiency of this anomaly detection approach
mainly depends on the choice of the parameters ε
1
and
ε
2
. The false positive rate increases when the values of ε
1
and ε
2
are excessively small because most of the captured
frames would be labeled as abnormal. Conversely, if ε
1
and
ε
2
are large (i.e., very close to 1), the false negative rate
increases as most of the frames would be labeled as normal.
Moreover, the fingerprinting approach has an obvious
influence on the false negative rate. If the RFF approach
does not allow distinguishing two transients generated by
two distinct transceivers, the efficiency of the geometric
classification algorithm is severely affected. A good choice of
the parameters ε
1
and ε
2
can be found experimentally.
7. Transport and Application Layer
Statistical Detection
Network traffic is known to present fractal characteristics
such as long-range dependence (also called self-similarity)
EURASIP Journal on Advances in Signal Processing 7
(C
1
, ,C
N
c
) = clustering (Φ)
Find j such that
|C
j
|=max
k∈{1, ,N
c
}
Build the permutation π such that
(i) π(1)
= j
(ii)
∀k ∈{1, , N
c
}, δ
M
(C
π(k)
, C
π(1)
) ≤ δ
M
(C
π(k−1)
, C
π(1)
)
For every k
∈{1, , N
c
}
Build the permutation π
k
such that
∀l ∈{1, , |C
π
k
|}, δ
c
π(k)
π
k
(l)
, c
π(1)
1
≤
δ
c
π(k)
π
k
(l−1)
, c
π(1)
1
The se t of anomalous events A is expressed by
A
= X \
ε
1
N
c
k=1
c
π(k)
π
k
(1), ,c
π(k)
π
k
(
ε
2
|C
k
|)
Algorithm 2: A = anomaly detection (Φ).
[13, 17], which can be accurately measured using the wavelet
transform. This section investigates the use of the wavelet
transform and change-point detection algorithms in order
to detect the instants when fractality changes abruptly.
We demonstrate that transport-layer and application-layer
traffic data exhibit long-range dependence features. We
particularly study the examples of the transmission control
protocol (TCP) at the transport layer and real-time video
transmission at the application layer. We show how the Hurst
parameter, which expresses the intensity of the long-range
dependence phenomenon, can be estimated through the use
of the wavelet transforms. Recent studies have pointed out
that TCP flows as well as real-time traffictendtohave
self-similar behavior because of the intrinsic mechanisms
they implement such as traffic generation, aggregation, and
control. The interested reader would refer to [14, 17]for
more details about these results. A detection approach can
be developed by measuring the instant, where the traffic
deviatesfromitsnormalmodel.Thisdetectionapproachcan
be particularly efficienttodetecttraffic distortion attacks,
which consist in changing the trafficnormalbehaviorby
dropping packets or injecting packets [18].
7.1. Modeling the Transport and Application Layers Trafficas
a Long-Range Dependent Processes. A stationary stochastic
process X is said to be long range if its autocorrelation
function decays at a rate slower than a negative exponential.
In the frequency domain, long-range dependence appears as
a1/f spectrum around the origin, meaning that
X( f ) ∼
c
f
|f |
2H+1
when |f |−→∞, (15)
where
X is the Fourier transform of X, c
f
is a constant having
dimension of variance, and H denotes the Hurst parameter.
It is noteworthy that c
f
and H can be interpreted as quan-
titative and qualitative measures of long-range dependence,
respectively. In the following, we discuss the long-range
dependence properties of the TCP and video broadcasting
traffic.
The transport layer mainly deals with end-to-end con-
gestion control and assures that arbitrarily large streams of
data are reliably delivered and arrive at their destination
in the order sent. With high-quality trafficmeasurements
at hand, accurate accounting of this multilevel hierarchy of
measured network traffic is possible because all the relevant
information can be obtained by looking inside the collected
packets. As a result of the hierarchy of protocol architectures,
between the transport and application layers, actual network
traffic can be viewed as the result of interwined mechanisms
and modes that exist at the different network layers.
Weconsideranetworkwithanumberofusers/sources
or end hosts communicating with each other in which
an individual source is modeled according to an on-off
alternating renewal process as follows. The source alternates
between an active state or on state where it sends packets into
the network and an inactive or off statewhereitisidleand
does not send any packet. Let
{P(t)} be a stationary process,
where
W(t)
=
1, if time t is an on interval,
0, if time t is an off interval.
(16)
The length of the on intervals is identically distributed,
and so are the lengths of the off intervals. Furthermore,
the lengths of on and off intervals are independent. An off
interval always follows an on interval, and it is the pair of on
and off intervals that defines the interrenewal period.
Let F
on
and F
off
denote the cumulative distribution
function of the on and off intervals, respectively. Let
F = 1−F
denote a complementary cumulative distribution function.
Let also σ
on
and σ
off
represent the respective variances. For
x
→∞,
either
F
on
(x) ∼ l
on
x
−α
on
,1<α
on
< 2orσ
on
< ∞,
either
F
off
(x) ∼ l
off
x
−α
off
,1<α
off
< 2orσ
off
< ∞,
(17)
where α
on
, α
off
, l
on
,andl
off
are constants.
When 1 <α
on
< 2, the distribution of on times is
said to be “heavily tailed” with exponent α
on
. Since it has
infinite variance, the on time can be very long with relatively
high probability. At this level,we interested in analyzing the
behavior of the cumulative load, L(t)
=
t
0
P(u)du,atlarge
times t. This load has variance
σ
L
(t) = 2
t
0
v
0
γ(u)du
dv, (18)
8 EURASIP Journal on Advances in Signal Processing
where γ(u)
= E(P(u)P(0)) − (E(P(0)))
2
denotes the
covariance function of P. It has been shown in [13] that this
implies that
σ
L
(t) ∼ σ
2
t
2
H as t −→ ∞ ,
where σ is a constant and H
= (3 −min(α
on
, α
off
))/2.
Similarly, video traffic can have self-similar behavior.
Motion Picture Expert Group (MPEG) is a set of stan-
dards for compression of video, or sequences of images.
There are several versions of the standards. MPEG-1 is
older, while MPEG-4 is more advanced and achieves bet-
ter compression performances than MPEG-1. The basic
principles of operation of both standards are rather sim-
ilar. Compression is achieved by reducing the spatial and
temporal redundancy in the sequence of images (frames).
Spatial redundancy (redundancy within an image) is reduced
by applying algorithms for compression of still images
(JPEG, e.g.).
It was proved in publications [19, 20] that variable bit
rate (vbr) video traffic can belong to the class of long-range
dependent processes as follows.
(i) The correlation of r
k
demonstrates the hyperbolic
decay for large delays k : r
k
→c
0
k
−β
,ask →∞.
(ii) The power spectral density S(ω)forsmallfrequency
values ω corresponds to the law S(ω)
→c
1
ω
β−1
,as
ω
→∞.
(iii) The variance σ
2
n
of the sample mean value decreases
slower than the inverse sample size n : σ
2
n
=
σ
2
(X
n
) →c
2
n
−β
,asn →∞(X
n
=
n
i
=1
X
i
/n for several
constants c
0
, c
1
, c
2
).
The constant value β
∈ [0; 2] reflects the function type,
0
≤ β<1 indicates the long-range dependence, and 1 <
β
≤ 2 demonstrates the short-range data dependence. (The
persistence degree is often expressed with the help of the
Hurst exponent H
= 1 − β/2.) The long-range dependence
is defined within the limits of the weak stationarity structure
[19, 21], that is, the stationarity in the wide sense.
The stationarity and the ergodicity allow statistical
estimates such as the mean value and the variance or other
model parameters to be found from each separate data
sample, or in this case from the separate time series. If
the assumptions of stationarity and ergodicity do not hold,
certain measures such as the mean value and the variance
may be without meaning. In reality, the mean value of the
VBR video time series converges very slowly, which can be
caused by nonstationarity and not necessarily by long-range
dependence. More details about this aspect are given in the
appendix.
7.2. TCP and Video Broadcast ing Wavelet Analysis. Many
methods have been used to find a Hurst self-similarity
exponent estimate, such as R/S analysis, variance-time
plots, the periodogram analysis, and the Whittle analysis.
However, the long-range dependence property leads to a
serious estimate displacement and difficulties in making
a convergence estimate. Consequently, we investigate the
use of the wavelet transform in order to cope with the
aforementioned shortcuts.
The advantages of the wavelet analysis result from the
fact that the wavelet functions themselves demonstrate
the scaling property and, therefore, form the optimal
“coordinates system,” from which the scaling phenomena
can be traced. This analysis provides steady detection of
the scaling behavior, its type and an accurate measure-
ment of the parameters in order to describe this scaling
behavior.
According to Section 3, the time series X(t)ispresented
in the form
X(t)
= X
J
(t)+
J
j=1
D
j
(t), (19)
where X
J
(t) =
n
0
/2
J
−1
k
=0
s
J,k
ϕ
J,k
(t) is the initial approximation
function corresponding to the scale J (J
≤ J
max
); s
J,k
=
X(t), ϕ
J,k
is the scaling coefficient equal to the scalar
product of the initial series X(t) and the scaling function of
the “roughest” scale J, displaced by k scale units to the right
from the origin of coordinates; D
j
(t) =
n
0
/2
J
−1
k
=0
d
j,k
ψ
j,k
(t)is
the refining function of the jth scale; and d
J,k
=X(t), ψ
J,k
is the wavelet coefficient for scale j equal to the scalar
product of the initial series X(t) and the wavelet with scale
j, displaced by k scale units to the right from the origin of
coordinates.
The normalized wavelet and scaling functions of the Haar
system give good results for the discrete time series analysis.
If
ϕ(t)
=
1, for 1 ≤ t<0,
0, otherwise,
ψ(t)
=
⎧
⎪
⎪
⎪
⎪
⎪
⎪
⎨
⎪
⎪
⎪
⎪
⎪
⎪
⎩
1, as 1 ≤ t<
1
2
,
−1, as
1
2
≤ t<1,
0, otherwise,
(20)
where ψ is the orthonormal wavelet in L
2
(R)space.Itis
called the Haar wavelet and
{ψ
j,k
: j, k ∈ Z} is the
orthonormal system in L
2
(R).
We find that the wavelet coefficients for the time series
expansion over the wavelet functions basis and the Hurst
exponent H fulfill the following equation:
log
2
μ
j
≈ log
2
1
n
j
n
j
k=1
d
x
(j, k)
2
∼
(2H −1)j + C
W
= log
2
1
K
j
K
j
−1
k=0
d(j, k)
2
=
(2H −1)j + C
W,
(21)
where K
j
= n
0
/2
j
is the wavelet coefficient number for the
scale j; C
W
= c
f
C(α, ψ) is the parameter that does not
depend on scale j and α
= 2H −1.
The number of wavelet coefficients decreases as the scale
increases. Formula (21) is used for the Hurst exponent
EURASIP Journal on Advances in Signal Processing 9
estimate of the LRD video sequences. This means that if
X is the LRD process with the Hurst exponent H, the plot
of function j, referred to as the logarithmic diagram (LD),
should have the linear slope 2H
− 1, and demonstrates that
the scaling exponent (2H
− 1) can be obtained from the
plot slope estimate of the function log
2
((1/K
j
)
K
j
−1
k
=0
|d
j,k
|
2
)
of j. Therefore, the Hurst exponent estimate can be found
by means of the choice of the approximated curve equation
using the weighted least squares (WLSs) method.
The logarithm of this variable will be the estimate of
log
2
μ
j
, but will be displaced as the logarithm nonlinearity
shows that M log
2
(d
2
j
)
/
=log
2
(Md
2
j
) = jα+log
2
C
W
. As shown
in [22–24], we reduce the regression analysis problem to
consider the equation My
j
= ja+log
2
C
W
. The estimation of
slope
α can be obtained by carrying out the weighted linear
regression, in which x
j
= j and σ
2
j
= Va r( y
j
). Determining
the quantities S =
j
2
j=j
1
1/σ
2
j
, S
1
=
j
2
j=j
1
j/σ
2
j
,andS
2
=
j
2
j=j
1
j
2
/σ
2
j
, the weighted estimate α can be obtained for α as
α =
j
2
j=j
1
y
j
S
j
−S
1
/σ
2
j
SS
2
−S
2
1
=
j
2
j=j
1
ω
j
y
j
,
(22)
which is unbiased over the interval [ j
1
; j
2
]. In addition,
log
2
C
W
=
y
j
S
2
−S
1
j
/σ
2
j
SS
2
−S
2
1
. (23)
Assuming a weak correlation between wavelet coefficients
in the case when d
j,k
are Gaussian values, the variance σ
2
j
can
be estimated by the expression
σ
2
j
=
σ
2, n
j
/2
ln
2
2
∼
2
n
j
ln
2
2
, (24)
where
σ(2, z)
=
∞
n=0
1
(z + n)
2
(25)
is the generalized Rieman zeta function.
8. Experiments and Simulations
8.1. Traffic Fingerprinting. We tested the MODWT-based
radio fingerprinting method for three signals generated by
WLAN transceivers and three others generated by Bluetooth
transceivers. Through time shifts, we generated 300 signals
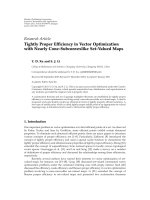
in order to test the time invariance property. Figures 2 and
3 illustrate the performance of our detection technique for
WLAN and Bluetooth signals, respectively. Figure 4 shows
that the MODWT detector (red line) performs better than
the DWT-based technique (green line). Besides, over the
300 signals, we found that the success detection rate for the
MODWT-based transient detection technique is about 89%
while it does not exceed 74% if the traditional DWT is used.
7006005004003002001000
−120
−110
−100
−90
−80
−70
−60
−50
−40
Figure 2:TransientdetectionfromasignalgeneratedbyaWLAN
transceiver.
7006005004003002001000
−110
−105
−100
−95
−90
−85
−80
−75
−70
Figure 3: Transient detection from a signal generated by a
Bluetooth transceiver.
8.2. Simulation of the Anomaly Detection Module. In order
to assess the geometric clustering methodology proposed in
this paper, we simulated a network composed of 20 nodes.
The global flow consists of about 10
6
packets and the attack
rate is 0.1 (10% of the packets are spoofed). It is assumed
that the attack packets follow a Gaussian distribution within
the total traffic. The uncertainty related to MODWT-based
fingerprinting mechanism has been set to 10
−3
.
Based on these assumptions, we evaluated our anomaly-
based detection approach with respect to three well-known
methods: modified cluster TV [25], K nearest neighbors
(KNNs) [26], and support vector machine (SVM) [27]. This
evaluation is based on the receiver operating characteristic
(ROC) curves. The reader may wonder about the choice
of these methods since they are fundamentally supervised
while our geometric technique is unsupervised. In fact, we
try to demonstrate that even though geometric clustering
does not require a training set to optimize its intrinsic
parameters, its performance is comparable to supervised
clustering algorithms, which have been extensively used in
the intrusion detection context. From our experiments, we
10 EURASIP Journal on Advances in Signal Processing
7006005004003002001000
−120
−110
−100
−90
−80
−70
−60
−50
−40
Figure 4: Transient detection from a signal generated by a WLAN
transceiver and shifted by 10 samples.
found that not all the attacks could be detected. This may be
due to two essential factors.
(1) Using our feature map μ
w,s
, some of the spoofed
frames can be in the same region of the feature space
as the normal frames. In fact, the signal fingerprinting
technique can provide falsely correlated fingerprints for
distinct physical addresses
(2) The parameters ε
1
and ε
2
donotfittheactual
probability distribution of the data traffic across the network.
For ε
1
= ε
2
= 0.8, we found that the geometric clustering
approach provides less false positives than the other methods
while keeping the same rate of false negatives (Figure 5).
Figure 6 plots the ROC curve for different values of ε
1
and ε
2
.
These results confirm our remark in Section 6.3 stating that,
on the opposite to the false negative rate, the false positive
rate decreases with respect to the values of ε
1
and ε
2
.
One possible way to adapt
1
and
2
to the performance
of the classifier is to fix a priori a value for the area under the
ROC curve (AUC), and then estimate the values of
1
and
2
for which the ROC curve is characterized by the required
AUC. The AUC, which can be easily computed using the
formula
AUC
=
1+G
2
, (26)
where G is the Gini coefficient [28], is the probability that
a classifier will rank a randomly chosen positive instance
higher than a randomly chosen negative one.
To reduce the computational cost of estimating
1
and
2
, we can draw the ROC curves for two pairs (
1
1
,
1
2
)and
(
1
2
,
1
2
). Then, we compute the corresponding AUCs, say A
1
and A
2
. Supposing that A
r
is the required AUC, interpolating
functions (i.e., polynomials, splines) can be used to estimate
the values of
r
1
and
r
2
. Obviously, more than two pairs can
be used for a more accurate estimation of
r
1
and
r
2
.However,
this would result in a computational overhead.
8.3. Traffic Pattern Distor tion Detection. To test the efficiency
of the traffic pattern distortion detector, we generated a TCP
100806040200
False positive rate (%)
0
10
20
30
40
50
60
70
80
90
100
Detection rate (%)
Modified cluster−TV
KNN
SVM
Geometric clustering
Figure 5: Performance of the geometric clustering algorithm with
respect to existing approaches.
100806040200
Falsepositiverate(%)
0
10
20
30
40
50
60
70
80
90
100
Detection rate (%)
(0.85, 0.8)
(0.7, 0.7)
(0.85, 0.85)
Figure 6: Performance of the geometric clustering algorithm
according to ε
1
and ε
2
.
traffic respecting the statistical model presented in Section 7
and we injected eight denial-of-service attack instances.
We used the wavelet-based Hurst parameter estimator
described in Section 7 in conjunction with three change-
point detection algorithms which are moving window-
iterated cumulative sums of squares (MWICSSs), moving
window Schwarz information criterion (MWSIC), and mov-
ing window Wang’s jump (MWWJ) [29]. The simulation
scenario can be described through the following points.
Step 1. We apply the DWT and MODWT. The maximum
level of the transforms depends on the length of window.
Whitcher et al. [29] recommend to use at least 128 data
points to implement the variance change test. Moreover,
EURASIP Journal on Advances in Signal Processing 11
0
50
100
150
Correlation
signal
MWICSS
MWSIC
MWWJ
Actual
1st, 2nd, and 3rd attacks
(a)
0
50
100
150
Correlation
signal
MWICSS
MWSIC
MWWJ
Actual
4th, 6th, and 8th attacks
(b)
Figure 7: Detection of traffic distortion attacks within TCP traffic.
we want to apply to the coefficients the Ljung-Box test for
autocorrelation with maximum lag 10 (see Step 2). For the
sake of clarity and computation cost efficiency, we choose to
compute wavelet transforms up to level 4.
Step 2. The application of the MWICSS and MWSIC
algorithms to test for variance changes requires uncorrelated
data. We, therefore, choose the DWT with highest P-value
among those packets of the tree for which the null hypothesis
of the Ljung-Box test for autocorrelation is not rejected.
Step 3. We test for variance changes (with either the ICSS or
the SIC algorithm) using the coefficients of the DWT packet
selected from Step 2. If the null hypothesis that no variance
change occurs is rejected then we identify the location of the
change point using now the nondecimated wavelet packet
coefficients of the packet selected in Step 2.
Step 4. Using the binary segmentation procedure, we repeat
Steps 1–3 with subsequent subseries until no further variance
change point is found. In the case of the ICSS procedure,
we also perform the additional confirmatory step on all
identified potential change points by using subseries of data
between adjacent points, as suggested by Incl
´
an and Tiao
[30].
Step 5. We record information of the type (t
j
; f
j
), where t
j
is
a time location and f
j
is its frequency of detection, that is,
how many times a change at that point has been detected
by the method up to the window under consideration.
We declare a certain time point to be a variance change
if its frequency of detection is greater than or equal to
a predetermined threshold T. A smaller T implies not
only a faster detection but also a larger number of false
alarms.
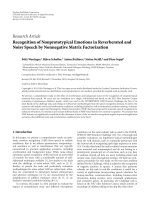
Plots of Figure 7 give a graphical representation of the
performances of the three detection methods. There, each of
the two subplots contains a different portion of the signal,
displaying 1st, 2nd, 3rd attacks and 4th, 6th, and 8th attacks,
respectively, as representatives of the two different kinds of
change points, in mean and in variance. Results for MWICSS
and MWSIC are for a threshold level 2 and window size
128, those for MWWJ are for window size 128. In these
plots, the solid circles indicate the real change points, the
square rectangles, the points detected by the MWICSS, the
diamonds those detected by the MWSIC, and the triangles
those detected by the MWWJ. Notice how the MWICSS and
MWSIC algorithms do a better job at detecting attacks of
the first type, that show variance changes. However, there
appears to be an asymmetric aspect in the detection of these
two methods, in that both the MWICSS and the MWSIC
detect the start of the attacks but show a relative large delay in
detecting the ending points. In other words, these algorithms
seem to be sensitive to the location of the change points and
to the variance ratio.
9. Conclusion
In this paper, we presented a multilayer intrusion detection
approach for wireless networks. Our approach combines
a physical layer antispoofing filter with advanced statisti-
cal traffic anomaly detectors. The antispoofing technique
consists of a radio signal fingerprinting mechanism and
a geometrical clustering algorithm while trafficanomaly
detection is based on the estimation of the Hurst parameter
of the real traffic. Thorough simulations show that our
IDS provides better performance than the most known
existing approaches. Furthermore, a postprocessing module
is currently under development. Cooperative tracking using
large groups of mobile detector nodes is investigated to this
purpose. A Kalman filter-like estimator is being implemented
and tested in order to examine the effect of the detector
node density in the monitored area on the accuracy of the
tracking results. More precisely, we assess the improvement
in tracking efficiency per additional detector node as the
coverage of the monitored region increases.
Appendix
Stationarity Testing for Stochastic Processes
Let X(n), n = 0, 1, 2, , be the stochastic process with the
power spectral density S(ω). This process periodogram can
be estimated in the form
I
N
(ω) =
1
2πN
N−1
n=0
X(n) −X
e
jωn
2
,(A.1)
where
X is the sample mean value which converges to
(1/2)S(ω)χ
2
2
(see, e.g., [31]) for ω
/
=0; ±π; ±2π; This
implies that
I
N
(ω) for large N is an unbiased but ungrounded
estimate, as lim
N →∞
σ
2
I
N
(ω) = S
2
(ω). Nevertheless, it is true
that for two fixed frequencies, ω
1
and ω
2
, the periodogram
12 EURASIP Journal on Advances in Signal Processing
ordinates
I
N
(ω
1
)and
I
N
(ω
2
) are approximately noncor-
related. These properties are also correct for long-range
dependent processes [21]. The application of the spectral
window Λ(ω) gives the consistent estimate [31]
I
N
(ω) =
+π
−π
I
N
(ω)Λ(Θ −ω)dω. (A.2)
Choosing the Bartlett-Priestley spectral window
[31] gives the following expression σ
2
[I
N
(ω)] ≈
[(6M)/(5M)]S
2
(ω) for the variance. The variance still
depends on the power spectral density itself. To avoid this
functional dependence, the logarithmic variance stabilizing
transform can be used [32].
For the first accuracy order,
M
log
I
N
≈
log
I
N
,
(A.3)
σ
2
log
I
N
≈
2π
N
+π
−π
Λ
2
(Θ)dΘ,
(A.4)
where ω
/
=0; ±π; Thus, the estimate log(I
N
) is closer
to the normal value than the nontransformed estimate. To
prove (or to negate) the assumption of weak nonstationarity,
the X process is divided into I segments, each of which
is centered by time t
i
and has the length N.Foreachith
segment, the power spectral density
I
N,i
(ω) is calculated in
accordance with (A.2). The discretization of the smoothed
periodogram (A.2) is carried out by frequencies ω
i
=
πj/N (j = j
0
+ kΔj, k = 0, 1, , J), and taking a
logarithm gives the two-dimensional random variable Y
ij
=
log[I
N,i
(ω
j
)]. If the frequencies ω
i
, like the times t
i
,have
a wide enough dispersion, the random variable Y
ij
is
distributed approximately normally and is noncorrelated
[33]. The assumption of Y
ij
approximate normality and lack
ofcorrelationinbothmeasurementsimply Y
ij
approximate
independence. Therefore, to define the structure of the basic
random process the method of variance analysis can be used
[32, 33]
Y
ij
= μ + a
t
i
+ b
ω
i
+ c
t
i
, ω
i
+ η
ij
,(A.5)
where η
ij
is the independent and identically distributed
normal random variable with zero mean value and variance
σ
2
, defined by the relation (A.4). The presence of c(t
i
, ω
i
)and
a(t
i
) can be checked using the variables
S
I+R
=
I
i=1
J
j=1
Y
ij
−Y
.j
−Y
i.
+ Y ···
2
,
S
T
= J
I
i=1
Y
i.
−Y ···
2
,
(A.6)
where the dot shows the mean value over the index for which
it substitutes: for example, Y
.j
=
I
i=1
Y
ij
/I. In the stationary
process, the terms c(t
i
, ω
i
)anda(t
i
)canbeexpectedto
disappear. In this case, the variables S
I+R
/σ
2
and S
T
/σ
2
are
χ
2
-distributed with (I − 1)(J − 1) and (I − 1) degrees of
freedom, respectively. The stationarity hypothesis is rejected
if one of the statistical tests exceeds 1% of the quantile of
the appropriate χ
2
distribution. This test cannot be used in
the case of long-range dependence because the noise is not
normally distributed and correlated.
References
[1] J. Hall, M. Barbeau, and E. Kranakis, “Detection of transient
in radio frequency fingerprinting using signal phase,” in
Proceedings of the Secure Mobile Ad-hoc Networks and Sensors
Workshop, Held in Conjunction with the International Indus-
trial Simulation Conference (ISC ’05), Singapore, September
2005.
[2] C. Partridge, D. Cousins, A. W. Jackson, R. Krishnan, T.
Saxena, and W. T. Strayer, “Using signal processing to analyze
wireless data traffic,” in Proceedings of the 1st ACM Workshop
on Wireless Security (WiSe ’02), pp. 67–76, Atlanta, Ga, USA,
September 2002.
[3] P. Mateli, “Hacking techniques in wireless networks,” in
Handbook of Information Security, H. Bidgoli, Ed., pp. 83–93,
John Wiley & Sons, New York, NY, USA, 2006.
[4] A. Meddeb-Makhlouf and N. Boudriga, “Intrusion and
anomaly detection in wireless networks,” in Handbook of
Research on Wireless Secur ity, Y. Zhang, J. Zheng, and M. Ma,
Eds., Information Science Reference, Hershey, Pa, USA, 2008.
[5] G. Sch
¨
afer, Security in Fixed and Wireless Networks: An
Introduction to Securing Data Communications, John Wiley &
Sons, New York, NY, USA, 2003.
[6] C. Low, “Understanding Wireless attacks & detection,” GIAC
Security Essentials Certification (GSEC) Practical Assign-
ment Version 1.4c, April 2005, />resource/hot-topic/wlan/1633.pdf.
[7] K. Hutchison, “Wireless Intrusion Detection Systems,”
GIAC Security Essentials Certification (GSEC) Practical
Assignment Version 1.4c, SANS institute, October 2004,
/>room/whitepapers/wireless/.
[8] J. Hall, M. Barbeau, and E. Kranakis, “Using mobility profiles
for anomaly-based intrusion detection in mobile networks,” in
Proceedings of the 12th Annual Network and Distributed System
Securit y Symposium (NDSS ’05), vol. 2, San Diego, Calif, USA,
February 2005.
[9] C. Valli, “WITS: wireless intrusion tracking system,” in
Proceedings of the 3rd European Conference on Information
Warfare and Security (ECIW ’04), pp. 28–29, Reading, UK,
June 2004.
[10] J. Hall, M. Barbeau, and E. Kranakis, “Detecting rogue devices
in bluetooth networks using radio frequency fingerprinting,”
in Proceedings of the 3rd IASTED International Conference on
Communications and Computer Networks (CCN ’06), pp. 108–
113, Lima, Peru, October 2006.
[11] K. Samad, E. Ahmed, and W. Mehmood, “Simplified clus-
tering approach for intrusion detection in mobile ad hoc
networks,” in Proceedings of the 13th International Conference
on Software, Telecommunications and Computer Networks
(SoftCOM ’05), Split, Croatia, September, 2005.
[12] M. J. Shensa, “The discrete wavelet transform: wedding the
`
a trous and Mallat algorithms,” IEEE Transactions on Signal
Processing, vol. 40, no. 10, pp. 2464–2482, 1992.
[13]W.Willinger,M.Taqqu,R.Sherman,andD.Wilson,“Self-
similarity through high-variability: statistical analysis of eth-
ernet LAN traffic at the source level,” in Proceedings of the
ACM Conference on Applications, Technologies, Architectures,
and Protocols for Computer Communications (SIGCOMM ’95),
pp. 100–113, Cambridge, Mass, USA, August-September 1995.
[14] M. S. Taqqu and J. B. Levy, “Using renewal processes to
generate long-range dependence and high variability,” in
Dependence in Probability and Statistics,E.EberleinandM.S.
Taqqu, Eds., pp. 89–73, Birkh
¨
auser, Boston, Mass, USA, 1986.
EURASIP Journal on Advances in Signal Processing 13
[15] J. Beran, Statistics for Long-Memory Processes, Chapman &
Hall, London, UK, 1994.
[16] P. C. Mahalanobis, “On the generalized distance in statistics,”
ProceedingsofoftheNationalInstituteofScienceofIndia, vol.
12, pp. 49–55, 1936.
[17] K. Park and W. Willinger, Self-Similar Network Trafficand
Performance Evaluation, John Wiley & Sons, New York, NY,
USA, 2000.
[18] M. A. Azer, S. M. El-Kassas, and M. S. El-Soudani, “A
survey on anomaly detection methods for Ad hoc networks,”
Ubiquitous Computing and Communication Journal, vol. 2, no.
3, pp. 67–76, 2005.
[19] O. I. Sheluhin, A. V. Pruginin, A. V. Osin, and G. A.
Urev, “Mathematical models and imitation modeling of the
Vo IP tr a fficaggregation,”Electrotekhnicheskie i Informacionnie
Kompleksi i Siste mi, vol. 2, no. 1, pp. 32–37, 2006 (Russian).
[20] T. Tuan and K. Park, “Multiple time scale congestion control
for self-similar network traffic,” Performance Evaluation, vol.
36-37, pp. 359–386, 1999.
[21] T. Tuan and K. Park, “Congestion control for self-similar net-
work traffic,” in Self-Similar Network Traffic and Performance
Evaluation, K. Park and W. Willinger, Eds., Wiley-Interscience,
New York, NY, USA, 1999.
[22] Z. Haas and J. H. Winters, “Congestion control by adaptive
admission,” in Proceedings of the 10th Annual Joint Conference
of the IEEE and Communications Societies (INFOCOM ’91),
vol. 2, pp. 560–569, Bal Harbour, Fla, USA, April 1991.
[23] V. Jacobson, “Congestion avoidance and control,” in Proceed-
ings of the ACM Symposium on Communications Architectures
and Protocols (SIGCOMM ’88), pp. 314–329, Standford, Calif,
USA, August 1988.
[24] S. Keshav, “A control-theoretic approach to flow control,”
in Proceedings of the ACM Symposium on Communications
Architectures and Protocols (SIGCOMM ’91), pp. 3–15, Zurich,
Switzerland, August 1991.
[25] M. Ankerst, M. M. Breunig, H P. Kriegel, and J. Sander,
“OPTICS: ordering points to identify the clustering structure,”
ACM SIGMOD Record, vol. 28, no. 2, pp. 49–60, 1999.
[26] V. B. Sasarathy, Nearest Neighbor (NN) Norms: NN Pattern
Classification Techniques, IEEE Computer Society Press, Los
Alamitos, Calif, USA, 1990.
[27] N. Cristianini and J. Shawe-Taylor, An Introduction to Support
Vector Machines and Other Kernel-Based Learning Methods,
Cambridge University Press, Cambridge, UK, 2000.
[28] D. J. Hand and R. J. Till, “A simple generalisation of the
area under the ROC curve for multiple class classification
problems,” Machine Learning, vol. 45, no. 2, pp. 171–186,
2001.
[29] B. Whitcher, P. Guttorp, and D. B. Percival, “Multiscale
detection and location of multiple variance changes in the
presence of long memory,” Journal of Statistical Computation
and Simulation, vol. 68, no. 1, pp. 65–88, 2000.
[30] C. Incl
´
an and G. C. Tiao, “Use of cumulative sums of squares
for retrospective detection of changes of variance,” Journal of
the American Statistical Association, vol. 89, no. 427, pp. 913–
923, 1994.
[31] J C. Bolot and A. U. Shankar, “Analysis of a fluid approx-
imation to flow control dynamics,” in Proceedings of the
the 11th Annual Joint Conference of the IEEE Computer and
Communications Societies (INFOCOM ’92), vol. 3, pp. 2398–
2407, Florence, Italy, May 1992.
[32]L.S.BrakmoandL.L.Peterson,“TCPVegas:endtoend
congestion avoidance on a global internet,” IEEE Journal on
Selected Areas in Communications, vol. 13, no. 8, pp. 1465–
1480, 1995.
[33] M. Gerla and L. Kleinrock, “Flow control: a comparative
survey,” IEEE Transactions on Communications,vol.28,no.4,
pp. 553–574, 1980.