Báo cáo hóa học: " Research Article Optimal Channel Selection for Spectrum-Agile Low-Power Wireless Packet Switched Networks in Unlicensed Band" doc
Bạn đang xem bản rút gọn của tài liệu. Xem và tải ngay bản đầy đủ của tài liệu tại đây (948.71 KB, 10 trang )
Hindawi Publishing Corporation
EURASIP Journal on Wireless Communications and Networking
Volume 2008, Article ID 896420, 10 pages
doi:10.1155/2008/896420
Research Article
Optimal Channel Selection for Spectrum-Agile Low-Power
Wireless Packet Switched Networks in Unlicensed Band
Ali Motamedi and Ahmad Bahai
Department of Electrical Engineering, Stanford University, University of California at Berkeley and National Semiconductor,
Stanford, CA 94305, USA
Correspondence should be addressed to Ali Motamedi,
Received 1 June 2007; Revised 8 December 2007; Accepted 2 March 2008
Recommended by Milind Buddhikot
This paper addresses the problem of optimal channel selection for spectrum-agile low-powered wireless networks in unlicensed
bands. The channel selection problem is formulated as a multiarmed bandit problem enabling us to derive the optimal selection
rules. The model assumptions about the interfering traffic that motivates this formulation are also validated through 802.11 traffic
measurements as an example of a packet switched network. Finally, the performance of the optimal dynamic channel selection
is investigated through simulation. The simulation results show that the proposed algorithm consistently tracks the best channel
compared to other heuristic schemes.
Copyright © 2008 A. Motamedi and A. Bahai. This is an open access article distributed under the Creative Commons Attribution
License, which permits unrestricted use, distribution, and reproduction in any medium, provided the original work is properly
cited.
1. INTRODUCTION
Interest in wireless technology has experienced an explosive
growth over the last decades. The finalization of diverse
standards has eased the development of wireless applications.
Specially those devices operating in the unlicensed Industrial,
Scientific, and Medical (ISM) band. This popularity caused
the spectrum to be congested. Since the current applications
using the ISM band operating on different standards, they
might not be able to communicate with each other to
share the spectrum effectively. The problem was first noticed
for the case of coexistence between 802.11b and 802.15.1
(Bluetooth) networks [1] resulting in establishment of
the IEEE 802.15.2 working group for addressing it. Since
the 802.15.1 PHY is based on frequency-hopping spread
spectrum (FHSS), an adaptive frequency-hopping scheme
is proposed for Bluetooth to avoid the harmful interference
of 802.11b networks [2]. Another example is the common
spectrum coordination channel (CSCC) etiquette [3] that
has been proposed to resolve the coexistence of IEEE 802.11b
and 802.16a networks.
In all of the mentioned previous works, since the power
level of the coexisting networks is comparable, then both
can benefit from interference avoidance via using spectrum
sharing etiquettes. In this paper, however, we consider the
case when one of the networks either has no incentive to
follow a spectrum sharing etiquette, or imposing such eti-
quette will not be technically feasible. The popular example
of this type is the spectrum sharing between 802.15.4 and
802.11 networks operating in the ISM band. Although in this
case both networks are unlicensed, due to the difference in
their transmission power, if both access the same band at
the same time, most likely the packet of 802.15.4 with lower
transmission power will be lost while the 802.11 packet will
be unaffected. In this case, adding spectrum-agility on top
of the 802.15.4 standard could be beneficial by allowing the
wireless stations change their operating frequency to avoid
destructive interference with 802.11 networks. Although
throughout the paper we frequently cite this example for the
sake of concreteness, the proposed algorithm is not limited
to a particular standard. As we describe in the subsequent
sections, we consider a simple sense-before-talk media access
model which is the basis of most packet-switched MAC
protocols. Thus, the algorithms proposed in this paper can
be added on top of any packet-switched standard to provide
spectrum-agility in presence of other interferers with higher
transmission power.
To devise an effective spectrum-agile medium access
control (MAC) for low-powered packet-switched networks
is the goal of this paper. In the proposed solution, the agile
2 EURASIP Journal on Wireless Communications and Networking
802.11 Access points
802.15.4 PANs
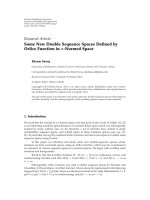
Figure 1: An example in which spectrum-agility would be ben-
eficial: 802.11 nodes communicating to an AP and 802.15.4 PAN
around their coordinators.
user captures the traffic patterns of other interfering users
as it accesses different channels. We formulate the channel
selection as a reinforcement learning problem. We show that
the problem structure enables us to further reduce it to a
multiarmed bandit problem. This stochastic control strategy
guarantees the best decision given the information users
have about each channel. Simulation results confirm that this
optimal strategy indeed consistently tracks the best channel
compared to other sensible heuristic methods.
2. SYSTEM MODEL
We assume there are two groups of users coexisting in the
contention domain: interfering users and spectrum-agile
(SA) nodes. The interfering nodes can harm the spectrum-
agile nodes because of higher transmission power. As a result,
the communication of the spectrum-agile users will fail if at
least one of the interfering users accesses the same channel
at the same time. For example the interfering nodes could be
802.11b/g stations communicating with their Access Points
(APs) and the spectrum-agile users are sensor nodes in
their personal area networks (PANs) as shown in Figure 1.
We also assume that interfering stations do not cooperate
with spectrum-agile nodes, thus it is the responsibility of
spectrum-agile user to minimize the chances of interference
with other incumbent users.
We assume that the total available spectrum is divided
into M separate channels; all channels can be used by
both the SA and other coexisting networks. We assume all
networks are packet switched where data transmission is
performed by transmitting variable-sized packets. The goal
is then to allow spectrum-agile nodes dynamically tune to
various channels finding the one that will not be accessed
by an interfering node during its packet transmission time.
As we will see in later sections, this strategy is specifically
beneficial when the traffic of interfering users across the
channels is varied. In this case, spectrum-agile users can
benefit from the agility by ideally using the least congested
channel.
f
i
f
j
f
M
Frequency
Time slots
Idle
i
α geom. (q
i
)
Figure 2: The duration of idle and busy periods normalized to slot
time form discrete random variables.
When a channel is selected, both the receiver and the
transmitter tune to the agreed channel and exchange their
packet(s). The logistics of how the users can coordinate to
change their operating frequency channel have been studied
in the multichannel MAC context. Numerous methods have
been suggested most using a common global control channel
to exchange the decision of the chosen channel between
transmitter and receiver [4]. In this paper, however, we only
focus on the algorithm for dynamic channel selection that
ensures the spectrum-agile users will converge to the best
channel.
2.1. Interfering traffic model
In order to estimate the probability that interfering nodes
affect a spectrum-agile node, we first model the traffic
patterns of interfering users. We assume time is slotted and
all of the packet transmissions are synchronized with the
beginning of a time slot. Each time-interval measurement is
also normalized to the time-slot duration σ. Throughout this
paper, by the size of a packet we mean its transmission time
normalized to the slot time. Thus, if a packet contains B bits
and it is transmitted with data rate of R bps, the normalized
packet size L is given by
L
=
B
Rσ
. (1)
Since we assumed the interfering nodes belong to a
packet-switched network, from their perspective the inter-
ference on a channel can be seen as a random process
alternating between busy(ON) state (during the packet
transmission time of interfering nodes) and idle(OFF) state
as shown in Figure 2. The durations of these busy and idle
intervals are random variables determining the trafficpattern
of interfering network in each channel.
For the reasons that will follow, we assume that the
duration of idle intervals, for channel i, is modeled as a
geometric random variable with parameter q
i
:
Pr
idle
i
= K
=
1 − q
i
K−1
q
i
. (2)
Following the analytical formulation of 802.11 systems
[5], it has been shown that this assumption is valid for
interference caused by those networks. Specifically they
validated the assumption of constant collision probability
which means at each time slot there is a constant probability
that an 802.11 user accesses the channel, or equivalently
A. Motamedi and A. Bahai 3
0
0.01
0.02
0.03
0.04
0.05
0.06
0.07
0.08
0.09
0.1
Probability density
0.10.20.30.40.50.60.70.80.91
Idle time
802.11 Channel 11
Best geometric model: q
= 0.051351
Empirical distribution
(a)
0
0.01
0.02
0.03
0.04
0.05
0.06
0.07
0.08
0.09
0.1
Probability density
0.10.20.30.40.50.60.70.80.91
Idle time
802.11 Channel 6
Best geometric model: q
= 0.023734
Empirical distribution
(b)
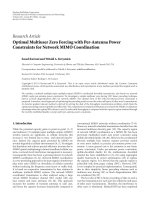
Figure 3: The duration of idle time in between 802.11 packets can be modeled as geometric random variables.
the time duration between two packets is geometrically
distributed. We however explicitly validated this assumption
through traffic measurements of an 802.11b network—as
an example of a packet switched network—using a packet
sniffer [6]. In the measurement setup, we monitor two
channels for five minutes and record the transmission and
reception times of all exchanged packets. Using this data,
it is possible to calculate busy and idle durations. Figure 3
shows the empirical histogram of the idle intervals for both
channels. The plots also show in solid lines the probability
distribution of the geometric random variable that best
approximates the histogram. The parameter of the geometric
distribution is chosen to minimize the error which is defined
as the sum of squares of differences between the predicted
probability of each bin and the empirical histogram resulted
from traffic measurements. For both channels, the geometric
assumption leads to less than 5% error.
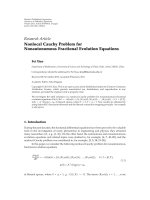
We also investigated how the parameter describing the
geometric model varies over time by running a sliding
window over data and calculating the best parameter of the
underlying geometric distribution for all the data points
within that window. Choosing a relatively small window size
captures more local traffic behavior but might not contain
sufficient data points to remove the estimation variance.
On the other hand, choosing a relatively large window size
will result in less estimation variance, but will not capture
the local traffic behavior. The size of the sliding window is
hence chosen to minimize the approximation error of the
geometric model. According to the selected window size, the
parameters q for all sliding windows were calculated with less
than 6% mean square error for both channels. The results are
shown in Figure 4. We can observe that these parameters are
relatively constant for channel 6 and change every 20 seconds
for channel 11.
We also performed statistical analysis to find any patterns
in the busy periods. However, as opposed to idle times the
histogram of busy period did not show any consistent pattern
in its distribution. Thus in traffic model, the SA nodes only
learn the average busy period for each channel
B
i
.Aswe
will see in the next section according to the channel access
model in which the SA node first senses the channel and
then transmits its packet, the average busy period does not
affect the probability of success. It only affects the probability
of sensing a channel idle or busy. However there might be
a correlation between traffic parameter q
i
and the average
busy period
B
i
. But in this model, the SA nodes do not
try to learn that correlation and capitalize on it for channel
selection.
2.2. Channel access model
In this section, we describe how SA nodes access the channel,
and how they collect information on the interference by
doing so. We assume that the channels are perfect, that
is, the packet loss only happens when there is a collision
with interfering users or equivalently when the channel
state becomes busy during the packet transmission time.
The SA node should then use each channel opportunisti-
cally by transmitting its own packet in between the busy
states.
We assume a simple sense-before-talk channel access
protocol. In this protocol, first the node senses the selected
channel to check whether it is idle or busy. Practically, this
can be done through energy detection (ED). Carrier sensing
is only an option when the SA nodes have the knowledge
about the physical layer characteristics of interfering users’
signal. We assume a perfect coordination between SA users.
In other words, if the channel is used by a transmitter and
4 EURASIP Journal on Wireless Communications and Networking
0
0.02
0.04
Idle to busy probability
50 100 150 200 250 300
Capture time (sec)
Channel 11
(a)
0
0.02
0.04
Idle to busy probability
50 100 150 200 250 300
Capture time (sec)
Channel 6
(b)
Figure 4: The idle-to-busy probability q, characterizing the idle time distribution varies over time.
receiver pair, all of the other SA nodes in the contention
region are aware of this and will not collide with them.
The access protocol is nonpersistent, meaning that if the
channel is sensed busy, the transmission cycle ends and a
busy statistics is recorded, and the SA node tries to use
another channel. Otherwise, the node transmits its packet.
Following the traffic model, the probability that the
transmitted packet of size L is not corrupted by an interfering
node is equal to the probability that the selected channel
(that was initially idle) remains idle for L subsequent time
slots:
p
success
i
= Pr
success|status
i
t
sensing
=
idle
=
1 − q
i
L
.
(3)
We used the memoryless property of geometric distri-
bution for this derivation. If the distribution of the idle
times was not memoryless, the probability of success would
also depend on the amount of time that has elapsed since
the channel became first idle. However, if the idle time is
geometrically distributed, the probability of success is given
by (3) since we know that the channel was idle before the
transmission at the time of channel sensing: t
sensing
.Itis
worth to mention that the success of a packet of size L
can be also seen as L successive Bernoulli trial each with
parameter 1
− q
i
; the packet is successful if all of the trials
are successful and fails if at least one of them fails. Given
the above channel access model, the spectrum-agile user can
decide which channel to choose if the following parameters
are known:
(i) p
idle
i
; i ∈{1 M} probability of sensing the channel
idle at any time,
(ii) q
i
; i ∈{1 M} interference probability.
If these parameters that are called traffic parameters
throughout this paper were exactly known in advance, the
SA nodes could easily choose the best channel to maximize
the probability of success. However, an SA node has no prior
knowledge about these parameters hence it has to estimate
them.
For estimating the traffic parameters and subsequently
choosing the best channel, two approaches are possible. In
the first approach the SA node tunes to each channel and
scans it for a fixed amount of time to record the duration
of busy and idle states and consequently estimate the traffic
parameters. Although this approach can give an acceptable
estimate, it incurs a significant amount of delay and energy
consumption cost that has to be paid periodically to account
for traffic parameters’ changes (see Figure 4). Even more, due
to these traffic parameter variations, when the scanning of
the last channel is finished the estimate for the first one might
no longer be valid.
In the second approach, which is used in this paper,
the node gradually learns the best channel as it tries to use
different channels. This learning is achieved by defining a
measure of quality for each channel and the node chooses
the one with the highest expected quality. After the trans-
mission is finished, the measure of quality for the selected
channel is updated to reflect the last transmission result.
Intuitively, successful transmissions should increase this
measure and interference and busy events should decrease
it. This measure of quality will be quantified in Section 3.
In this approach, the spectrum-agile node does not need
to wait until the scanning phase is finished. Therefore,
compared to the first approach, it can start transmitting
faster. The node learns about the quality of the channels
as it tries to use them and eventually converges to the best
one.
3. OPTIMAL CHANNEL SELECTION
We can formulate the channel selection problem as a sequen-
tial optimization over time. In this model, the algorithm
decides which channel is the best considering the history
of transmission results experienced using all channels. That
history enables the user to predict the future transmission
results if the traffic parameters are relatively constant during
the convergence window. Due to this nature, we formulate
the optimal channel selection as a reinforcement learning
problem [7]. This formulation requires defining rewards or
utilities attached to each transmission outcome, and finding
a policy that accumulates the highest reward over time.
The rewards should reflect our design objectives and, hence,
establish a criterion for optimality. One such criterion is to
maximize the probability of a successful packet transmission
A. Motamedi and A. Bahai 5
or equivalently minimizing the packet errors rate:
R(t)
=
⎧
⎪
⎪
⎪
⎨
⎪
⎪
⎪
⎩
R
b
= 0, channel was busy,
R
s
= 1, successful transmission,
R
f
= 0, transmission failure due to collision.
(4)
It is worth to mention that different design goals can
be translated to different reward functions, which can be
expressed as a combination of rewards for each of the
possible transmission outcomes R
b
, R
s
,andR
f
.Forexample,
one can introduce the energy waste resulting from packet
failures and busy sensing as negative rewards, that is, costs,
in (4). Doing so will form a channel selection policy that
is more inclined to prevent energy waste than to ensure
successful packet transmission, although both objectives are
not completely uncorrelated. In this paper however, we limit
the analysis and simulation to the reward function defined in
(4), and focus on reducing packet error rate by introducing
spectrum-agility.
Having defined the reward and objective functions, we
can now solve the channel selection problem. In this section,
we first introduce a Bayesian predictive model to relate
the estimated traffic parameters to the history of recent
transmission outcomes. We then derive the optimal policy
that maps each state into the optimal action that maximizes
the total expected accumulated reward.
3.1. Bayesian predictive model
Since the parameters p
idle
and q are not known to SA users,
they are assumed to be random variables with distributions
f
idle
t
(x)and f
q
t
(x) (the channel index subscript is removed
for notational simplicity. The dependence of the traffic
parameters on the channel number is implicit.) defined on
[0, 1]. This distribution is a function of time. As time passes
and the user gathers more information about each channel,
the distributions will have less variance and will ideally
converge to the actual values of the traffic parameters.
After each transmission attempt, depending on the fact
whether the selected channel was idle or busy at the time of
spectrum sensing, the posterior probability distribution of
p
idle
is updated according to Bayes’ rule:
f
idle
t+1
(x)|idle
t
=
xf
idle
t
(x)
1
0
xf
idle
t
(x)dx
,
f
idle
t+1
(x)|busy
t
=
(1 − x) f
idle
t
(x)
1
0
xf
idle
t
(x)dx
.
(5)
Assuming that the parameter p
idle
is uniformly
distributed in [0, 1] at time zero (i.e., f
idle
0
= 1) and
using (A.1), it can be shown that at time t it is governed by
the following beta distribution:
f
idle
t
x|b
t
= b; i
t
= i
=
(i + b +1)!
b!+i!
x
i
(1 − x)
b
,(6)
where b
t
and i
t
are the number of times (until time t),
the channel was sensed busy and idle, respectively. Figure 5
(i, b) = (0, 0) (i, b) = (0, 1) (i, b) = (0, 2) (i, b) = (0, 3)
(i, b)
= (1, 0) (i, b) = (1, 1) (i, b) = (1, 2) (i, b) = (1, 3)
(i, b)
= (2, 0) (i, b) = (2, 1) (i, b) = (2, 2) (i, b) = (2, 3)
(i, b)
= (3, 0) (i, b) = (3, 1) (i, b) = (3, 2) (i, b) = (3, 3)
Figure 5: The distribution of p
idle
as a function of statistics i and
b. As more information is gathered, the variance of the distribution
decreases.
shows the distribution of the idle probability as a function
of the number of encountered events of each type. As the
amount of information increases, the distribution becomes
more and more certain—that is, having less variance—in
estimating the traffic parameters.
The expected value of (6) gives the best estimate of the
idle probability at time t:
p
idle
t
=
1
0
xf
idle
t
(x)dx =
i
t
+1
b
t
+ i
t
+2
. (7)
Therefore the best estimate of the idle probability can be
determined by knowing the pair (i
t
, b
t
) for each channel.
Estimating the interference probability q is not as
straightforward since it not only depends on the trans-
mission outcome but also on the size of the packets. For
example, given equivalent conditions, failure of a shorter
packet indicates a higher interference probability than that
of a longer one. Thus, the history of transmission outcomes
can be written as
H(t)
=
b
t
, i
t
,
l
1
, l
2
, , l
s
,
l
1
, l
1
, , l
f
,(8)
where l
i
is the size of ith successful packet and l
j
is the
size of jth failed or collided packet. Knowing this history
at time t, the most likely distribution of the interference
probability can then be calculated. Please refer to Appendix A
for the exact derivations. Although using (A.4)and(A.5),
the success probability can be calculated, the computational
complexity of such calculation grows exponentially with the
size of history of transmission outcomes. Moreover along
with the outcome of each transmission the packet size
should also be stored. Thus, computational and memory
requirements of the exact method makes it infeasible for
practical applications. Therefore, it is needed to derive
an approximate solution for the success probability giving
acceptable performance with minimal computational and
memory requirements.
6 EURASIP Journal on Wireless Communications and Networking
Channel sensing: idle
Interfering packets
SA packets
l
Figure 6: It is possible to have two interfering packets during
the transmission time, however the probability of such events is
negligible.
3.1.1. Approximate solution
As we mentioned before, the transmission of the packet
of size l in terms of the success probability is equivalent
to l successive Bernoulli trials. The success of each trial is
equivalent to the event of remaining in state idle. While the
failure of a Bernoulli trial is equivalent of changing from
state idle to busy. If the packet is successfully transmitted,
all of the Bernoulli trials were successful. On the other
hand, if such packet is failed, we know at least one of the
Bernoulli trials resulted in failure. It is however possible
that during the packet transmission time, the state of the
channel changes from idle to busy more than one time, that
is, two interfering packets were transmitted during that time
as shown in Figure 6.
Since in practical scenarios the interference probability
q
i
1, the probability of having two interfering packets
arriving during the packet transmission time of SA nodes
is negligible. With this consideration, we can simplify the
best estimate for the geometric parameter or equivalently the
Bernoulli success probability by counting the total number
of successes and failures in the underlying trials. Let s
t
and
f
t
denote the total number of successes and failures of the
underlying Bernoulli processes until transmission attempt t
whose packet size is l
t
. After the t’th transmission is finished
these variables are updated as follows:
success:
⎧
⎨
⎩
s
t+1
= s
t
+ l
t
,
f
t+1
= f
t
.
(9)
failure:
⎧
⎪
⎪
⎪
⎨
⎪
⎪
⎪
⎩
s
t+1
≈ s
t
+
1
q
t
−
1+(l
t
− 1)∗(1 − q
t
)
l
t
1 − (1 − q
t
)
l
t
,
f
t+1
≈ f
t
+1.
(10)
Note that in (10) the number of successful Bernoulli trials
that needs to be added to the previous number is equal to
the total number of idle time slots before the transition from
idle to busy happens—shown as the variable
l in Figure 6.
Since the SA node has no knowledge of when the collision has
happened,
l is a random variable whose distribution (B.2)
and its expected value (B.3)arederivedinAppendix B.The
expected value of
l is added to the total number of successes
in (10). Knowing s
t
and f
t
at anytime, the best estimate of the
traffic parameter q can be calculated:
q(t) =
f
t
s
t
+ f
t
+1
. (11)
Following the above formulation, the history of trans-
mission outcomes for each channel can be written as x(t)
=
(i
t
, b
t
, s
t
, f
t
) which we call the informational state of each
channel. Knowing this state, both the probability of idle and
the probability of success can be estimated. If the current
packet size is l, the transition probabilities Pr(x(t +1)
|x(t))
from the state x(t)
= (i
t
, b
t
, s
t
, f
t
) can be written as follows:
Pr
i
t
+1,b
t
, s
t
+ l
t
, f
t
|x(t)
=
p
idle
t
p
s
t
,
Pr(i
t
, b
t
+1,s
t
, f
t
|x(t)
=
1 −
p
idle
t
,
Pr
i
t
+1,b
t
, s
t
+
l, f
t
+1|x(t)
=
p
idle
t
1−
p
s
t
q
t
1 − q
t
l
1 −
1 − q
t
l
t
,for
l :1 l
t
− 1,
(12)
where
p
s
t
= (1 − q
t
)
l
t
is best estimate of packet success
probability at time t. In the last term in (12), the number
of successful Bernoulli trials could be between 0 and l
t
− 1
where its distribution is truncated geometric distribution
with parameter
q
t
. (Please refer to Appendix B).
3.2. Optimal policy
In order to determine the optimal policy, we need to establish
a mapping between informational states and possible actions
determining which channel should be selected for the next
transmission attempt. The actions are those that maximize
the sum of discounted rewards:
max
π
V
π
= E
∞
t=1
β
t
R(t)
. (13)
In this equation, β is a general discount factor. The dis-
counted form is adopted to give preference to immediate
rewards to prevent the policy to look too far ahead in time-
optimizing later rewards. That is crucial since in reality
the traffic parameters of different channels might slowly
change over time. It is worth to mention that the machinery
used to solve this problem is not limited to this definition.
Alternative definitions, such as the time average of rewards,
can also be considered and the corresponding optimal
strategies can be derived with minor changes.
The standard way to solve such a reinforcement learning
problem is to employ Markov decision process techniques
[7]. However, since the total number of states grows
exponentially with the number of channels, such techniques
are computationally infeasible. For example, if the maximum
number of statistics gathered of each type is S
max
and the
total number of channels is M then the state space has a size
proportional to S
4M
max
.
Fortunately, we can exploit the problem structure and
find the optimal policy using simpler techniques. To see this,
A. Motamedi and A. Bahai 7
x
i
(t) = (i, b, s, f )
x
i
(t +1)= (i, b, s + l
t
, f )
∀
j/=i
x
j
(t +1)= x
j
(t)
f
i
f
i
tt+1
R
i
(t) = l
t
∀
j/=i
R
j
(t) = 0
Figure 7: The dynamics of the problem are as such that when using
a channel, its state is updated while the state of all other channels
remain unchanged.
consider the dynamics of the state evolution and reward
generation as shown in Figure 7.Inthisscenario,aspectrum-
agile user has selected channel i with state x
i
(t) = (i, b, s, f )
for transmission period t. Given the transmission results
occurring in this period, a random reward R(t) is generated.
The state of channel i is updated to reflect the most recent
transmission results and the states of all other channels
remain however unchanged since no new information is
gained about them.
This behavior enables us to model the problem as a
multiarmed bandit problem [8]. In the basic version of
the multiarmed bandit problem, there are M-independent
machines. Let x
i
(t) be the state of machine i at time t.At
each time instance we can only use one of the machines. If we
select machine i, we gain an immediate reward of R
i
(x
i
(t))
which is a—potentially random—function of the machine
and its state. The state of the selected machine evolves in a
Markovian fashion, while the states of other machines are
not changed. The goal is to maximize the expected sum of
discounted rewards.
The reason why this problem is called the multiarmed
bandit problem is due to the old problem of a bandit in a
casino who is faced with the choice between different slot
machines. At each time he can pull the handle of only one
slot machine. Each slot machine wins one dollar with a
constant probability. The winning probabilities of different
slot machines could be different and they are initially
unknown to the bandit. He can only learn about them
by trying different machines and estimating their winning
probabilities. The problem is then to find the best strategy
that maximizes his profit.
There are two irreconcilable objectives: the first one is
to learn (i.e., estimate) the winning probability of each slot
machine while the second objective is to use the slot machine
that is proven to have the highest winning probability so
far. The first objective, which is also called exploration,
can harm the second objective by reducing the total profit
by trying potentially inferior slot machines. The second
objective however can harm the first one by not exploring
potentially superior slot machines. The optimal solution to
the multiarmed bandit problem should maintain a balance
between the two objectives to maximize the total expected
profit. In [8], the authors solved this problem by introducing
a dynamic allocation index for each machine as function
of its state: v
i
(x
i
(t)). They proved the optimal strategy is to
choose the machine with this maximum index value. This
optimal index rule is
v
i
x
i
=
max
τ>1
E
τ−1
t=1
β
t
R
i
(t)|x
i
(1) = x
i
E
τ−1
t=1
β
t
|x
i
(1) = x
i
. (14)
The maximization is taken over the set of all possible
stopping times τ. This index value is called the dynamic
allocation index or Gittins Index. In some sense, it represents
the maximum expected reward rate starting from each
state. It is an important result because it transforms the
M-dimensional original problem into M one-dimensional
problems of calculating the index values. In our problem,
these indices represent the quality of each channel driven by
the reward function.
3.2.1. Calculation of the allocation indices
In general, Gittins indices are difficult to calculate [8].
However, if the states evolve according to a finite-state
Markov chain, the allocation indices can be efficiently
calculated [9]. In order to find the approximate values of the
Gittins indices for the channel selection problem, the state
space is truncated by limiting the total number of statistics
stored for each transmission outcome, that is, 0
≤ i ≤ I
max
,
0
≤ b ≤ B
max
,0≤ s ≤ S
max
,0≤ f ≤ F
max
. Whenever the
state of one channel reaches the boundaries, it will remain
unchanged. Otherwise, the transition probabilities are given
in (12). The expected reward that can be obtained in the next
transmission period is given by
R(t) =
p
idle
t
p
s
t
, (15)
where the best estimates of the traffic parameters emerging
in (15)and(12) are obtained from the current state using
(7)and(11).
The Gittins indices can then be calculated by knowing the
transition probabilities and the expected reward from each
state using the algorithm described in [9]. Figure 8 shows the
Gittins indices as a function of s and f . Note that the values
of indices are proportional to s and inversely proportional
to f as expected. It is interesting to note that the states
whose number of trials is close to the starting point, that
is, x(t)
= (0, 0, 0,0), have higher index than most of the
other states. This property of the Gittins indices makes the
algorithm try unexplored channel until enough information
is gained about them.
3.2.2. Channel selection algorithm
The channel selection can be described using the Gittins
indices. Every channel starts at state x(0)
= (0,0,0,0).
After each transmission attempt, the Gittins index of the
selected channel is recalculated according to the transmission
outcome and the packet size using (9)and(10). The channel
8 EURASIP Journal on Wireless Communications and Networking
0.2
0.4
0.6
0.8
1
200
100
0
S
0
5
10
f
Gittins indices for L
= 10
Starting point
Figure 8: The Gittins Indices for the truncated state space.
for each j ∈{1 M}
do b
j
= i
j
= s
j
= f
j
= 0
while there is packet to send
do
⎧
⎪
⎪
⎪
⎪
⎪
⎪
⎪
⎪
⎪
⎪
⎪
⎪
⎪
⎪
⎪
⎪
⎪
⎪
⎪
⎪
⎪
⎪
⎪
⎪
⎪
⎪
⎪
⎪
⎪
⎪
⎪
⎪
⎪
⎪
⎪
⎪
⎪
⎪
⎪
⎪
⎨
⎪
⎪
⎪
⎪
⎪
⎪
⎪
⎪
⎪
⎪
⎪
⎪
⎪
⎪
⎪
⎪
⎪
⎪
⎪
⎪
⎪
⎪
⎪
⎪
⎪
⎪
⎪
⎪
⎪
⎪
⎪
⎪
⎪
⎪
⎪
⎪
⎪
⎪
⎪
⎪
⎩
remove old statistics.
v
j
= G
L
(b
i
, i
j
, s
j
, f
j
)
ch
= max
i
v
i
sense (ch)
if (busy)
then b
ch
← b
ch
+1
else
⎧
⎪
⎪
⎪
⎪
⎪
⎪
⎪
⎪
⎪
⎪
⎪
⎪
⎪
⎪
⎪
⎪
⎨
⎪
⎪
⎪
⎪
⎪
⎪
⎪
⎪
⎪
⎪
⎪
⎪
⎪
⎪
⎪
⎪
⎩
transmit (ch)
i
ch
← i
ch
+1
if success
then s
ch
← s
ch
+ l
t
else update (s
ch
);
f
ch
← f
ch
+1
Algorithm 1: Online channel selection algorithm.
with the highest Gittins index will be selected in the following
transmission attempt.
Since the traffic parameters typically slowly change over
time, the channel selection algorithm should only consider
the most recent transmission statistics as a basis for esti-
mation and adaptation. Thus for calculating the allocation
indices at time t, the SA user only considers the transmission
statistics that were gathered in the time interval [t
− W, t].
This forget mechanism ensures the algorithm converges to the
new best channel when the traffic parameters change. The
pseudocode of the adaptive channel selection algorithm is
described in Algorithm 1, where the statistics are updated
according to (9)and(10).
4. NUMERICAL RESULTS
In order to see how effective the channel selection algorithm
is, we implemented a simple sense-before-talk media access
control protocol similar to our channel access model. In this
model, each channel alternates between two states busy and
idle. The duration of busy states is random with unknown
average, and the duration of idle time slots is governed
by geometric random variables with different parameters.
Those parameters are randomly selected at the beginning of
the simulation. The SA nodes have always packets to trans-
mit. If the selected channel is idle at the time of transmission,
the node starts using that channel for the duration of its
packet. If during the entire packet transmission time the
channel remains idle, the packet is successful otherwise a
failure will be recorded for that channel. Since the superiority
of the algorithm with spectrum-agility to the case with no
spectrum-agility is obvious, we have also implemented some
sensible heuristic channel selection techniques to see how
our complex adaptation compares with crude adaptation
schemes with less complexity. Among the heuristic methods,
the followings were the best performers:
(i) most success to failure ratio: ch
opt
= max
i
(s
i
/f
i
),
(ii) most success minus failure: ch
opt
= max
i
(s
i
− f
i
).
In the first round of simulation, the packet sizes are
uniformly selected in the interval [L
min
= 2,L
max
= 10].
The simulation time is equal to T
sim
= 1000 time slots.
Number of channels is M
ch
= 16. The traffic parameters q
i
for each channel are selected in a way that among the 16
channels a group of them are superior to others (are less
congested) and among those, one of them is the best. The
goal is to observe how the algorithms track the best channel.
The performance metric is the expected channel utilization
over time that captures the ability of the channel selection
algorithm to opportunistically use those channels that are
not being used by interfering users.
The expected utilization is calculated by averaging the
instantaneous utilization of numerous trajectories with
the same traffic parameters. Figure 9 shows the expected
utilization of the executed scenario obtained by averaging
N
= 10000 trajectories.
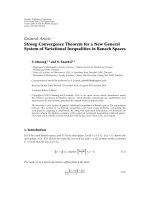
As can be seen, the expected utilizations start to grow as
time passes as both algorithms learn more about the chan-
nels. The optimal algorithm shows an exploratory behavior
in the first 200 time slots and eventually converges to the
best channel whose expected utilization is E[U]
= 0.76. On
the other hand, the best heuristic algorithm does not show
such a behavior and converges to one of the relatively good
channels with E[U]
= 0.58 but certainly not the best one.
During some parts of the exploratory phase, the optimal
channel selection has the utilization which is less than that
of the heuristic method. This suggests that during this phase,
the optimal channel selection uses unexplored channel with
the hope that those are better that the ones that were tried
in the initial transmission attempts with modest number
of successes. The heuristic algorithm finds a channel with
acceptable quality very fast and stays with it forever, while the
A. Motamedi and A. Bahai 9
0
0.2
0.4
0.6
0.8
0 200 400 600 800 1000
Expected utilization
Time slots
Optimal
Best heuristic
Figure 9: Average utilization over time for both the optimal and
heuristic channel selection algorithms. Only the optimal algorithm
is guaranteed to eventually converge to the best channel.
0
0.2
0.4
0.6
0.8
02468101214161820
×10
2
Time slots
Tracking the best channel
Optimal
Best heuristic
Figure 10: The optimal channel selection tracks the best channel
even if the traffic parameters change during the simulation time.
optimal algorithm pays the price of exploration at the initial
phase and reaps the benefit of using the best channel forever.
In the second round of simulation, we use the same
scenario as the first round, except that the simulation time
T
sim
= 2000 time slots and the traffic parameters change
at time slots numbers: 500,1000, 1500. The same forget
mechanism is used for both algorithms to have a fair
comparison. The expected channel utilization is shown in
Figure 10. As can be seen, the optimal channel selection
combined with the forget mechanism tracks the best channel
every time a change happens in the traffic parameters. This
behavior is essentially important in practical scenarios in
which the traffic parameters slowly change over time like in
the measurement of 802.11 networks shown in Figure 4.
5. CONCLUSION
In this paper, we proposed a channel selection strategy
that can be used by spectrum-agile users to avoid harmful
interference. The solution does not rely on prior knowledge
of the traffic patterns of interfering users, nor does it rely
on the availability of extra hardware for periodic spectrum
scanning. By formulating the channel selection problem
as a multiarmed bandit problem, the spectrum-agile node
can achieve the optimal trade-off between exploration, that
is, to find the interference patterns in each channel, and
exploitation, that is, to use the channel that is optimal so far.
We first showed through trafficmeasurementofan
802.11 based network—as an example of a packet switched
network in the unlicensed band—that the underlying
assumptions on the interfering traffic model that motivated
the use of multiarmed bandit formulation are valid. We
then calculated the optimal allocation indices for the channel
selection using efficient algorithms. Next, we implemented
the proposed algorithm on top of a simple sense-before-talk
media access protocol. Finally, the simulation results showed
the proposed algorithm consistently tracks the best channel
over time.
APPENDICES
A. ESTIMATING THE SUCCESS PROBABILITY
In this section, we derive the expression of the interference
probability q and the best estimate for the success probability
as a function of the history of transmission results. Lets
assume f
q
t
(x) be the density function of the parameter q until
transmission attempt t. After the transmission of a packet
with size l, the posterior distribution of the interference
probability at time t +1isgivenby
f
q
t+1
(x)|success =
(1 − x)
l
f
q
t
(x)
1
0
(1 − x)
l
f
q
t
(x)dx
,(A.1)
f
q
t+1
(x)|failure =
1 − (1 − x)
l
f
q
t
(x)
1
0
(1 − x)
l
f
q
t
(x)dx
. (A.2)
Let us define L(t)
= [l
1
, l
2
, , l
s
t
] be the vector of packets
sizes that have been successfully transmitted; and
L(t) =
[l
1
, l
2
, , l
f
t
] be the vector of failed packets until time t.If
we assume initially the interference probability is uniformly
distributed in [0,1], we can write the distribution of the
interference probability at time t as follows:
f
q
t+1
q|L(t), L(t)
=
s
i
=1
(1 − q)
l
i
f
j
=1
1 − (1 − q)
l
j
1
0
s
i=1
(1 − r)
l
i
f
j
=1
1 − (1 − r)
l
j
dr
.
(A.3)
Let us define Φ(L,
L) =
1
0
x
l
1
···x
l
s
(1 − x)
l
1
···(1 −
x)
l
f
dx. Using this definition, it can be easily seen that the
success probability of the packet l
t+1
(i.e., the current packet)
can be written as
p
s
(l
t+1
) =
1
0
(1 − x)
l
t+1
f
x
t+1
x|L(t), L(t)
=
Φ
L(t); l
t+1
, L(t)
/Φ
L(t), L(t)
(A.4)
10 EURASIP Journal on Wireless Communications and Networking
By integrating the expression for the function Φ(·)we
have
Φ
L(t), L(t)
=
(−1)
0
i
l
i
+1
+
j
(−1)
1
i
l
i
+ l
j
+1
+
j
/
=k
k
(−1)
2
i
l
i
+l
j
+l
k
+1
+
···+
(
−1)
f
i
l
i
+
j
l
j
+1
.
(A.5)
Equation (A.5) can be calculated by knowing the history
H(t). However, the calculation time grows exponentially
with the size of the history.
B. FIRST-TIME-TO-FAILURE RANDOM VARIABLE
In this section, we derive the expected value of the first time to
failure random variable
l in our model. Let T
ib
be the random
variable indicating the first time a channel goes back to busy
state from the time it is sensed idle. Since the duration of the
idle times are assumed to be geometric, it can be seen that
given the fact that the channel was initially idle, the duration
of the first time that the channel goes to busy state is also
geometrically distributed with the same parameter:
Pr
T
ib
= k
= Pr
idle(i) = k|t
0
= idle
=
1 − q
i
k−1
q
i
.
(B.1)
Now consider the fact that a packet of size l has failed.
This happened because the selected channel that was initially
idle becomes busy during the packet transmission time.
Thus, the distribution of the idle time since the channel states
changes
l is similar to distribution of T
ib
− 1 conditioned on
the fact that T
ib
≤ l,thus,
Pr
{
l = k}=Pr
T
ib
= k +1|T
ib
≤ l
=
q(1 − q)
k
1 − (1 − q)
l
k :0 l− 1.
(B.2)
The expected value of
l which is used to calculate the
expected number of successful Bernoulli trials in the update
rules (10)isthusgivenby
E
l
=
l−1
k=0
kq(1 − q)
k
1 − (1 − q)
l
=
1
q
−
1+(l − 1)(1 − q)
l
1 − (1 − q)
l
. (B.3)
ACKNOWLEDGMENT
The authors would like to thank Pravin Variaya and other
anonymous reviewers for their useful comments and feed-
backs.
REFERENCES
[1] Steinbeis-Transfer Centre, “Compatibility of IEEE 802.15.4
(Zigbee) with IEEE802.11 (WLAN), Bluetooth, and Microwave
Ovens in 2.4 GHz ISM-Band,” />[2] N. Golmie, O. Rebala, and N. Chevrollier, “Bluetooth adaptive
frequency hopping and scheduling,” in Proceedings of the IEEE
Military Communications Conference (MILCOM ’03), vol. 2, pp.
1138–1142, Monterey, Calif, USA, October 2003.
[3] X. Jing and D. Raychaudhuri, “Spectrum co-existence of IEEE
802.11b and 802.16a networks using CSCC etiquette protocol,”
in Proceedings of the 1st IEEE Symposium on New Frontiers in
Dynamic Spectrum Access Networks (DySPAN ’05), pp. 243–250,
Baltimore, Md, USA, November 2005.
[4] J. Mo, H S. Wilson So, and J. Walrand, “Comparison of
multichannel MAC protocols,” IEEE Transactions on Mobile
Computing, vol. 7, no. 1, pp. 50–65, 2008.
[5] G. Bianchi, “Performance analysis of the IEEE 802.11 dis-
tributed coordination function,” IEEE Journal on Selected Areas
in Communications, vol. 18, no. 3, pp. 535–547, 2000.
[6] />[7]R.S.SuttonandA.G.Barto,Reinforcement Learning: An
Introduction, Cambridge, Mass, USA, MIT Press, 1998.
[8] J. C. Gittins, Multi-Armed Bandit Allocation Indices,JohnWiley
& Sons, New York, NY, USA, 1989.
[9] P. P. Varaiya, J. C. Walrand, and C. Buyukkoc, “Extensions of
the multiarmed bandit problem: the discounted case,” IEEE
Transactions on Automatic Control, vol. 30, no. 5, pp. 426–439,
1985.