Báo cáo hóa học: " Research Article Optimization-Based Image Segmentation by Genetic Algorithms" ppt
Bạn đang xem bản rút gọn của tài liệu. Xem và tải ngay bản đầy đủ của tài liệu tại đây (4.27 MB, 10 trang )
Hindawi Publishing Corporation
EURASIP Journal on Image and Video Processing
Volume 2008, Article ID 842029, 10 pages
doi:10.1155/2008/842029
Research Article
Optimization-Based Image Segmentation by
Genetic Algorithms
S. Chabrier,
1
C. Rosenberger,
2
B. Emile,
3
and H. Laurent
3
1
Laboratoire Terre-Oc
´
ean, Universit
´
edelaPolyn
´
esie Francaise, B.P. 6570, 98702 Faa’a, Tahiti, Polyn
´
esie Franc¸aise, France
2
Laboratoire GREYC, ENSICAEN-Universit
´
e de Caen-CNRS, 6 Boulevard du Mar
´
echal Juin, 14050 Caen cedex, France
3
Institut PRISME, ENSI de Bourges-Universit
´
ed’Orl
´
eans, 88 Boulevard Lahitolle, 18020 Bourges cedex, France
Correspondence should be addressed to H. Laurent,
Received 24 June 2007; Revised 12 November 2007; Accepted 8 February 2008
Recommended by Ling Guan
Many works in the literature focus on the definition of evaluation metrics and criteria that enable to quantify the performance of an
image processing algorithm. These evaluation criteria can be used to define new image processing algorithms by optimizing them.
In this paper, we propose a general scheme to segment images by a genetic algorithm. The developed method uses an evaluation
criterion which quantifies the quality of an image segmentation result. The proposed segmentation method can integrate a local
ground truth when it is available in order to set the desired level of precision of the final result. A genetic algorithm is then used in
order to determine the best combination of information extracted by the selected criterion. Then, we show that this approach can
either be applied for gray-levels or multicomponents images in a supervised context or in an unsupervised one. Last, we show the
efficiency of the proposed method through some experimental results on several gray-levels and multicomponents images.
Copyright © 2008 S. Chabrier et al. This is an open access article distributed under the Creative Commons Attribution License,
which permits unrestricted use, distribution, and reproduction in any medium, provided the original work is properly cited.
1. INTRODUCTION
Segmentation is an essential step in image processing since
it conditions the quality of the resulting interpretation. Lots
of approaches have been proposed and a dense literature
is available [1–4]. In order to extract as much information
as possible from an environment, multicomponents images
can be used. In the last decade, multicomponents images
segmentation has received a great deal of attention for remote
sensing and industrial applications because it significantly
improves the discrimination and the recognition capabilities
compared with gray-levels images segmentation methods. To
process these images, there are two types of segmentation
methods: the scalar and the vectorial approaches. The first
one consists in merging the segmentation result of each band
[2, 5, 6]. The second one tries to generalize the classical
segmentation process of one-component images [7].
Some works have applied genetic algorithms (GA) to
image processing [8] and to segmentation particularly [9–
12]. As segmentation can be seen as a process which finds
out the optimal regions partition of an image according to a
criterion, GA are well adapted to achieve this goal. Indeed,
GA are particularly efficient when the search space is really
important and when the criterion to optimize is numerically
complicated which is always the case in image processing.
The main advantages of using GA for segmentation lie in
their ability to determine the optimal number of regions of
asegmentationresultortochoosesomefeaturessuchasthe
size of the analysis window or some heuristic thresholds.
The GA proposed by Holland [13] are a general-purpose
global optimization technique based on randomized search.
They incorporate some aspects of iterative algorithm. A
genetic algorithm is based on the idea that natural evolution
is a search process that optimizes the structures it generates.
An interesting characteristic of GA is their high efficiency
for difficult search problems without being stuck in local
extremum. In a GA, a population of individuals, described
by some chromosomes, is iteratively updated by applying
operators of selection, mutation, and crossover to solve the
problem. Each individual is evaluated by a fitness function
that controls the population evolution in order to optimize it.
Bhanu and Lee [9] used GA to optimize the parameters
of a segmentation method under various conditions of image
acquisition. Another illustration of the interest of GA for
image segmentation is given by Yoshimura and Oe [14]. They
combined GA and Kohonen’s self-organizing map for the
2 EURASIP Journal on Image and Video Processing
Segmentation
method
Unsupervised
evaluation
Statistical measures
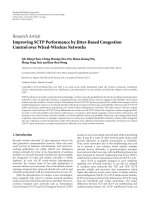
Figure 1: Principle of unsupervised evaluation criteria of an image
segmentation result.
clustering of textured images. The fuzzy C-means algorithm
was used to generate a fine segmentation result. Andrey
[15] suggested an original approach as no objective fitness
function is needed to evaluate segmentation results. Li and
Chiao [16] proposed a genetic algorithm dedicated to texture
images where the fitness function is based on texture features
similarity. Melkemi et al. [17] use genetic algorithms to
combine different segmentation results obtained by different
agents. A recent work proposed by Lai and Chang uses a
fitness function that can be considered as an evaluation
criterion in a hierarchical process [18]. No study of the
used fitness function has been done in order to quantify its
reliability.
The most important components of the proposed meth-
ods concern both the modelling of the problem with GA and
the definition of the fitness function. GA can be used to find
out the optimal label of each pixel, to determine the optimal
parameters of a segmentation method (number of regions,
e.g.), or to merge regions of a fine segmentation result.
Concerning the fitness function, it can be an unsupervised
quantitative measure of a segmentation result or a supervised
one using some a priori knowledge.
Inthispaper,wedealwithageneralschemefor
gray-levels and multicomponents image segmentation that
involves a GA. GA is used here as an optimization method
for the optimal combination of segmentation results whose
quality is quantified through an evaluation criterion. We
define a general scheme to define segmentation methods by
optimization. Note that we try in this paper to evaluate the
reliability of the fitness functions we used in our method.
We illustrate the proposed method by defining different
types of fitness functions in Section 2. The first one uses the
value of an unsupervised evaluation criterion computed on
a segmentation result. The second one uses a semisupervised
evaluation criterion by taking into account a local ground
truth when it is available. The last one shows the generaliza-
tion for multicomponents images. In Section 3,wedescribe
the optimization process with GA. We show the efficiency
of the proposed method through experimental results on
gray-levels and multicomponents images in Section 4.In
Section 5, we conclude and give some perspectives.
2. FITNESS FUNCTIONS
The developed method consists in looking for the optimal
combination of segmentation results by taking into account
an evaluation criterion and by using a genetic algorithm. We
define in the following subsections some evaluation criteria
for different purposes concerning the segmentation process.
2.1. Evaluation principles
Numerous works deal with the problem of the evaluation of
a segmentation result [19, 20]. Zhang [21] presents a possible
classification of the evaluation criteria in three groups:
(i) the “analytical methods” which permit to character-
ize an algorithm in terms of principles, needs, com-
plexity, convergency, stability, and so forth, without
any reference to a concrete implementation of the
algorithm or testing data,
(ii) the “empirical goodness methods” also called unsu-
pervised criteria which compute a fitness metric on
a segmentation result. They do not necessitate any
knowledge on the segmented images to assess and
their principles consist in an estimation of the quality
of a segmentation result according to some statistics
computed on each region, class, texture or fuzzy set
detected, mostly often by using a statistical point of
view (see Figure 1),
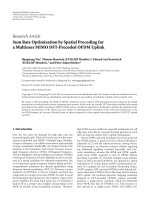
(iii) the “empirical discrepancy methods” also called
supervised criteria which compute some measures
of dissimilarity between a segmentation result and
the desired segmentation result (see Figure 2). They
thus assess the quality of a segmentation result by
using an a priori knowledge. This knowledge can be
a segmentation result used as a reference which is
called ground truth (GT) or some knowledge on the
elements to recognize.
Our center of interest is to evaluate the quality of a
segmentation result, thus the analytical criteria are not
studied in this paper. Moreover, we have chosen for this study
to focus on criteria which assess region segmentation results
because it is a complex problem. In the next section, we study
some unsupervised evaluation criteria.
2.2. Unsupervised evaluation
Unsupervised evaluation criteria give an information on
the coherence of a segmentation result quality. The main
objective of a previous work presented in [22]wasto
determine the supervised evaluation criterion, within a
selection of criteria from the literature, having the best
behavior in comparison with human experts judgement. To
achieve this goal, two main steps have been realized. The
first one concerns the ranking of segmentation results of
some images by human experts. The second one concerns
S. Chabrier et al. 3
Table 1: Value of the SRCC
Vinet
of each criterion of the comparative study.
Criteria Inter Rosenberger Zeboudj Intra-inter Intra Borsotti
Overall SRCC
Vinet
66.09%57.75% 49.40% 36.62% 31.32% 24.53%
Uniform SRCC
Vinet
73.72% 50.70% 88.45%65.97% 52.18% 65.73%
Mixed SRCC
Vinet
71.83%55.80% 54.51% 32.21% 33.51% 29.21%
Te x t u r e d S R C C
Vinet
74.61%64.98% 32.23% 23.46% 20.01% 11.10%
Textured2 SRCC
Vinet
33.62% 61.33%15.12% 32.27% 15.68% 11.20%
Segmentation
method
Supervised
evaluation
Metric
Expert
drawing
Figure 2: Principle of supervised evaluation criteria of an image
segmentation result.
the creation of a similarity measure able to compare the
evaluation behavior of the experts and of a criterion to
study. Thus, a similarity rate of correct comparison criterion
(SRCC) has been defined [22]. It computes the similarity of
judgment given by an evaluation criterion and an expert.
From this study, the Vinet’s criterion has been determined
as the one with the best behavior according to the human
experts.
In the following part of this paper, we briefly present the
results of a comparative study of unsupervised evaluation
criteria [23] by using the Vinet’s criterion as a reference in
the case of synthetic images for which the ground truth is
well known.
A set of synthetic images including 14 subsets of images
having, respectively, from 2 to 15 classes was created. Figure 3
presents some examples of the ground truths used to create
the images. Thus, each subset has a fixed number of classes
andismadeupof600imageswithaproportionoftextures
going from 0 to 100% by step of 25%. Figure 4 presents some
examples of synthetic images created by using this process.
We used three segmentation methods: the Fuzzy C
Means method (FCM) [24], a relaxation of this segmentation
result and the mean shift algorithm (EDISON) [25]. In
addition to these three segmentation results, an obvious
synthetic segmentation result was added: the ground truth
used to create the subset of synthetic images. This result
is the best possible one. Figure 5 presents an example of
segmentation results obtained by using these methods on an
image (the number of classes is supposed to be known for the
segmentation method).
We selected, from the state of art [21, 26], six unsuper-
vised evaluation criteria of gray level image segmentation
results into regions or classes.
(i) Zeboudj’s contrast (Zeboudj) [27]: this measure takes
into account the internal and external contrasts of the
regions measured in the neighborhood of each pixel.
(ii) Levine and Nazif’s interclass contrast (Inter) [28]:
this criterion computes the sum of contrasts of the
regions balanced by their surfaces.
(iii) Levine and Nazif’s intraclass uniformity (Intra) [28]:
this criterion computes the sum of the normalized
standard deviation of each region.
(iv) Combination of intraclass and interclass disparities
(Intra-inter) [28]: this indicator combines similar
versions of the Levine and Nazif interclass and
intraclass measures.
(v) Borsotti’s criterion (Borsotti) [29]: this measure is
based on the number, the surface, and the variance
of the regions.
(vi) Rosenberger’s criterion (Rosenberger) [26]: the origi-
nality of this criterion lies in its adaptive computation
according to the type of region (uniform or textured).
In the textured case, the dispersion of some textured
parameters is used and in the uniform case, gray
levels parameters are computed.
The Vinet’s criterion [30] proved to be the closest one
to the human judgement with a similarity rate of correct
comparison (SRCC) of 86% in the supervised case [22].
This criterion was thus selected as our reference and was
computed on the whole set of segmentation results obtained
on the images set (the associated ground truth is always avail-
able because we use synthetic images). The similarity rate
of correct comparison with the Vinet’s criterion (SRCC
Vinet
)
was computed for the different criteria on different images
subsets. The objective was to compare the classification
of the various segmentation results for each image by the
unsupervised evaluation criteria and the one established by
the Vinet’s criterion. The results were computed on the
whole images set (overall SRCC
Vinet
) and on images subsets
considering only uniform images (Uniform SRCC
Vinet
), only
textured images (Textured SRCC
Vinet
), uniform and tex-
tured images (Mixed SRCC
Vinet
),andtexturedimageswith
similar mean gray level between all the regions (Textured2
SRCC
Vinet
). The results are presented in Tabl e 1 .
In the case of completely uniform images, the Zeboudj’s
criterion proves to be the most efficient with a SRCC
Vinet
4 EURASIP Journal on Image and Video Processing
3 classes 6 classes 9 classes 11 classes 14 classes
Figure 3: Examples of ground truths used for the creation of the synthetic set of images.
3 classes 6 classes 9 classes 11 classes 14 classes
Figure 4: Examples of synthetic images from the images set.
Original image FCM FCM + relaxation EDISON Ground truth
Figure 5: Example of an image with 6 classes and its segmentation results with paired gray levels.
Original image Local ground truth
Figure 6: Example of a local ground truth: 3 sets are defined
meaning that pixels in these regions should belong in the same class.
superior to 88%. The Inter criterion is recommended in
the case of mixed images and for most textured ones. It
has a mean SRCC
Vinet
of more than 71% on the images
sets corresponding to these cases. Finally, the Rosenberger’s
criterion is the only discriminating criterion for the study of
segmentation results of images having textured classes with
the same average of gray levels with a SRCC
Vinet
of more
than 61%. If one takes into account the whole images set, the
Inter criterion appears to be the most efficient but presents a
SRCC
Vinet
of only 66%.
2.3. Supervised evaluation
In order to define the level of precision of the segmentation
result, we can use a local ground truth. A local ground truth
is defined as a small set of pixels with a known class. It is
used in the optimization process by computing the correct
classification rate (Vinet’s measure) on each cluster of the
local ground truth. An example of a local ground truth is
given in Figure 6. In this case, we set some examples of
regionsinanimage.
We call GT the local ground truth used in our method.
Given a segmentation result, we can compute the correct
classification rate for each cluster of GT. We define the
following criterion,
R
I
s
,GT
=
1
NbGT
Nbclass
i=1
Rate
C
i
,(1)
where NbGT is the number of pixels in GT. The value
Rate(C
i
) is the correct classification rate for the cluster
S. Chabrier et al. 5
C
i
. The correct classification rate for each pixel of GT is
integrated into this criterion. The higher this value is, the
more the result corresponds to the needed level of precision.
If Nbclass equals to zero, the segmentation process will be
unsupervised. The local ground truth can be seen as local
constraints set by a user. The R(I
s
, GT) term evaluates the
adequation of the segmentation result to GT (that means that
all the clusters of GT in the final segmentation result must be
as homogeneous as possible).
A new criterion can be defined by taking into account
some constraints on the level of precision of the segmenta-
tion result
SCR
I
s
,GT
=
CR
I
s
+ R
I
s
,GT
,(2)
where CR(I
s
, GT) is one of the unsupervised criteria detailed
in Section 2.2.TheSCR(I
s
, GT) criterion is a semisupervised
one.
2.4. Generalization to the multicomponents case
We define in this section the generalization of an unsu-
pervised evaluation criterion for multicomponents images.
The objective is to evaluate different segmentation results
(obtained by using different parameters) by combining the
values of an evaluation criterion by considering each band.
Three simple fusion methods are used: the minimum, the
maximum, and the average value of the criterion computed
on each band. In order to compare the different evaluation
methods in the multicomponents case, we used 20 synthetic
images with 5 components. Each image is segmented with
the MLBG method (K-means for the segmentation of
multicomponents images) [31] using 32 different parameter
settings. Vinet’s measure is used again as an objective
function and allows us to sort each segmentation result. For
each unsupervised evaluation method, each fusion method
gives a sorting of the 32 segmentation results for each
image. So judged, the best evaluation method associated
with the best fusion process is the one corresponding to
the best sorting which means that it is the most similar
to the Vinet’s measure for the 20 images. To compare two
sorting of segmentation results, we take into consideration
the sum of each difference between the position in the
sorting obtained by using the Vinet’s measure and an other
evaluation criterion.
Ta ble 2 shows that there is no fundamental difference
between the three fusion operators (mean, minimum, maxi-
mum). The best evaluation criterion in the multicomponents
case, in sense of our approach, is the Rosenberger’s criterion
with the fusion method based on the mean.
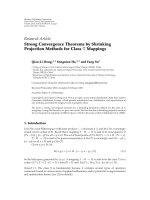
We applied this criterion in the multicomponents case.
Figure 7 presents three segmentation results of an MRI image
with 4 bands obtained by the MLBG method with different
parameters (windows size and others). The Rosenberger’s
criterion associated with mean fusion can sort the different
segmentation results. The presented result 3 is defined as the
best one (criterion: 0.731), before result 2 (criterion: 0.66),
and finally result 1 (criterion: 0.649). This sorting of these
segmentation results is difficult to validate with the visual
perception even if the last result seems to be more precise.
Table 2: Distance between criteria and Vinet with 3 fusion
approaches.
Mean Minimum Maximum
Zeboudj 187 187 170
Inter 137 143 121
Intra 187 187 187
Intra-inter 209 209 209
Borsotti 149 145 149
Rosenberger 51 52 56
3. OPTIMIZATION METHOD: A GENETIC ALGORITHM
Genetic algorithms determine the optimal value of a cri-
terion by simulating the evolution of a population until
survival of best fitted individuals [32]. The survivors are indi-
viduals obtained by crossing-over, mutation, and selection
of individuals from the previous generation. We think that
GA is a good candidate to find out the optimal combination
of segmentation results for two main reasons. The first one
is due to the fact that an evaluation criterion is not very
easy to differentiate. GA is an optimization method that
does not necessitate to differentiate the fitness function but
only to evaluate it. Second, if the population is enough
important considering the size of the search space, we have
good guarantees that we will reach the optimal value of the
fitness.
A genetic algorithm is defined by considering five
essential data:
(1) genotype: the segmentation result of an image I is
considered as an individual described by the class of
each pixel,
(2) initial population: a set of individuals characterized by
their genotypes. It is composed of the segmentation
results to combine,
(3) fitness function: this function enables us to quantify
the fitness of an individual to the environment
by considering its genotype. The evaluation criteria
described in the previous sections can be used as a
fitness function in the unsupervised case or in and in
the semisupervised cases,
(4) operators on genotypes: they define alterations on
genotypes in order to make the population evolve
during generations. Three types of operators are
used:
(a) individual mutation: individual’s genes are
modified in order to be better adapted to the
environment. We use the nonuniform mutation
process which randomly selects one chromo-
some x
i
, and sets it as equal to a nonuniform
random number,
x
i
=
⎧
⎨
⎩
x
i
+
b
i
−x
i
f (G)ifr
1
< 0.5,
x
i
−
x
i
+ a
i
f (G)ifr
1
≥ 0.5,
(3)
6 EURASIP Journal on Image and Video Processing
Band 1 Band 2 Band 3 Band 4
Result 1 Result 2 Result 3
Figure 7: Three segmentation results of a MRI image with 4 bands.
where
f (G)
=
r
2
1 −
G
G
max
b
r
1
, r
2
: numbers in the interval [0, 1]
a
i
, b
i
: lower and upper bound of
chromosome x
i
G : the current generation
G
max
: the maximum number of generations
b : a shape parameter
(4)
(b) selection of an individual: individuals that are
not adapted to the environment do not survive
to the next generation. We used the normal-
ized geometric ranking selection method which
defines a probability P
i
for each individual i to
be selected as follows:
P
i
=
q(1 −q)
r−1
1 −(1 −q)
n
,(5)
where
q : the probability of selecting the best
individual
r : the rank of individual, where 1
is the best
n : the size of the population
(6)
(c) crossing-over: two individuals can reproduce by
combining their genes. We use the arithmetic
crossover which produces two complementary
linear combinations of the parents;
X
= aX +(1−a)Y,
Y
= (1 −a)X + aY,
(7)
where
X,Y : genotype of parents
a : a number in the interval [0, 1]
X
, Y
: genotype of the linear combinations
of the parents
(8)
(5) stopping criterion: this criterion allows to stop the
evolution of the population. We can consider the
stability of the standard deviation of the evaluation
criterion of the population or set a maximal number
of iterations (we used the second one with the
number of iterations equal to 1000).
Given these five information, the execution of the genetic
algorithm is carried out in four steps:
(1) definition of the initial population (segmentation
results) and computation of the fitness function
(evaluation criterion) of each individual,
(2) mutation and crossing-over of individuals,
(3) selection of individuals,
(4) evaluation of individuals in the population,
(5) back to Step 2 if the stopping criterion is not satisfied.
4. EXPERIMENTAL RESULTS
In this paper, we show the results of two types of exper-
iments. First, we use the previously presented method to
segment gray levels images by combining several segmenta-
tion results. Second, we present some genetic segmentation
results of multispectral images. These images were acquired
with a CASI (Compact Airborne Spectrographic Imager).
For all the following experimental results, we set the
value of the selection probability to 8%, the crossing-over
probability to 60% and the mutation probability to 5%. The
unsupervised evaluation criterion we use in this paper is the
Rosenberger’s one because of the presence of textures in test
images.
S. Chabrier et al. 7
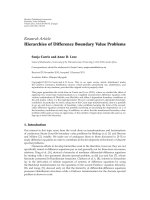
Original image CAR Segmentation result 1 (NC = 5)
Segmentation result 2 (NC = 10) Segmentation result 3 (NC = 12)
Segmentation result 4 (NC = 15)
Final result (NC = 6)
Figure 8: Unsupervised segmentation result of image CAR.
4.1. Genetic segmentation of gray levels images
First of all, we show the unsupervised genetic segmentation
result of one gray levels image called CAR (see Figure 8).
This image was segmented using the K-means algorithm
with mean and variance as attributes with different numbers
of clusters NC (5, 10, 12, 15) which constitutes the initial
population for the GA. In this case, the genotype of an
individual is a vector of size 262144 (the size of each image is
512
×512 pixels). A gene corresponds to the label of each pixel
in the considered segmentation result. Final result shows the
efficiency of the proposed method. If we look at the tree in
left of the CAR image, we see that this textured region is not
oversegmented like in the segmentation results we used in
the initial population. An important point is that we did not
specify in this experiment the number of clusters we wanted.
It has been automatically determined (NC
= 6).
Ta ble 3 gives some statistics about the GA for the
previous segmentation result. We show here the ability
CAR image
(a)
Result
(b)
AERIAL image
(c)
Result
(d)
Figure 9: Supervised segmentation results of two gray-levels
images.
of the GA to determine the best individual with a few
iterations. The value of the evaluation criterion of the best
segmentation result significantly increases. Note that we
obtain a good stability of the results for different executions
of this algorithm after 100 iterations.
We also present the supervised segmentation results of
two images by using the developed method (see Figure 9).
We define, for each original image, a local ground truth
in order to obtain a precise segmentation result. The local
ground truth defines some regions which must be present in
the final result. As for example, we define three regions in
Figure 9(a) and two in Figure 9(c), so we want in the final
result that pixels in these regions belong to the same class. As
we can see in the segmentation result (Figure 9(b)), the sky
is represented by a single cluster as the roof of the house and
the major part of the grass. For the image (c) of Figure 9,we
select some fields in order to make the interpretation of the
culture inside each field easier.
The initial population is composed of segmentation
results obtained by using the K-means algorithm with mean
andvarianceasattributeswithdifferent numbers of clusters
(5, 10, 12, 15). Segmentation results are visually correct.
Ta ble 4 gives the values of several optimized criteria. The
D
and D correspond to intermediate values used to compute
the Rosenberger’s criterion [26]. The D
computes the global
intraregion disparity and has to be close to zero (compu-
tation of the disparity of statistics inside the regions). The
second one computes the global interregion disparity
D and
must have as high value as possible. Value CR corresponds
8 EURASIP Journal on Image and Video Processing
(a) (b) (c)
(d) (e) (f)
Figure 10: Unsupervised segmentation result of a CASI multispectral image, (a) image component 1, (b)–(e) segmentation results of
components 1, 6, 7, and 9, (f) final segmentation result of the multicomponents image by merging with the proposed method the
segmentation result of each component.
Band A1
(a)
Band A9
(b)
Local ground truth
(c)
Segmentation result
(d)
Band B1
(e)
Band B9
(f)
Local ground truth
(g)
Segmentation result
(h)
Figure 11: Supervised segmentation results of two CASI multicomponents images.
S. Chabrier et al. 9
Table 3: Statistics for the initial and final population for the image CAR.
Information Image CAR
Initial population
Average value of criterion CR 0.1827
Highest value of criterion CR 0.1844
Lowest value of criterion CR 0.1809
Standard deviation of criterion CR 0.010
Final population
Average value of criterion CR 0.1986
Highest value of criterion CR 0.1986
Lowest value of criterion CR 0.1986
Standard deviation of criterion CR 5.2e-08
to the unsupervised criterion which quantifies the global
quality of a segmentation result (Rosenberger’s criterion).
Finally, the last criterion gives the correct classification rate
if we only consider the local ground truth. One can notice
that the values of each criterion are coherent. The correct
classification rate has a high value which shows the ability
of the proposed method to fit the level of precision of a
segmentation result.
We compared the supervised approach and the unsu-
pervised one by segmenting the same image AERIAL. The
evaluation results are detailed in Ta b le 5. These results show
that the evaluation criterion CR is higher in the unsupervised
case. This reveals the ability of the unsupervised approach
to determine the optimal value of CR while the use of a
ground truth allows us to match the level of precision of the
segmentation result.
4.2. Genetic segmentation of multispectral images
In this section, we present the unsupervised segmentation
result of a multispectral image composed of 9 bands (wave-
length in nm: 551.1, 571.5, 600.9, 636.5, 677.7, 696.5, 715.4,
749.5, 799.9) using the proposed method (see Figure 10).
Each component of this image was also segmented using the
K-means algorithm with mean and variance as attributes.
The final result is correct and combine well information
from each component. The application for this image was
to compute the biomass of algae lying on the beach. The
use of multispectral data provides us a better discrimination
of algae by taking account visible and also near infrared
information. As for example, the white square detected in
the segmentation result in Figure 10(c) on the top right is
present in the final result while it was not really visible in
Figure 10(d).
We present also the supervised segmentation result of
two multispectral images with a similar protocol. We show
the two most different components of these images (which
correspond to components 1 and 9). We define for each
original image a local ground truth in order to obtain
a precise segmentation result. For Figure 11(a), the local
ground truth corresponds to Figure 11(c). We select 2 types
of field and an area corresponding to some hedges. Each
component brings an additional piece of information, the
problem for these images is to take them into account
in the final result. As we can see in Figures 11(d) and
Table 4: Values of the evaluation criterion for results of Figure 9.
Final result D(I
s
) D(I
s
)CR(I
s
) R(I
s
,GT)
CAR 0.0045 0.3321 0.1638 98.4%
AERIAL 0.0040 0.2803 0.138 93.6%
Table 5: Values of the evaluation criterion by using the supervised
and unsupervised approaches to segment AERIAL.
Method D(I
s
) D(I
s
)CR(I
s
) R(I
s
,GT)
Supervised 0.004 0.2803 0.138 93.6%
Unsupervised 0.003 0.448 0.225 —
11(h), the segmentation results are visually correct and
correctly integrate additional information from the different
components. As for example, the dark region in the center
of the segmentation result (d) is correctly detected while it is
not visible in the component A9 (but visible in A1).
5. CONCLUSION AND PERSPECTIVES
Many works in the literature focus on the definition of
evaluation metrics that enable to quantify the performance
of an image processing algorithm. These evaluation criteria
can be used to define new image processing algorithms by
optimizing them. Genetic algorithms can be used for this
application.
In this paper, we focused on the interest of genetic
algorithms for image segmentation. We showed that this
kind of approach can be applied either for gray-levels or
multicomponents images. The developed method uses the
ability of GA to solve optimization problems with a large
search space (label of each pixel of an image). The developed
method can also integrate some a priori knowledge (such
as a local ground truth) if it is available. Its efficiency was
illustrated through some experimental results on several
CASI multispectral images.
Prospects for this work concern first of all the definition
of some new fitness functions in order to define edge
segmentation methods. Second, some a priori knowledge
such as specific shapes characteristics could be included in
the defintion of new fitness functions in order to facilate the
localization of some particular objects in an image.
10 EURASIP Journal on Image and Video Processing
REFERENCES
[1]N.R.PalandS.K.Pal,“Areviewonimagesegmentation
techniques,” Pattern Recognition, vol. 26, no. 9, pp. 1277–1294,
1993.
[2] C. Kermad and K. Chehdi, “Multi-bands image segmentation:
a scalar approach,” in Proceeding of the 13th IEEE International
Conference on Image Processing (ICIP ’00), vol. 3, pp. 468–471,
Vancouver, BC, Canada, September 2000.
[3]J.Fan,D.K.Y.Yau,A.K.Elmagarmid,andW.G.Aref,
“Automatic image segmentation by integrating color-edge
extraction and seeded region growing,” IEEE Transactions on
Image Processing, vol. 10, no. 10, pp. 1454–1466, 2001.
[4] M. Zhang, L. O. Hall, and D. B. Goldgof, “A generic
knowledge-guided image segmentation and labeling system
using fuzzy clustering algorithms,” IEEE Transactions on
Systems, Man, and Cybernetics, Part B, vol. 32, no. 5, pp. 571–
582, 2002.
[5] F. Huet and S. Philipp, “A multi-scale fuzzy classification by
knn: application to the interpretation of aerial images,” in
Proceedings of the 14th International Conference on Pattern
Recognition (ICPR ’98), vol. 1, pp. 96–98, Brisbane, Australia,
August 1998.
[6] S.M.SchweizerandJ.M.F.Moura,“Hyperspectralimagery:
clutter adaptation in anomaly detection,” IEEE Transactions on
Information Theory, vol. 46, no. 5, pp. 1855–1871, 2000.
[7] A. Winter, H. Ma
ˆ
ıtre,N.Cambou,andE.Legrand,“An
original multi-sensor approach to scale-based image analysis
for aerial and satellite images,” in Proceedings of the IEEE
International Conference on Image Processing (ICIP ’97), vol.
2, pp. 234–237, Santa Barbara, Calif, USA, October 1997.
[8] Y. Delignon, A. Marzouki, and W. Pieczynski, “Estimation of
generalized mixtures and its application in image segmenta-
tion,” IEEE Transactions on Image Processing, vol. 6, no. 10, pp.
1364–1375, 1997.
[9] B. Bhanu and S. Lee, Genetic Learning for Adaptive Image
Segmentation, Kluwer Academic Publishers, Norwell, Mass,
USA, 1994.
[10] D. N. Chun and H. S. Yang, “Robust image segmentation using
genetic algorithm with a fuzzy measure,” Pattern Recognition,
vol. 29, no. 7, pp. 1195–1211, 1996.
[11] P Y. Yin, “A fast scheme for optimal thresholding using
genetic algorithms,” Sig nal Processing,vol.72,no.2,pp.85–
95, 1999.
[12] M. Gong and Y H. Yang, “Genetic-based multiresolution
color image segmentation,” in Vision Interface Conference (VI
’01), pp. 141–148, Ottawa, Ontario, Canada, June 2001.
[13] J. H. Holland, Adaptation in Natural and Artificial Systems: An
Introductory Analysis with Applications to Biology, Control, and
Artificial Intelligence, The MIT Press, Cambridge, Mass, USA,
1975.
[14] M. Yoshimura and S. Oe, “Evolutionary segmentation of tex-
ture using genetic algorithms towards automatic decision of
optimum number of segmentation areas,” Pattern Recognition,
vol. 32, no. 12, pp. 2041–2054, 1999.
[15] P. Andrey, “Selectionist relaxation: genetic algorithms applied
to image segmentation,” Image and Vision Computing, vol. 17,
no. 3-4, pp. 175–187, 1999.
[16] C T. Li and R. Chiao, “Multiresolution genetic clustering
algorithm for texture segmentation,” Image and Vision Com-
puting, vol. 21, no. 11, pp. 955–966, 2003.
[17] K. E. Melkemi, M. Batouche, and S. Foufou, “A multia-
gent system approach for image segmentation using genetic
algorithms and extremal optimization heuristics,” Pattern
Recognition Letters, vol. 27, no. 11, pp. 1230–1238, 2006.
[18] C C. Lai and C Y. Chang, “A hierarchical evolutionary
algorithm for automatic medical image segmentation,” Expert
Systems with Applications. In press.
[19] R. Rom
´
an-Rold
´
an, J. F. G
´
omez-Lopera, C. Atae-Allah, J.
Mart
´
ınez-Aroza, and P. L. Luque-Escamilla, “A measure of
quality for evaluating methods of segmentation and edge
detection,” Pattern Recognition, vol. 34, no. 5, pp. 969–980,
2001.
[20] C. Rosenberger, S. Chabrier, H. Laurent, and B. Emile,
“Advances in image and video segmentation,” in Unsupervised
and Supervised Image Segmentation Evaluation,Y J.Zhang,
Ed., pp. 365–3923, Tsinghua University Press, Beijing, China,
2005.
[21] Y. J. Zhang, “A survey on evaluation method for image
segmentation,” Pattern Recognition, vol. 29, no. 8, pp. 1335–
1346, 1996.
[22] S. Chabrier, B. Emile, and H. Laurent, “Psychovisual evalu-
ationofanimagesegmentationresult,”inProceedings of the
8th International Conference on Signal Processing (ICSP ’06),
Guilin, China, November 2006.
[23] S. Chabrier, B. Emile, C. Rosenberger, and H. Laurent, “Unsu-
pervised performance evaluation of image segmentation,”
EURASIP Journal on Applied Signal Processing, vol. 2006,
Article ID 96306, p. 12, 2006.
[24] J. Bezdeck, Pattern Recognition with Fuzzy Objective Function
Algorithms, Plenum Press, New York, NY, USA, 1981.
[25] D. Comaniciu and P. Meer, “Mean shift: a robust approach
toward feature space analysis,” IEEE Transactions on Pattern
Analysis and Machine Intelligence, vol. 24, no. 5, pp. 603–619,
2002.
[26] C. Rosenberger, Mise en oeuvre d’un syst
`
eme adaptatif de
segmentation d’images, Ph.D. thesis, Universit
´
edeRennes1,
Rennes, France, Decembre 1999.
[27] R. Zeboudj, Filtrage, seuillage automatique, contraste et con-
tours: du pr
´
e-traitement
`
a l’analyse d’image, Ph.D. thesis,
Universit
´
e de Saint Etienne, Saint Etienne, France, 1998.
[28] M. D. Levine and A. M. Nazif, “Dynamic measurement of
computer generated image segmentations,” IEEE Transactions
on Pattern Analysis and Machine Intelligence, vol. 7, no. 2, pp.
155–164, 1985.
[29] M. Borsotti, P. Campadelli, and R. Schettini, “Quantitative
evaluation of color image segmentation results,” Pattern
Recognition Letters, vol. 19, no. 8, pp. 741–747, 1998.
[30] L. Vinet, Segmentation et mise en correspondance de r
´
egions de
paires d’images st
´
er
´
eoscopiques, Ph.D. thesis, Universit
´
edeParis
IX Dauphine, Paris, France, 1991.
[31] C. Rosenberger and K. Chehdi, “Unsupervised segmentation
of multi-spectral images,” in Proceedings of the International
Conference on Advanced Concepts for Intelligent Vision Systems
(Acivs ’03), Ghent, Belgium, September 2003.
[32] P. Wall, A genetic algorithm for resource-constrained scheduling,
Ph.D. thesis, Massachusetts Institute of Technology, Cam-
bridge, Mass, USA, 1996.